West Virginia Investor Pulse Report (2026-Q2)

Real Estate comprehensive investment analysis of investor activity in the West Virginia single-family residential housing market. Discover ownership trends, transaction patterns, and market insights.

Market Overview

Total SFR Properties in West Virginia
526,586
Total Investors in West Virginia
145,906
Investor Owned SFR in West Virginia
125,225(23.8%)
Individual Landlords
Landlords
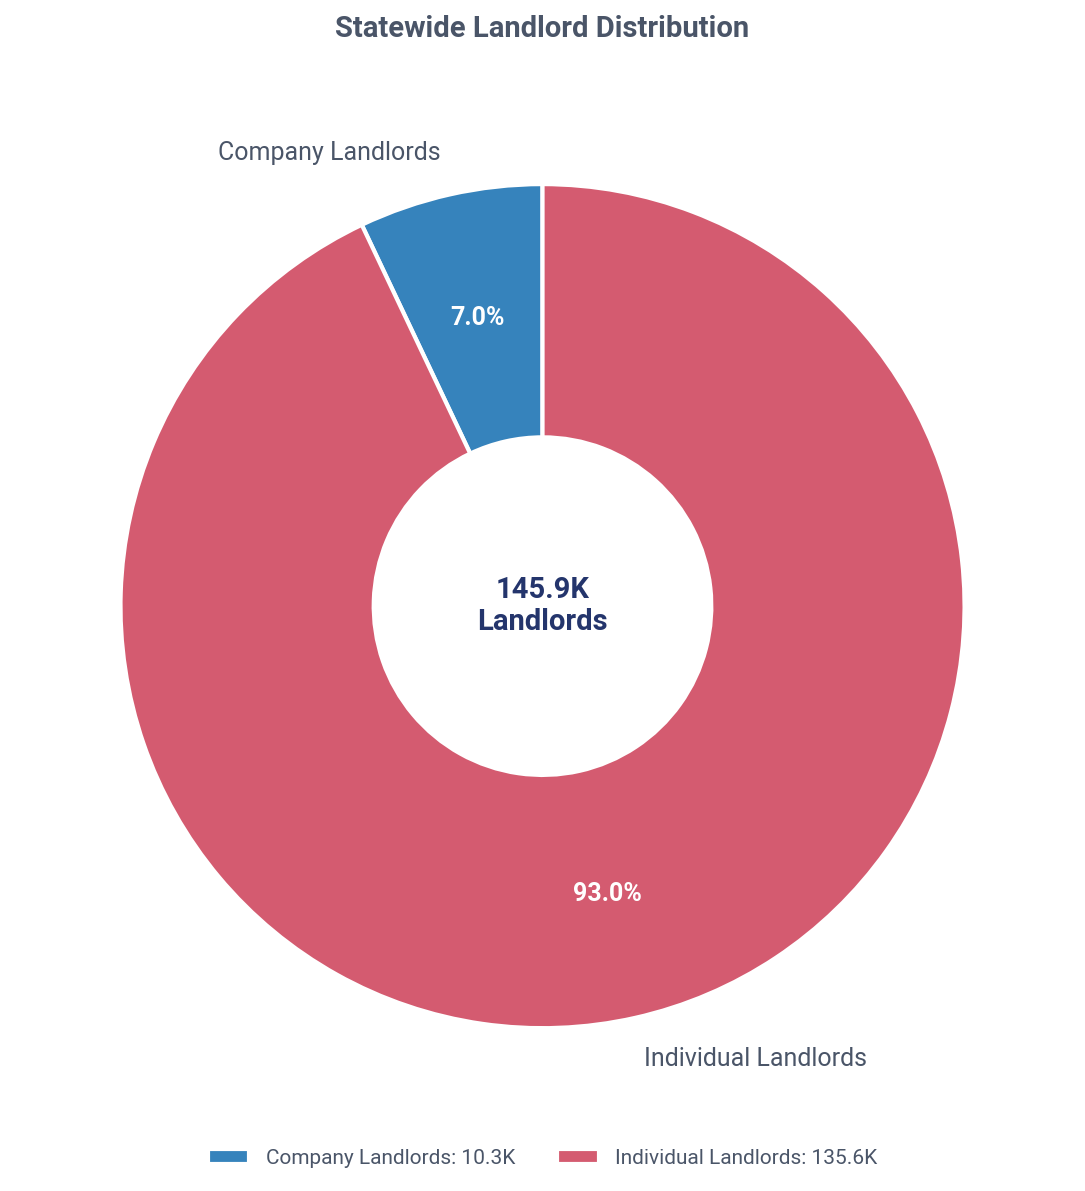
135,627
SFR Owned
107,472
Corporate Landlords
Landlords
10,279
SFR Owned
18,296
Understanding Property Counts

Distinct Count Methodology: The total 125,225 represents distinct properties - if 2+ landlords co-own the same property, it's counted only once. This provides the most accurate representation of investor-owned SFR properties.

Why totals don't sum: When broken down by Individual vs Corporate ownership (or by tier), properties with co-ownership across categories are counted once per category. For example, if a property is co-owned by an individual AND a corporate landlord, it appears in both counts. This is why Individual + Corporate totals may exceed the distinct total by 2-4%, and percentages may sum to 100-104%.

Market Visualization

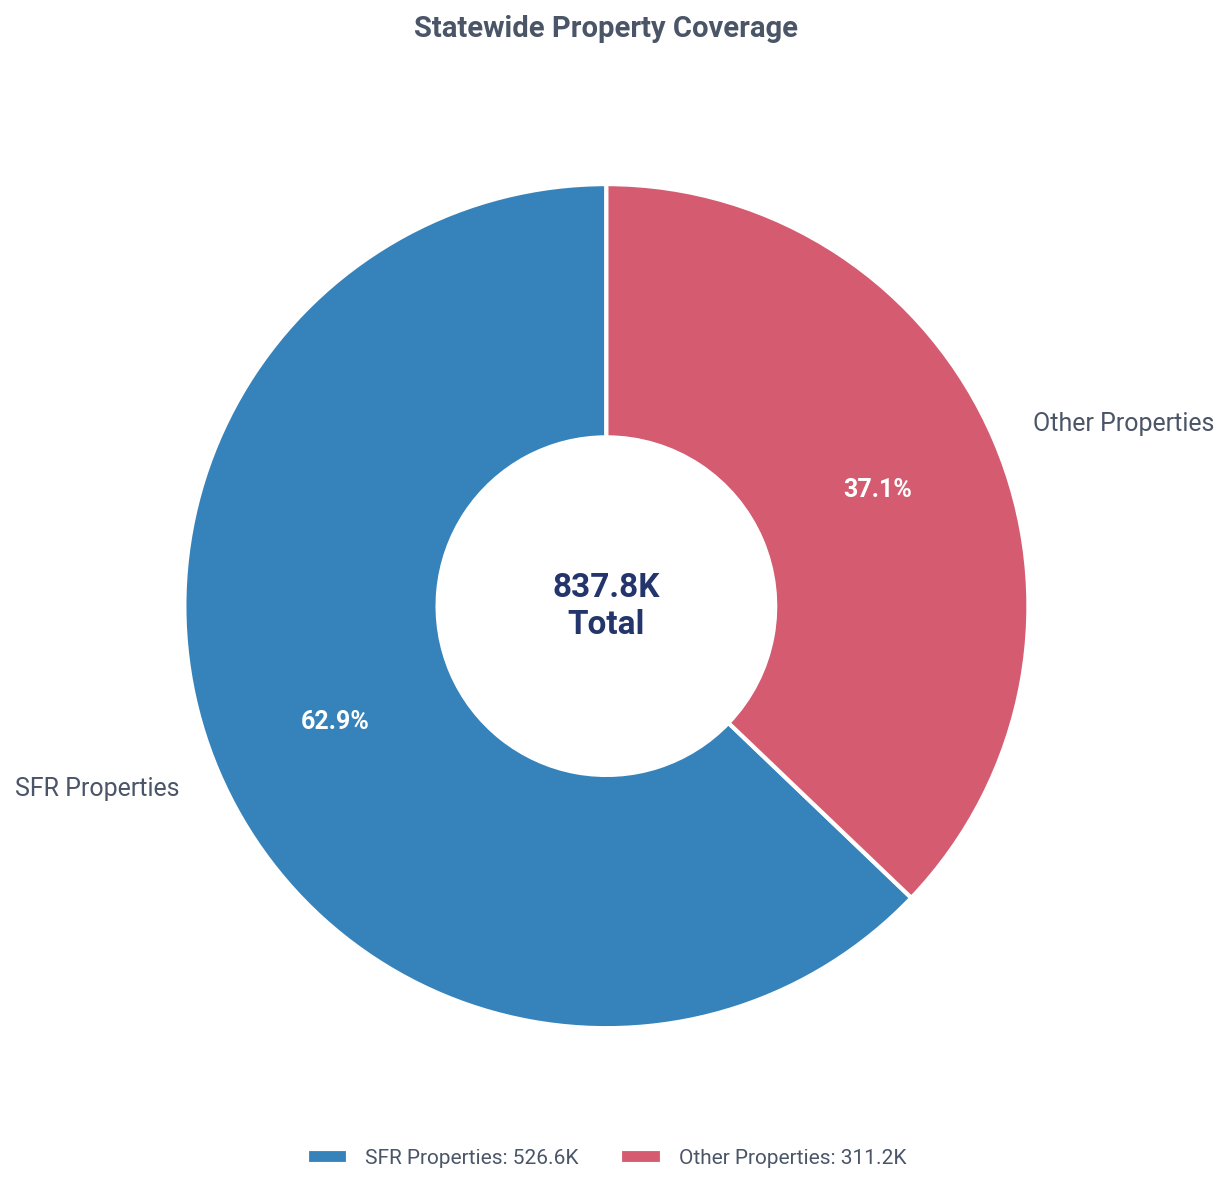
West Virginia: SFR vs other property coverage, Q2 2026
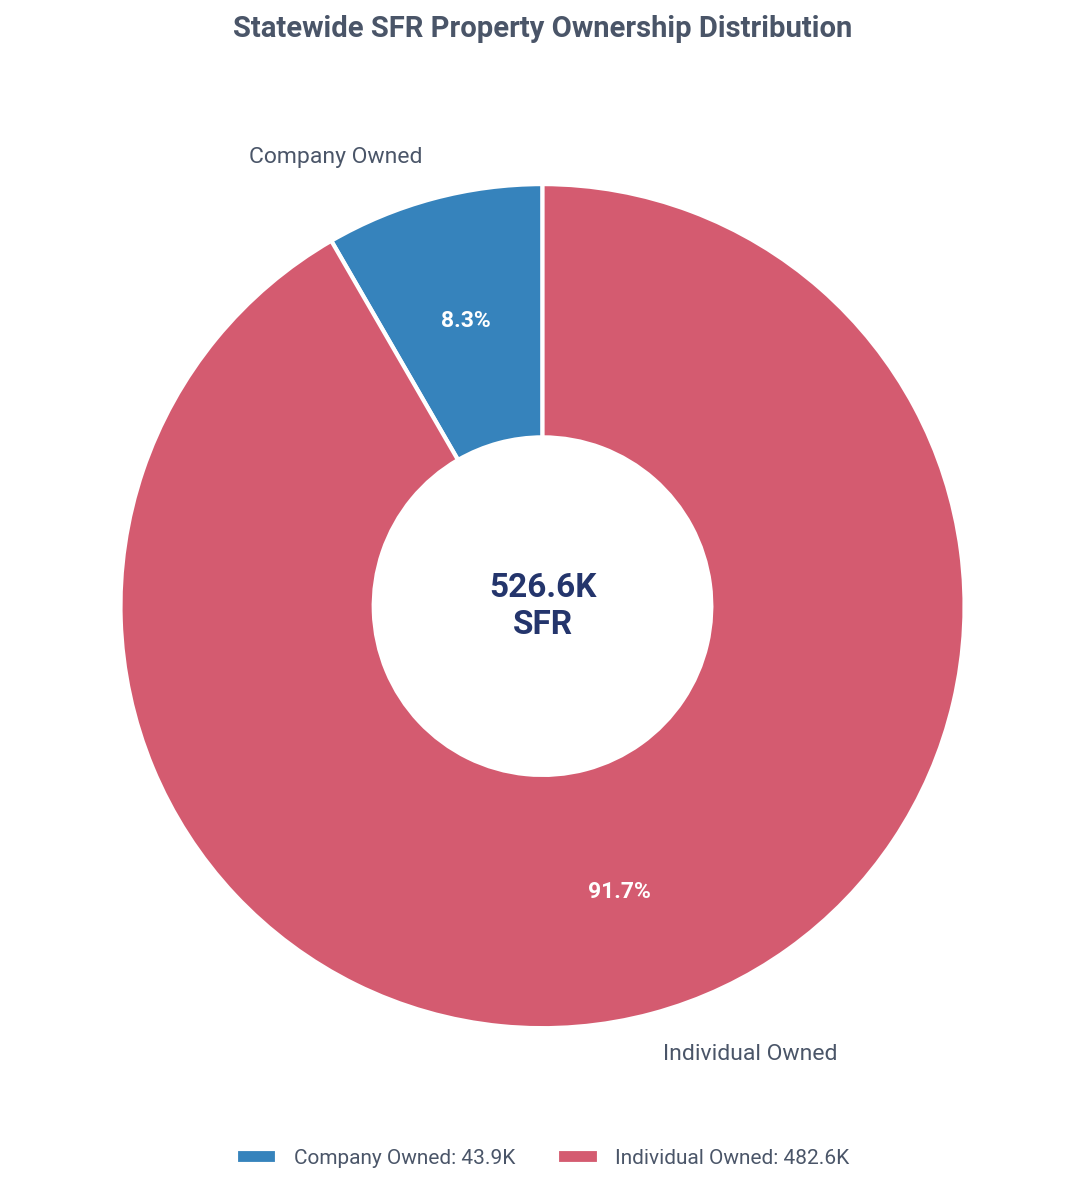
West Virginia: SFR ownership share, company vs individual, Q2 2026
West Virginia: company vs individual landlords, Q2 2026

Key Market Insights

West Virginia's SFR Market is Dominated by Small Investors Controlling 95% of Properties, Securing Deep Discounts
Investors own 125,225 SFR properties in West Virginia, representing 23.8% of the total market. This ownership is overwhelmingly concentrated among 'mom-and-pop' landlords (95.2%), while institutional investors hold a mere 0.1%. In Q2 2026, investors were aggressive net buyers, acquiring 22.6% of all homes sold and paying a remarkable 26.4% less than traditional homeowners.
Landlord Owned Current Holdings
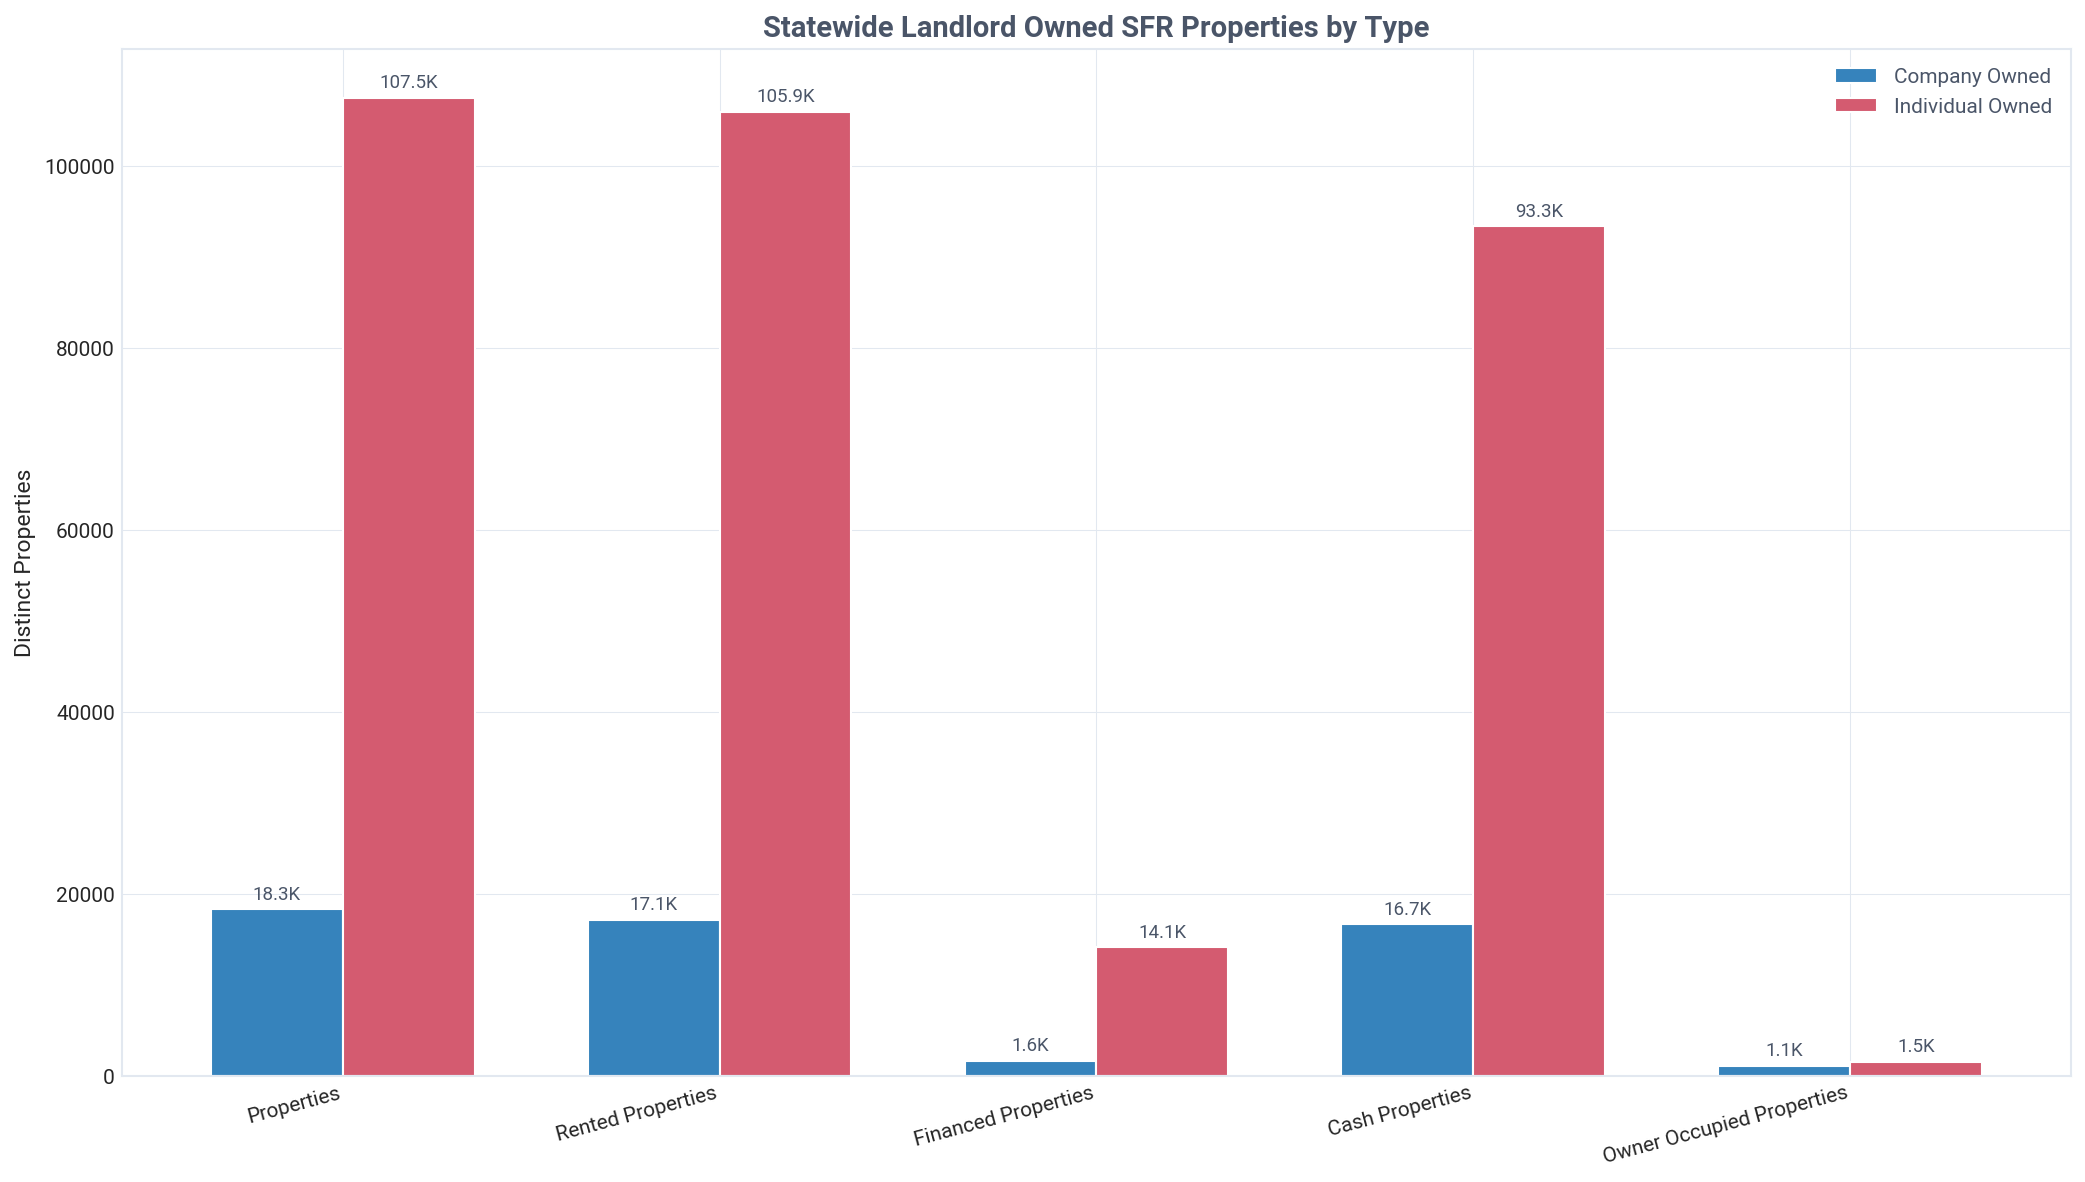
Investors hold 125,225 SFR properties in WV, with individual investors owning 85.8% of the portfolio.
The market is heavily cash-driven, with 109,577 properties owned outright versus only 15,648 financed. The vast majority of these holdings are rental-focused, with 122,555 properties classified as rented. Individual landlords (135,627) outnumber company landlords (10,279) by more than 13 to 1.
Landlord vs Traditional Homeowners
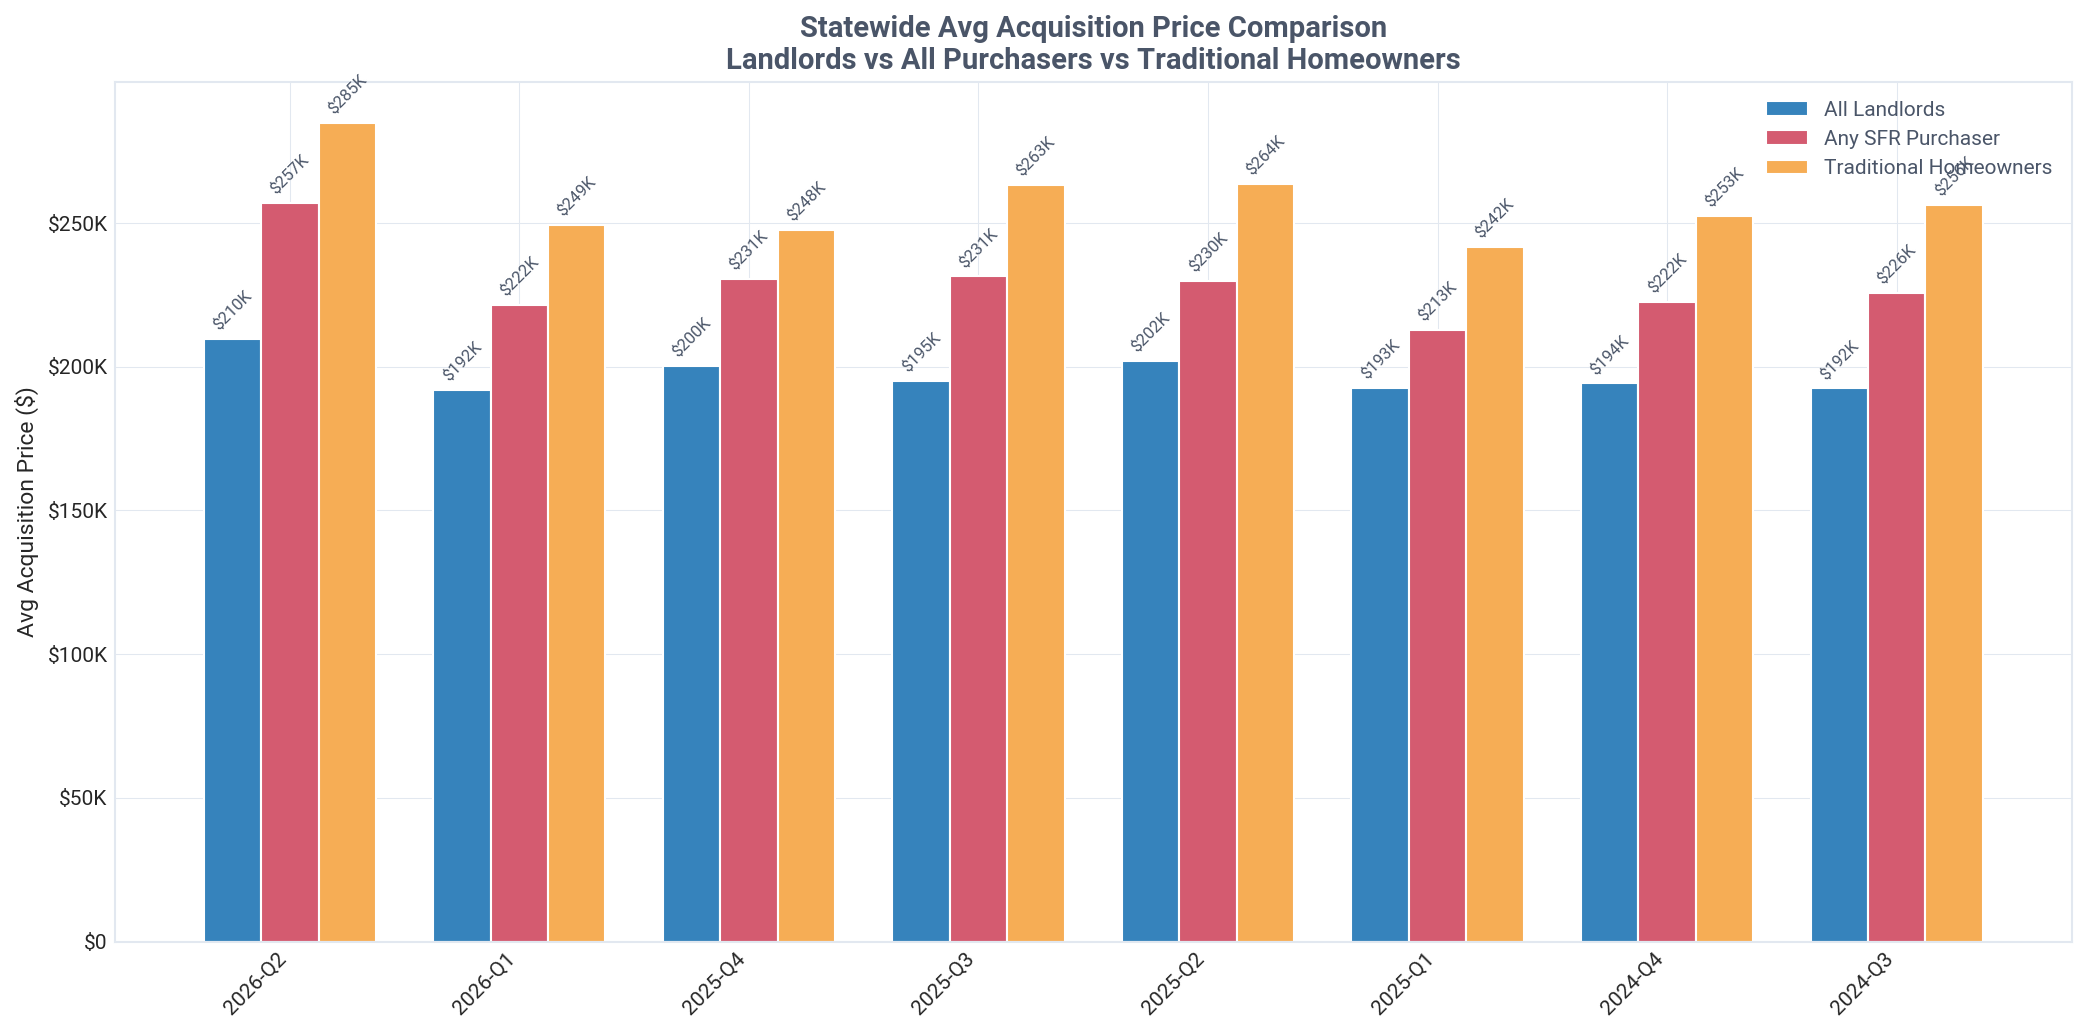
In Q2 2026, landlords paid 26.4% less than homeowners, an average discount of $75,131 per property.
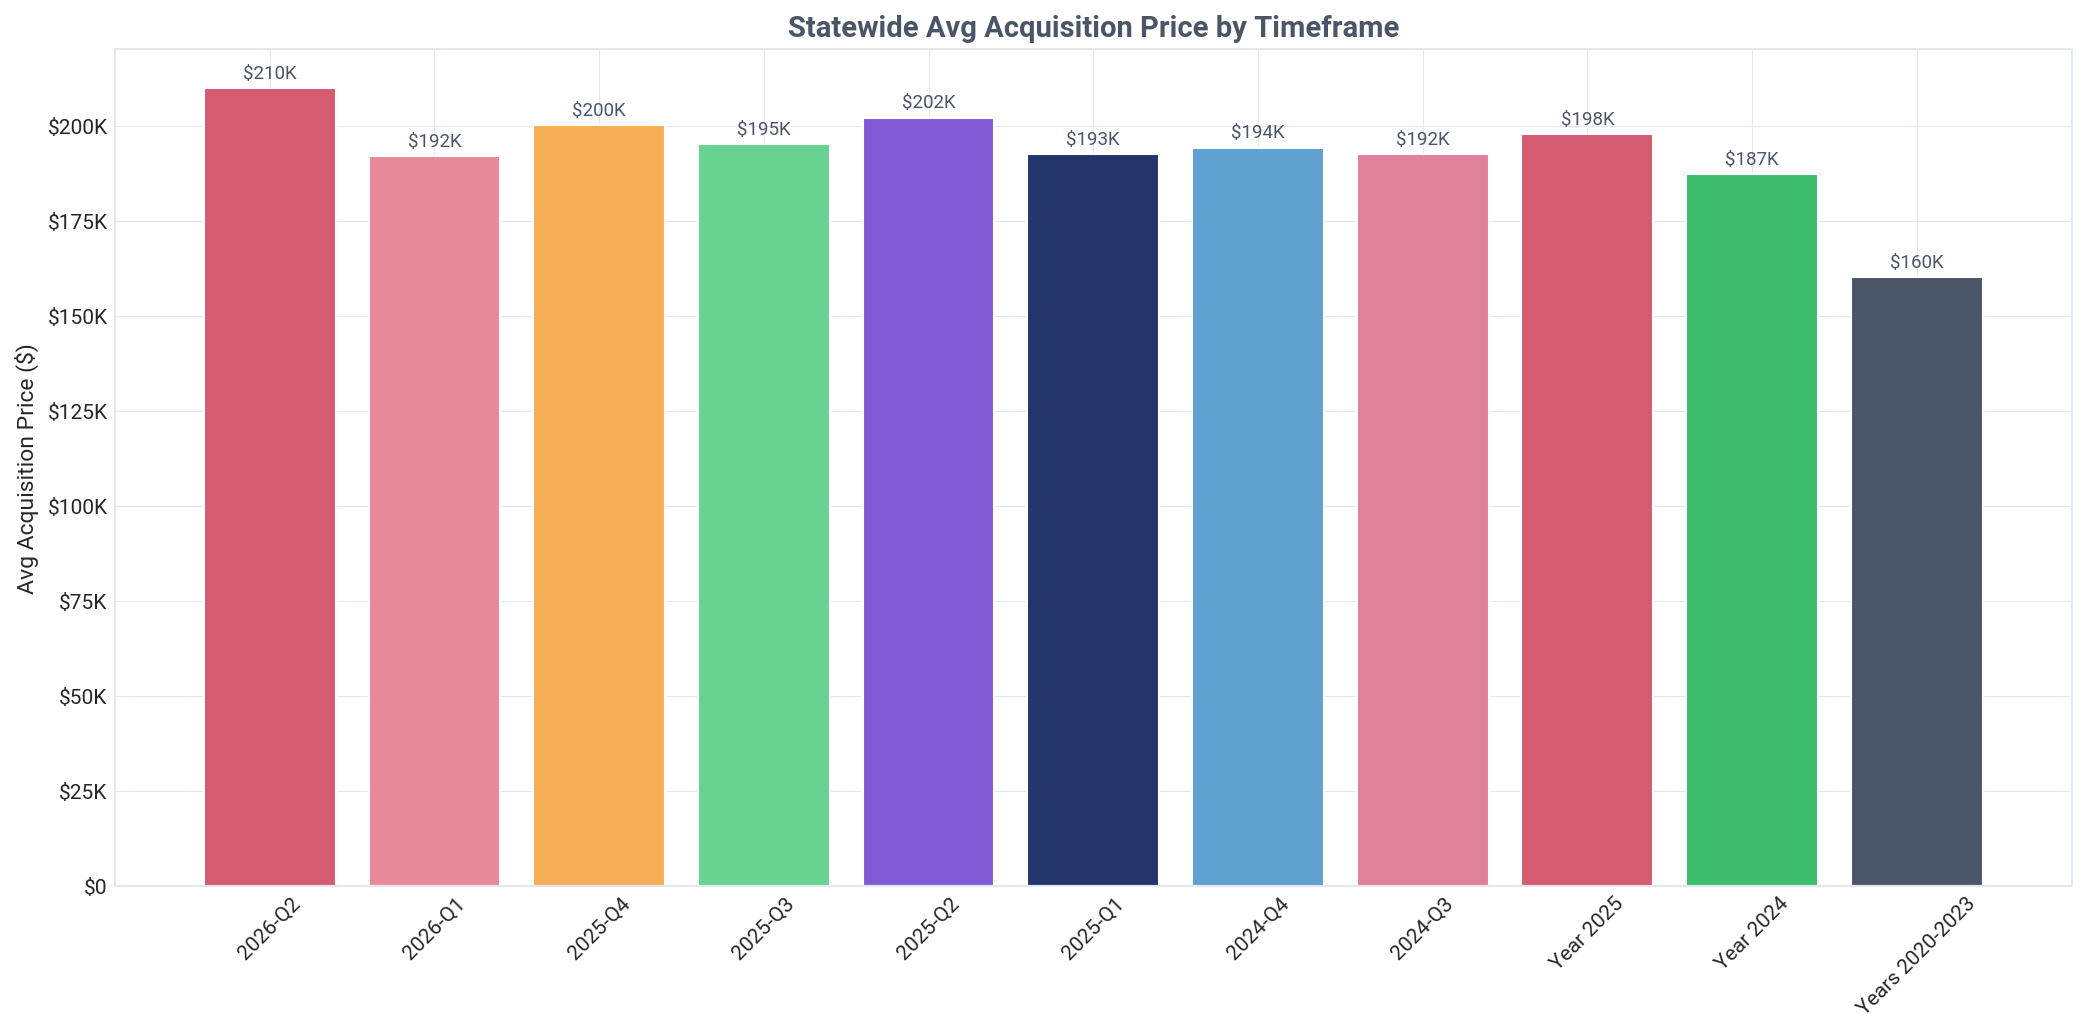
This price gap has been widening, increasing from 19.2% in Q4 2025 and 23.0% in Q1 2026. Since the 2020-2023 period, the average landlord acquisition price has risen 31.0%, from $160,213 to $209,820.
Current Quarter Purchases
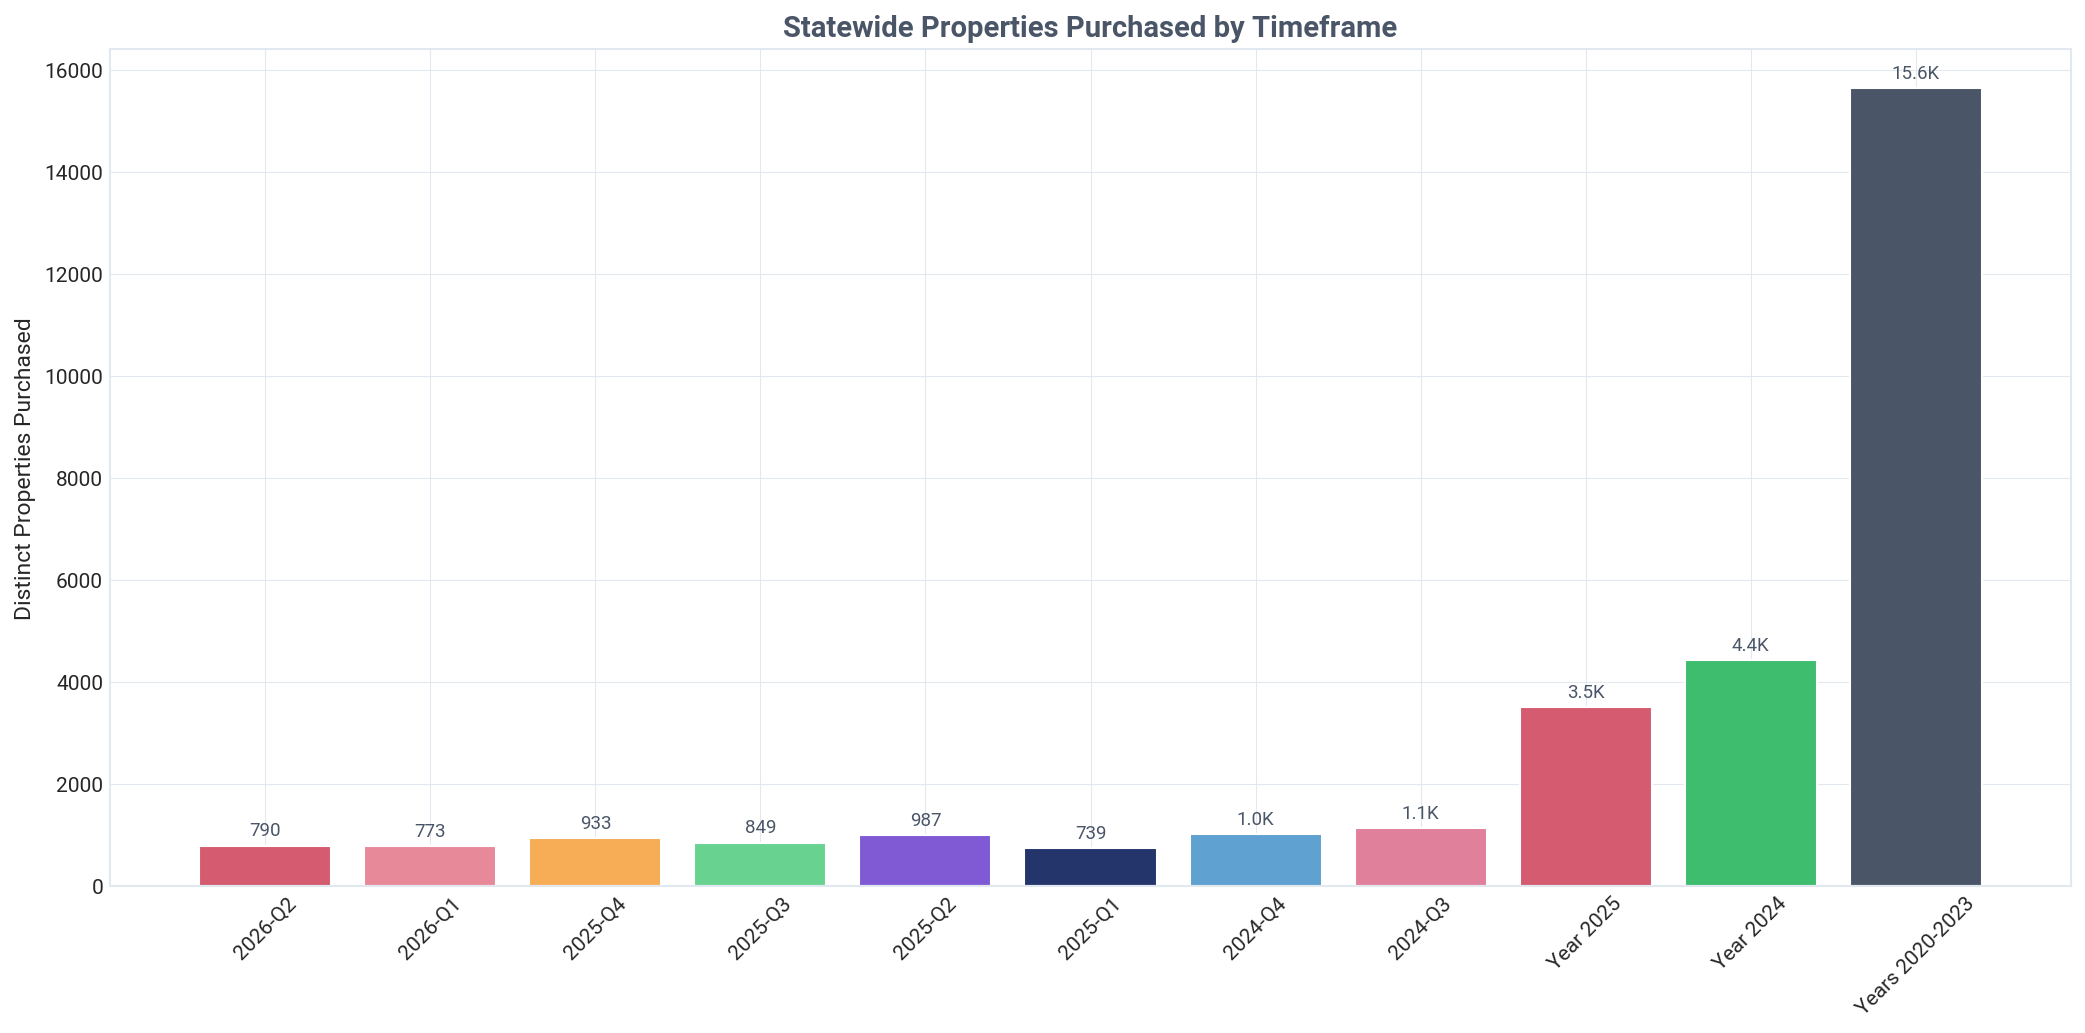
Landlords purchased 790 properties in Q2 2026, capturing 22.6% of all SFR sales in West Virginia.
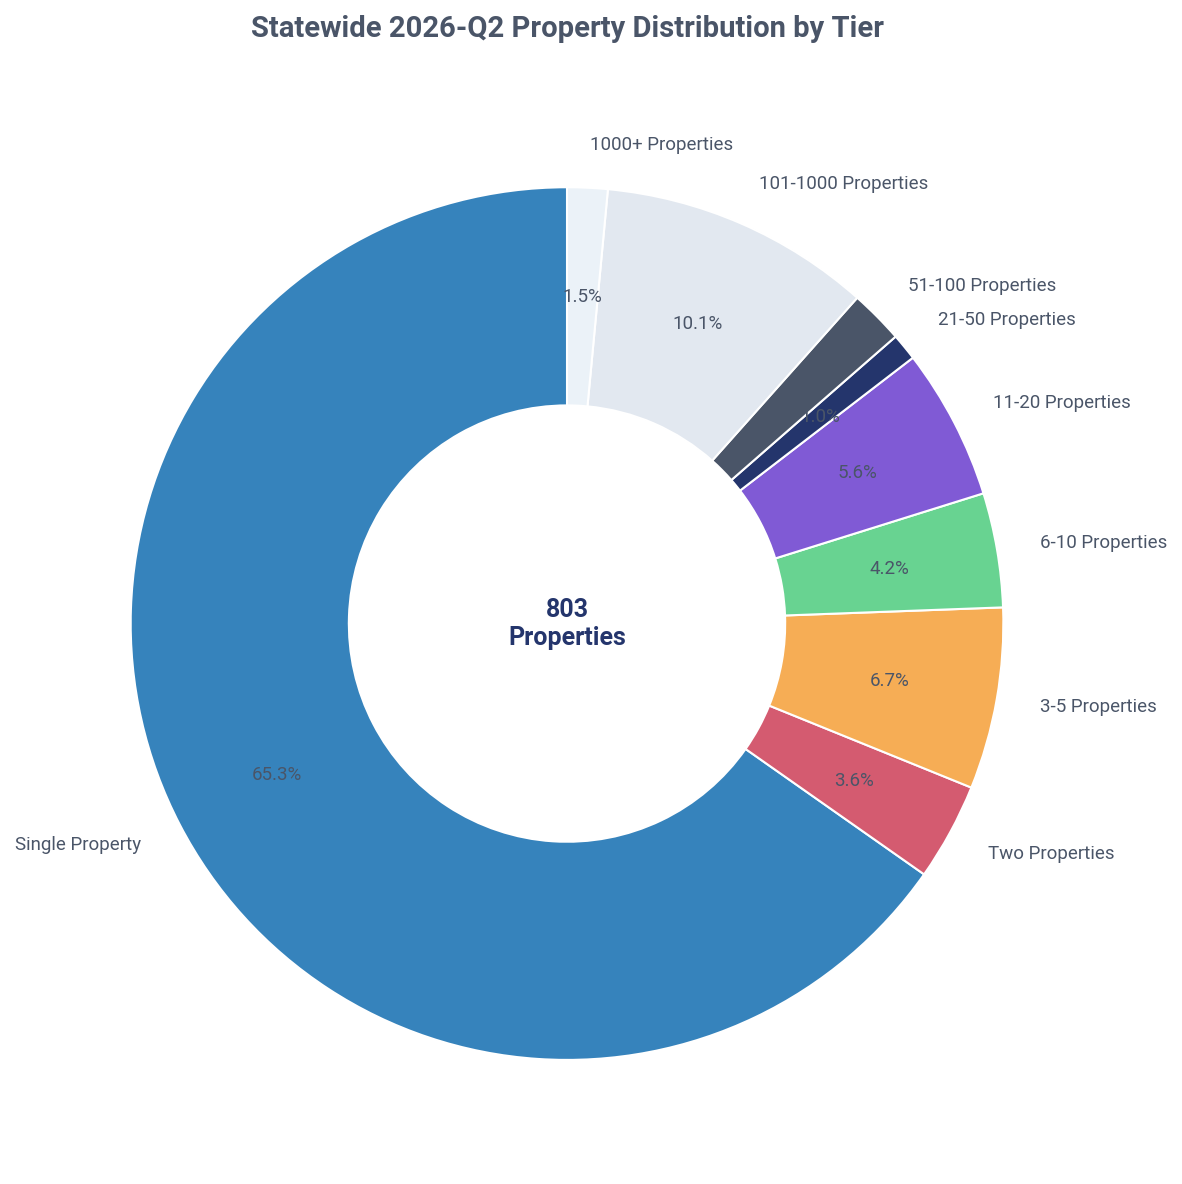
Mom-and-pop landlords (1-10 properties) drove this activity, accounting for 79.8% of all investor purchases. In contrast, institutional investors (1000+ properties) made up only 1.5% of acquisitions. The quarter also saw 698 new single-property landlords enter the market.
Ownership by Tier
Mom-and-pop landlords (1-10 properties) overwhelmingly control 95.2% of West Virginia's investor-owned SFR housing.
This leaves a mere 0.1% of the investor-owned portfolio for institutional investors (1000+ properties). Single-property landlords are the largest group by far, holding 98,956 properties, which is 77.0% of the entire investor-owned market.
Ownership by Tier & Type
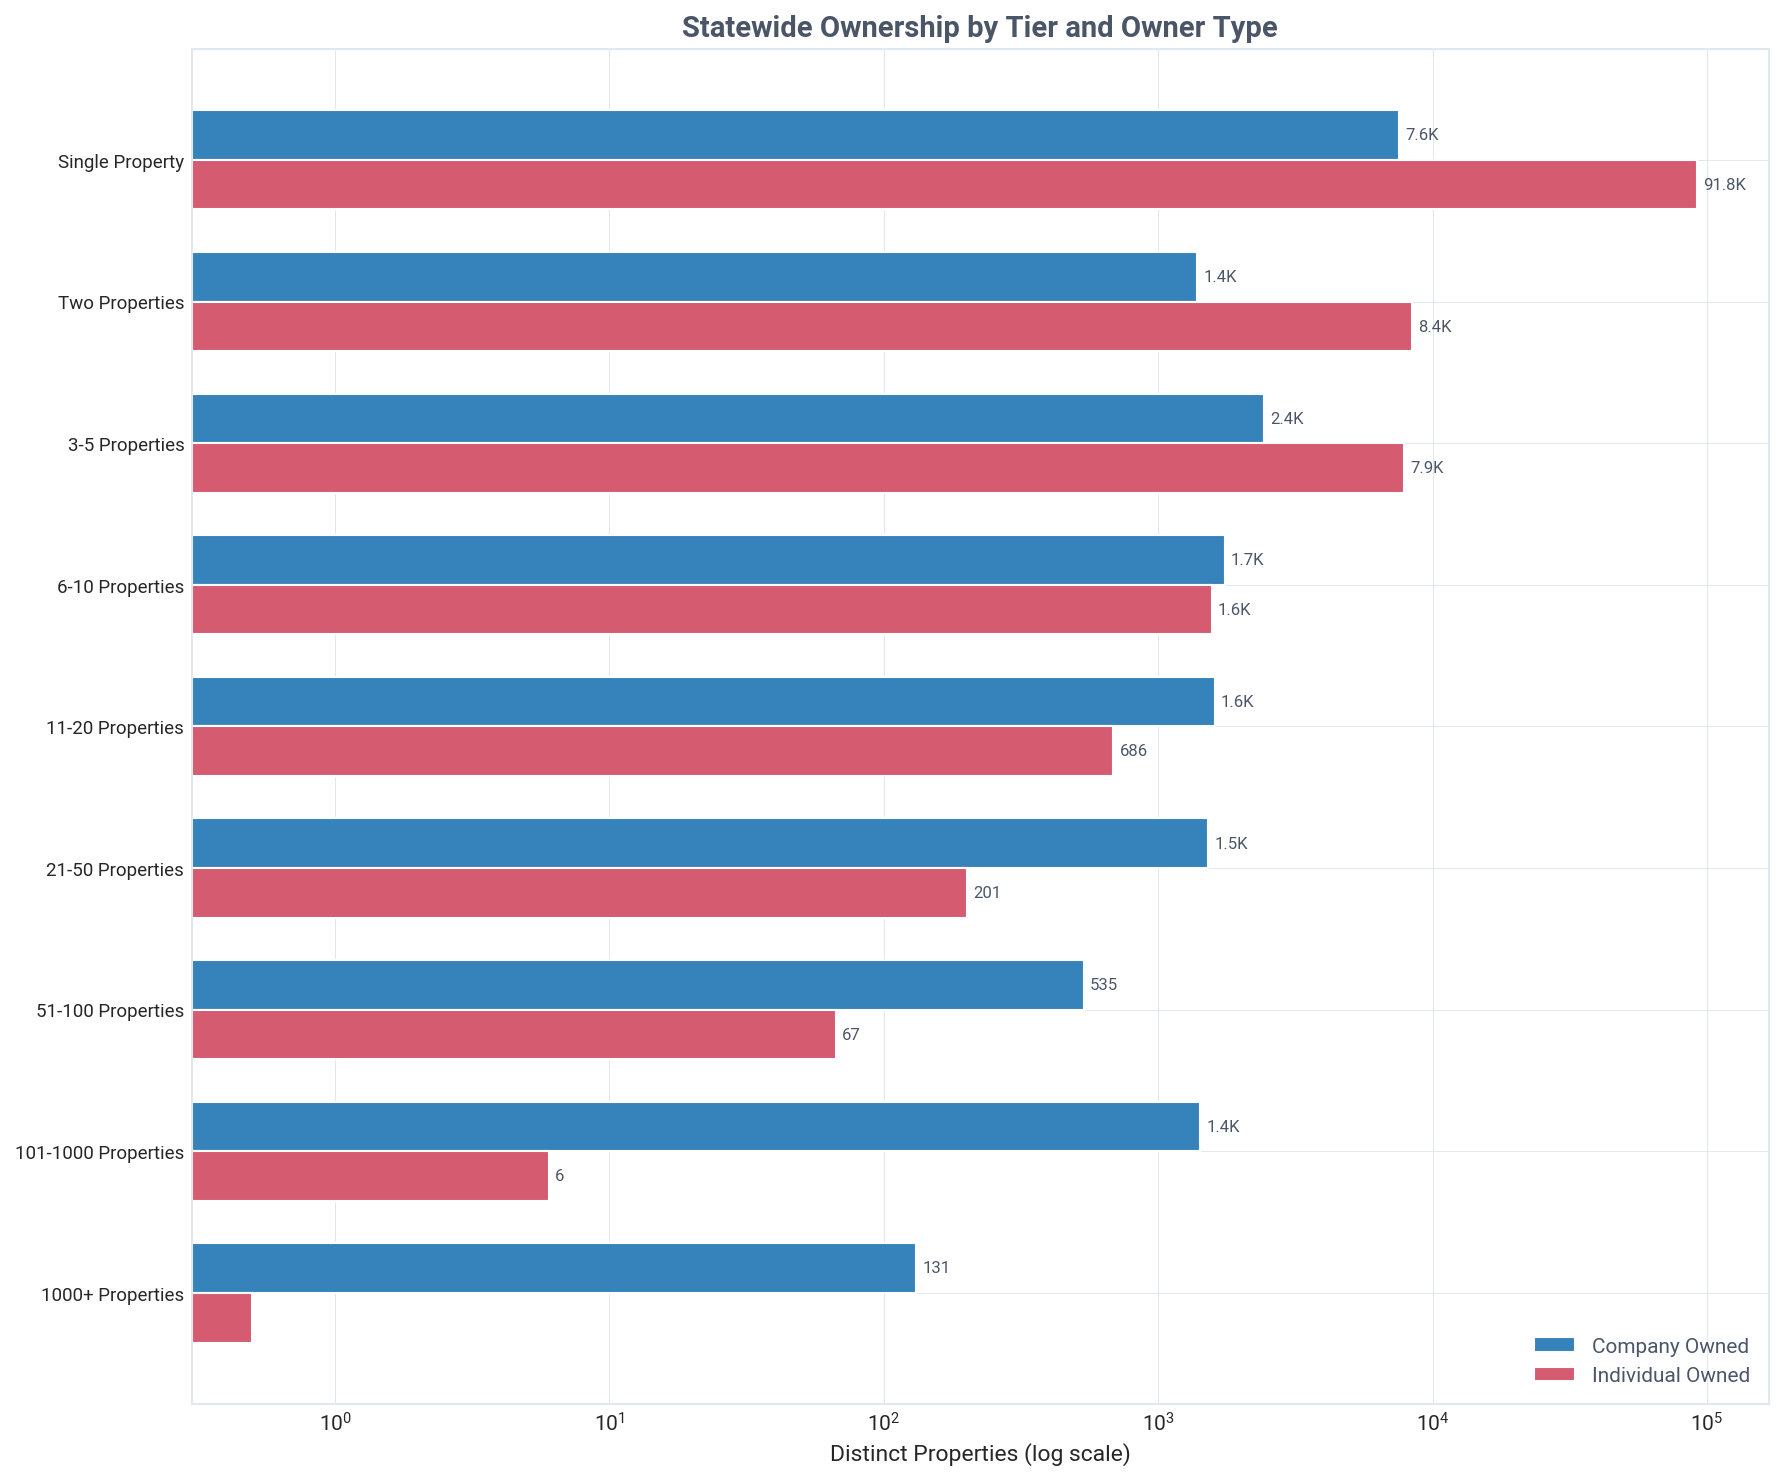
Companies become the majority owners at the 6-10 property tier, holding 52.7% of properties in that segment.
Below this level, individuals dominate, owning 92.4% of single-property portfolios and 85.9% of two-property portfolios. In the largest tiers (101-1000 properties), companies control nearly all assets (99.6%).
Geographic Distribution
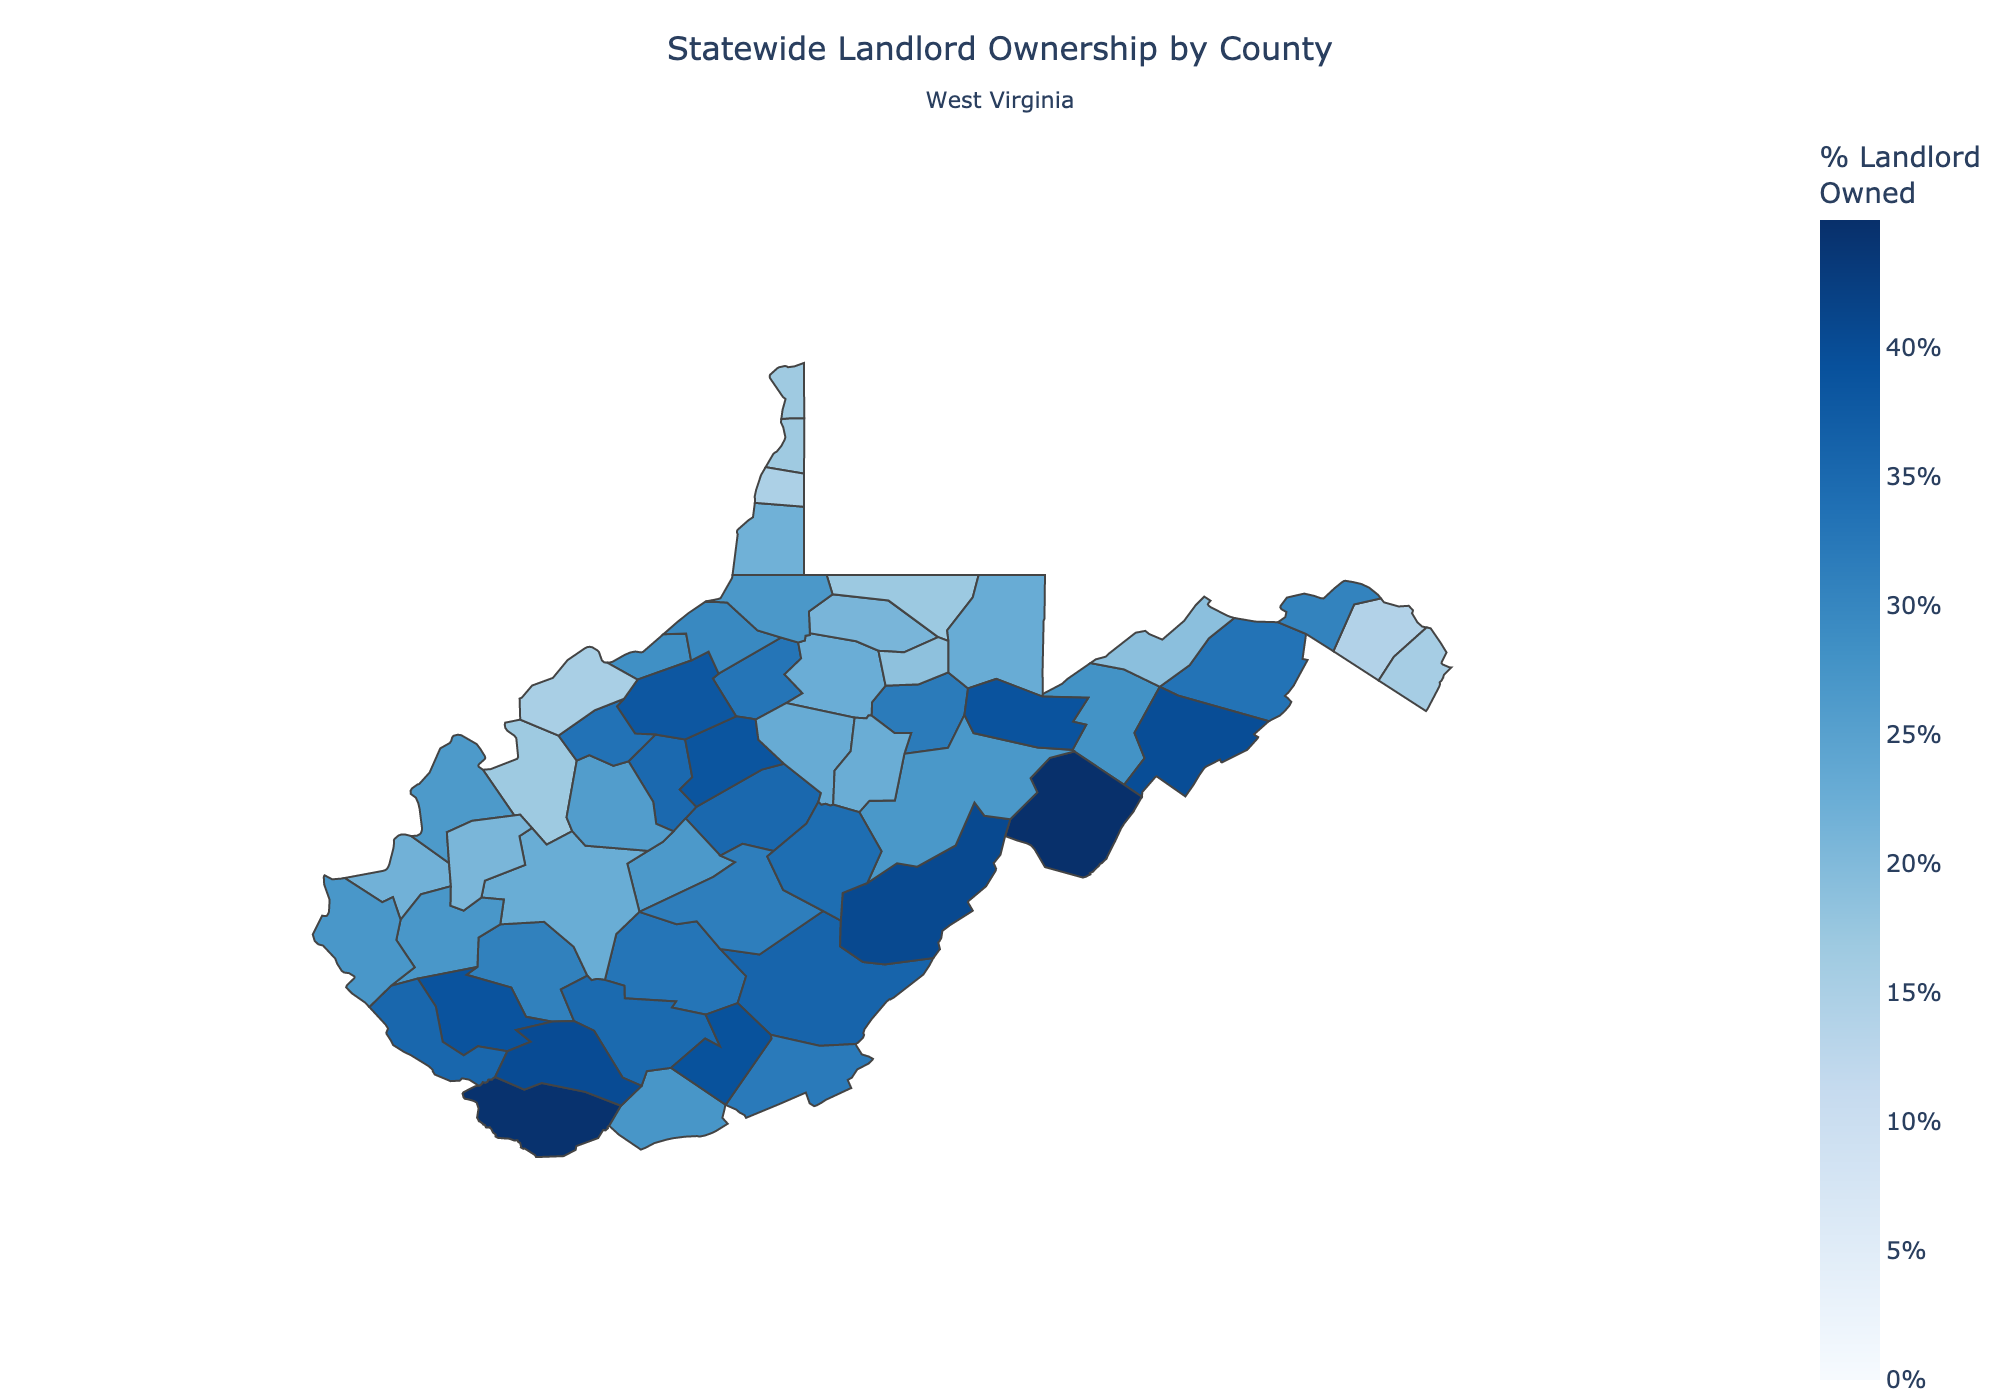
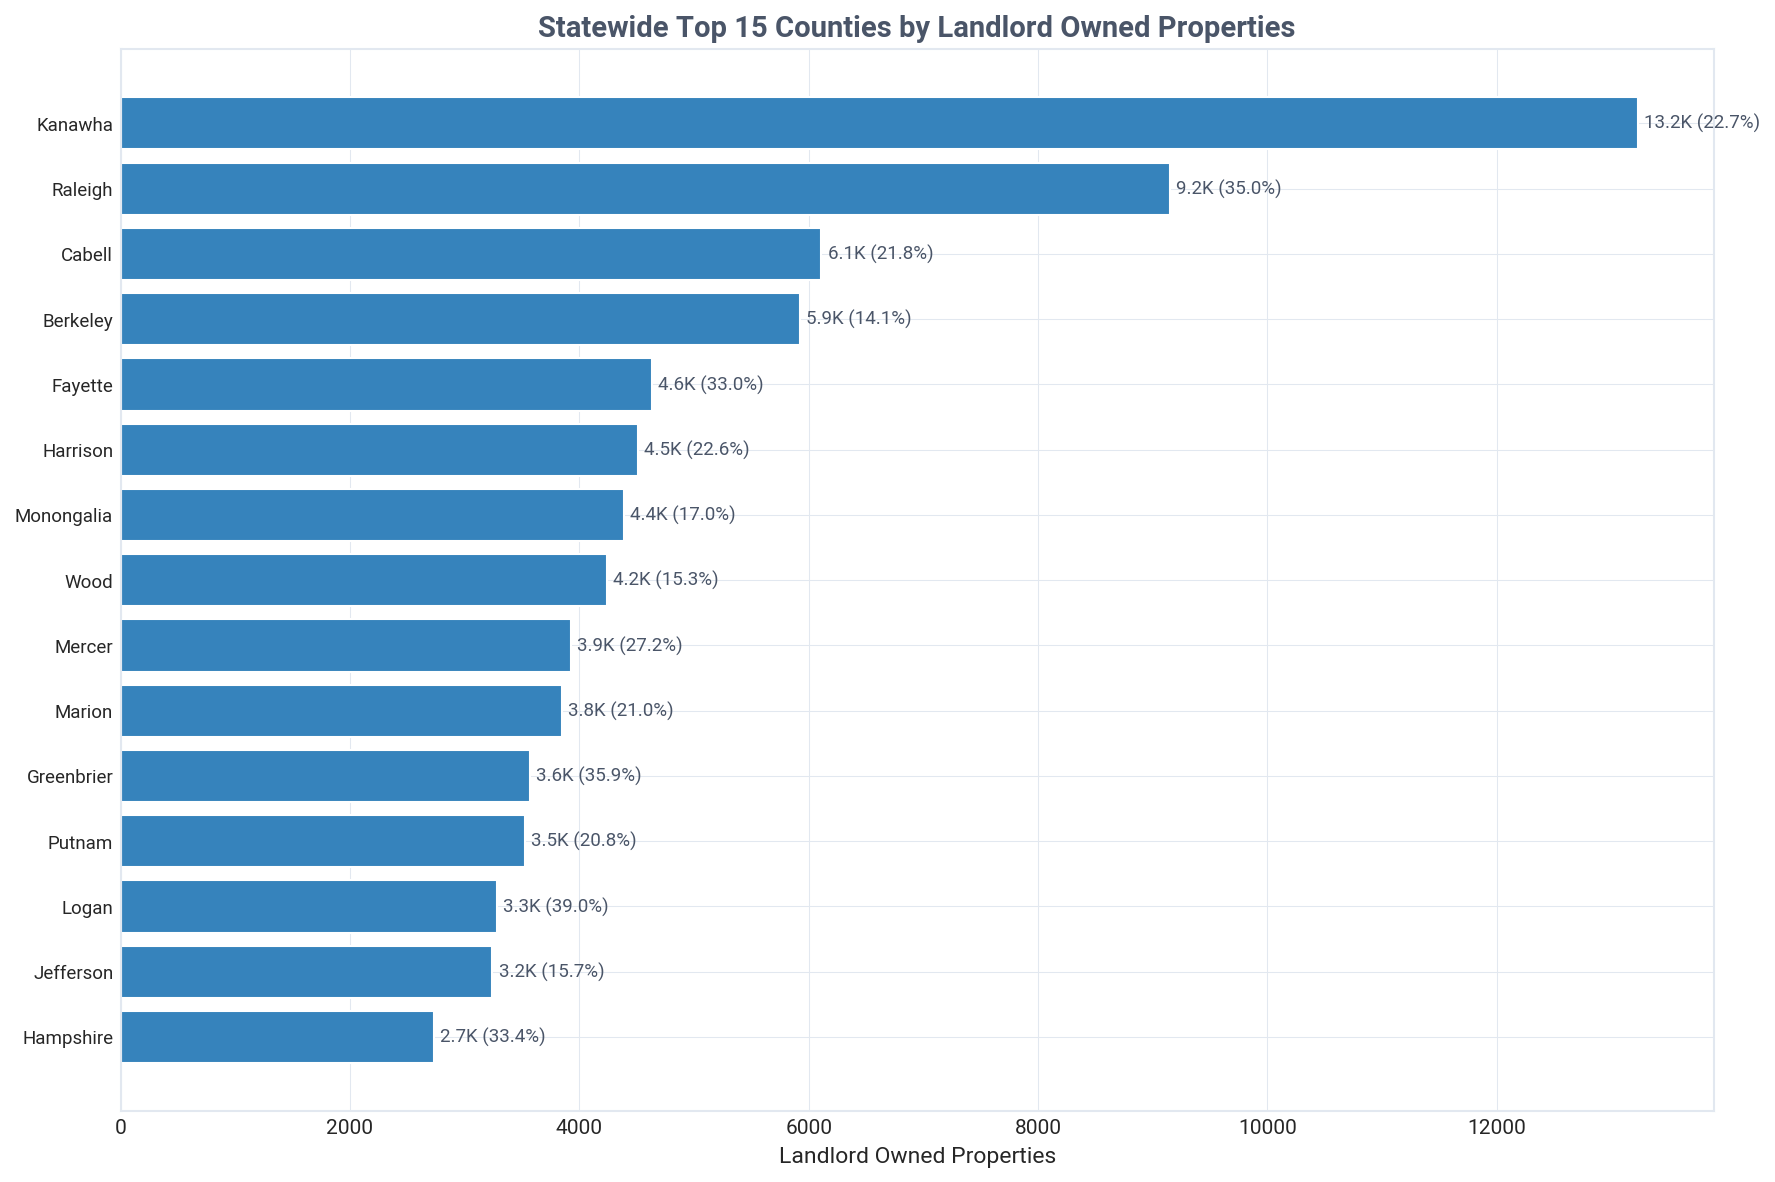
Kanawha County leads West Virginia with 13,231 investor-owned properties, the highest count in the state.
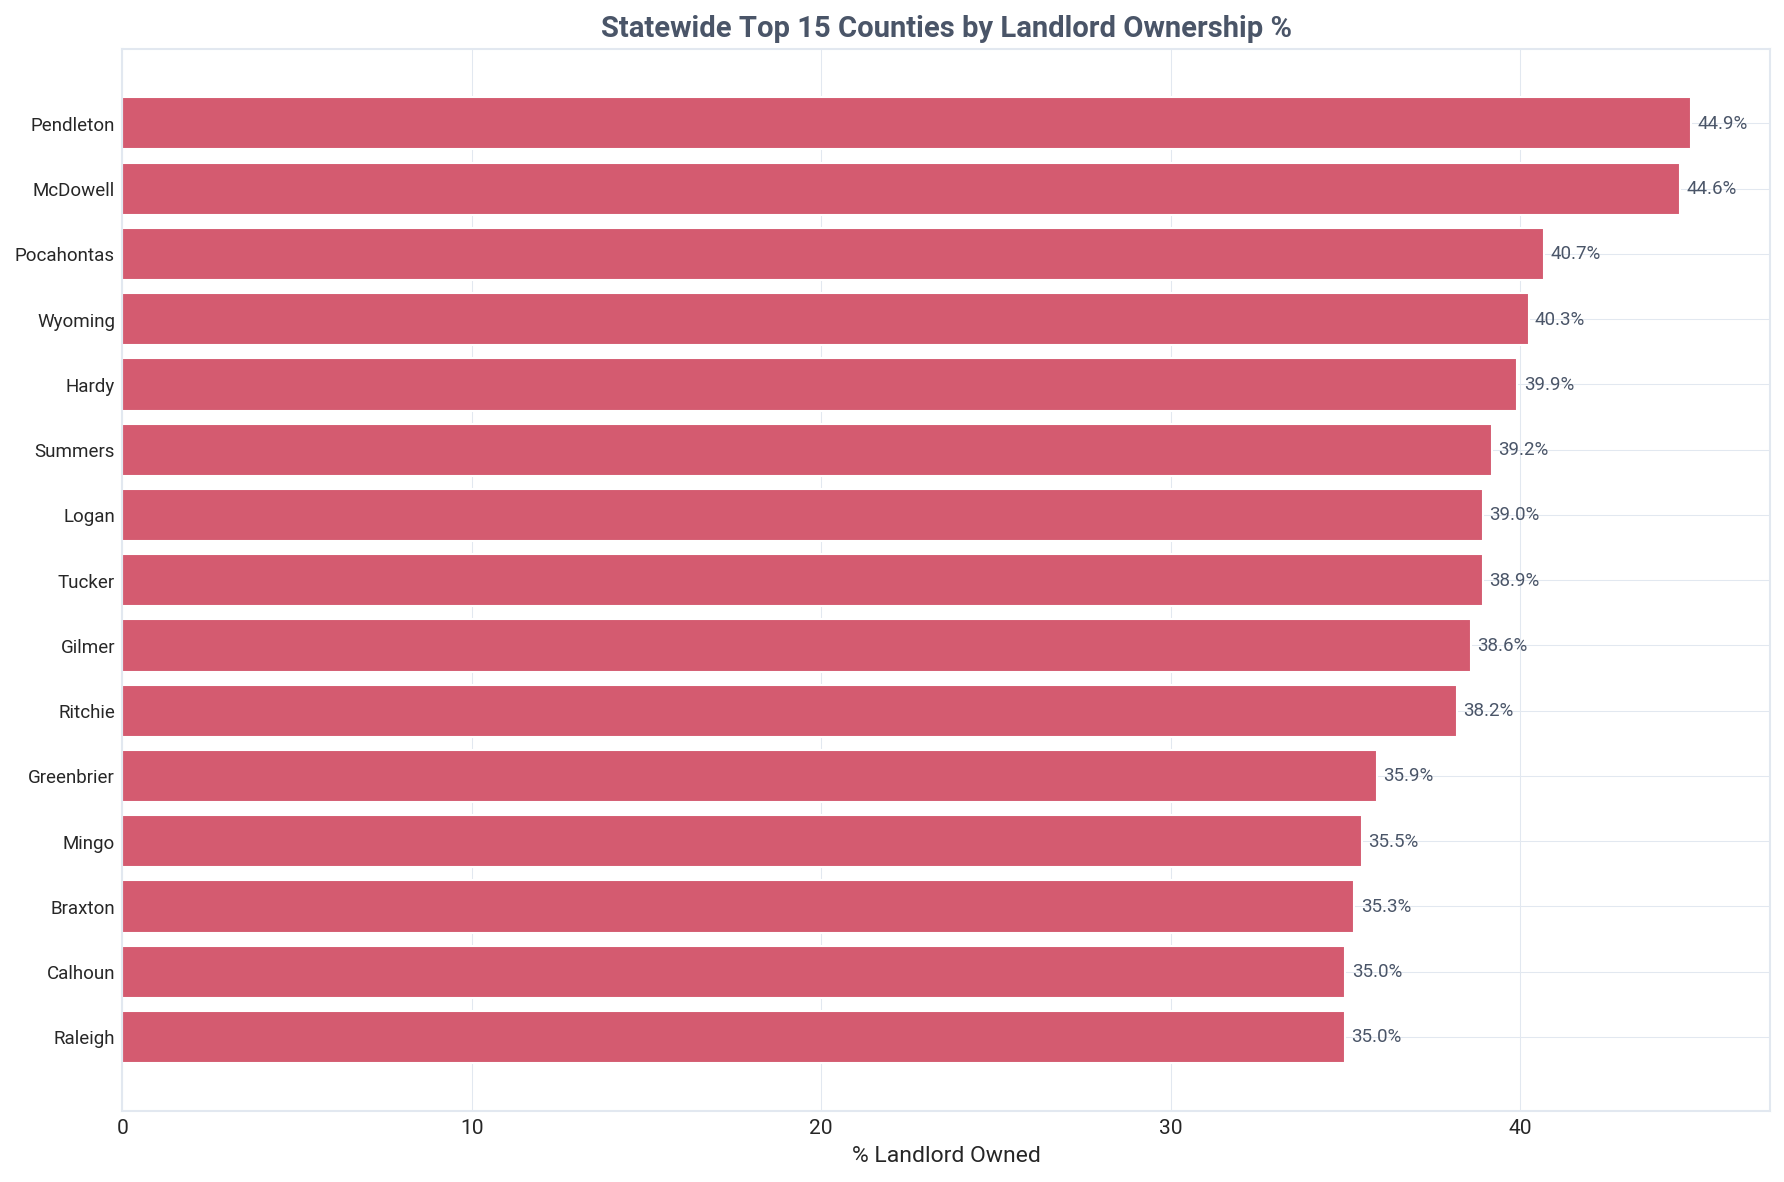
However, smaller counties exhibit the highest ownership rates, with Pendleton County at 44.9% and McDowell County at 44.6%. The top 5 counties by property count are Kanawha, Raleigh, Cabell, Berkeley, and Fayette.
Historical Transactions
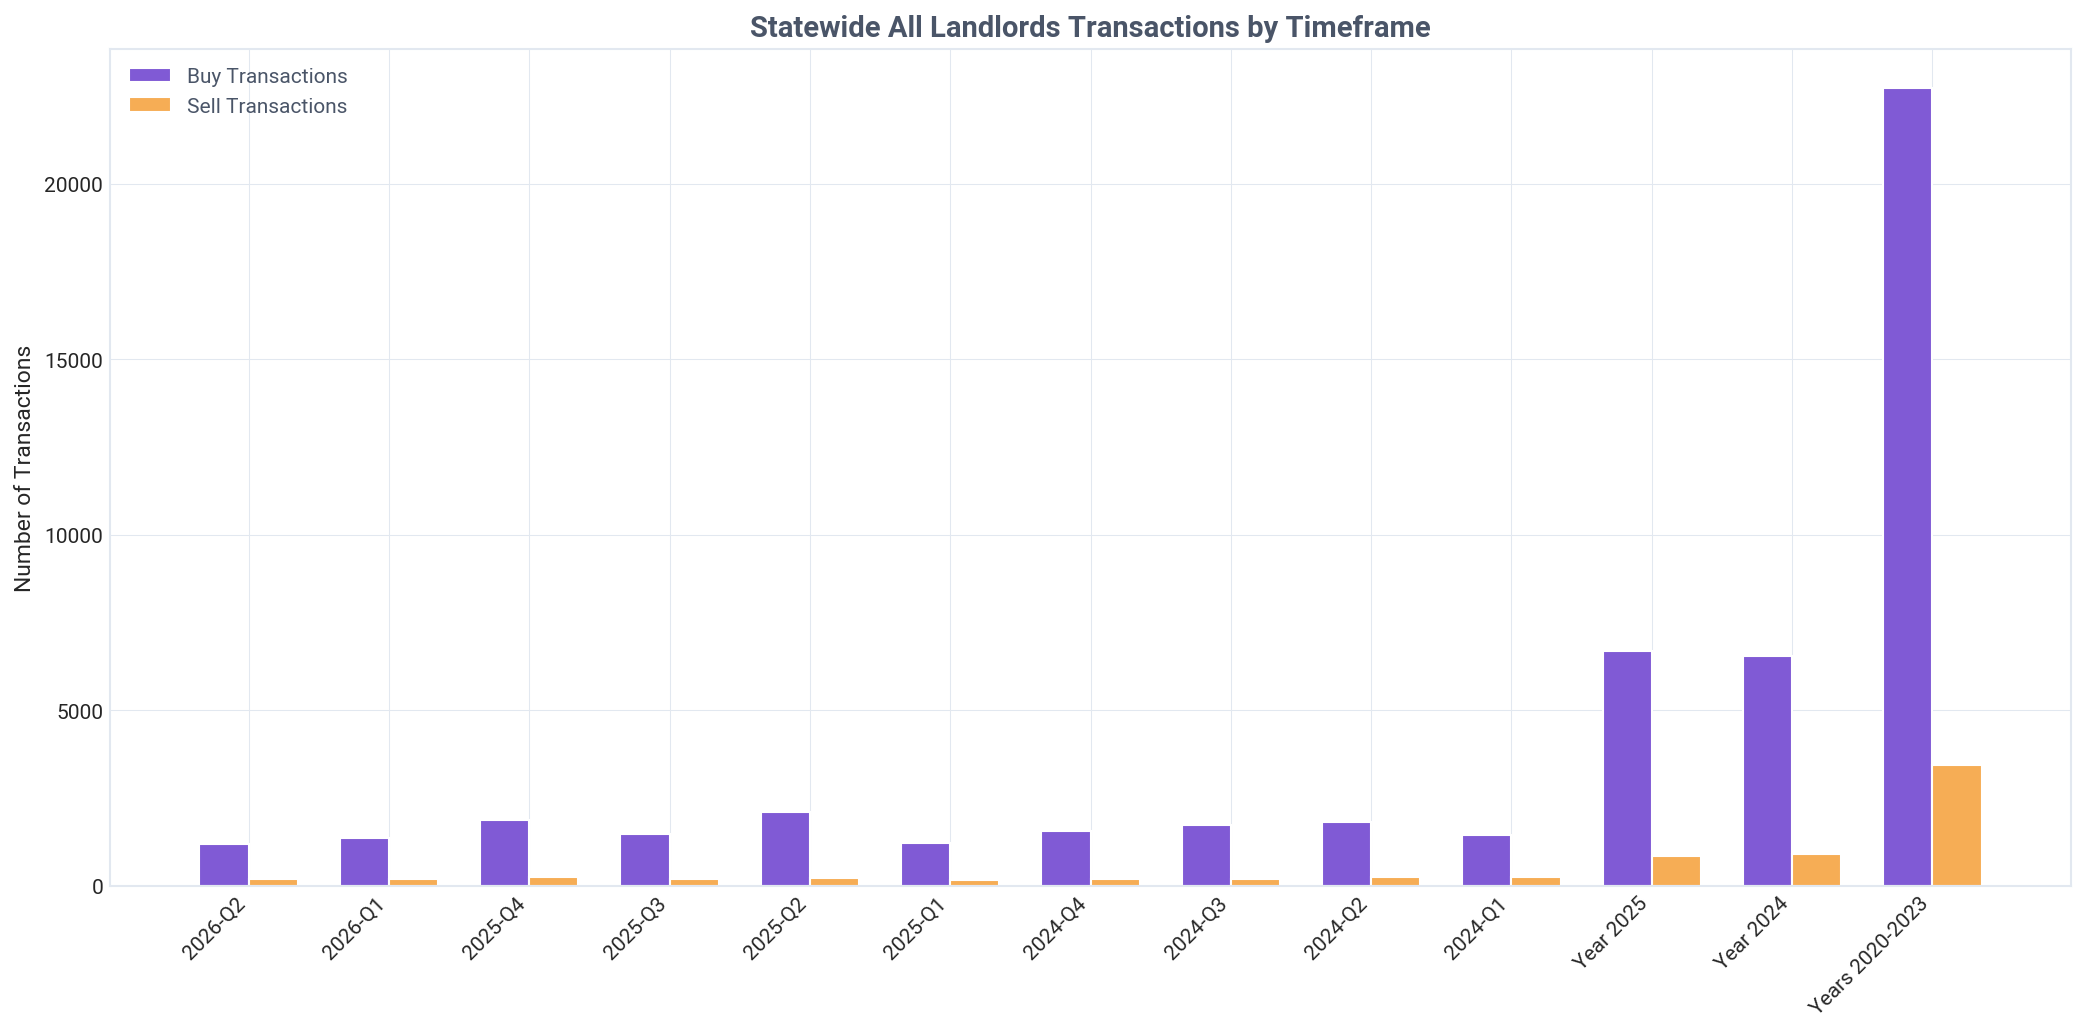
West Virginia landlords are aggressive net buyers, acquiring 6.6 properties for every one they sold in Q2 2026.
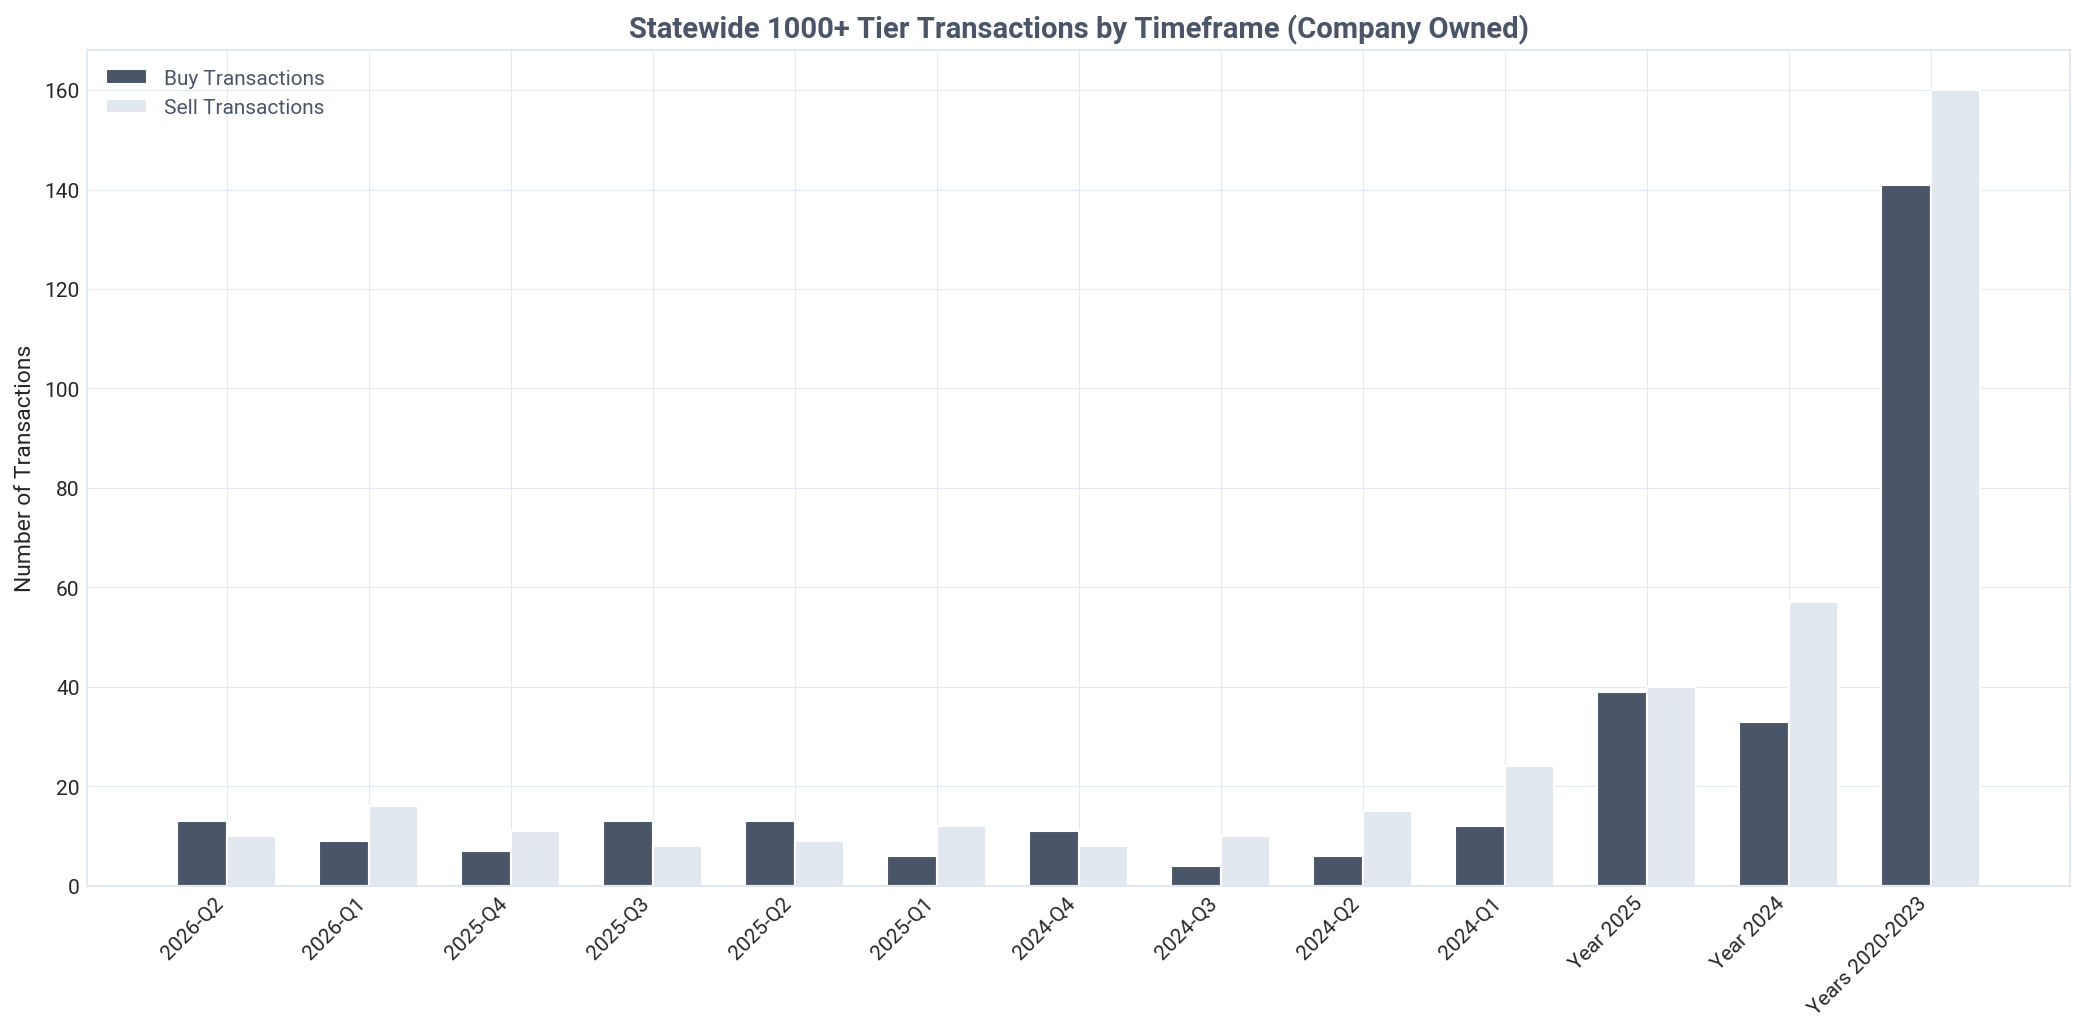
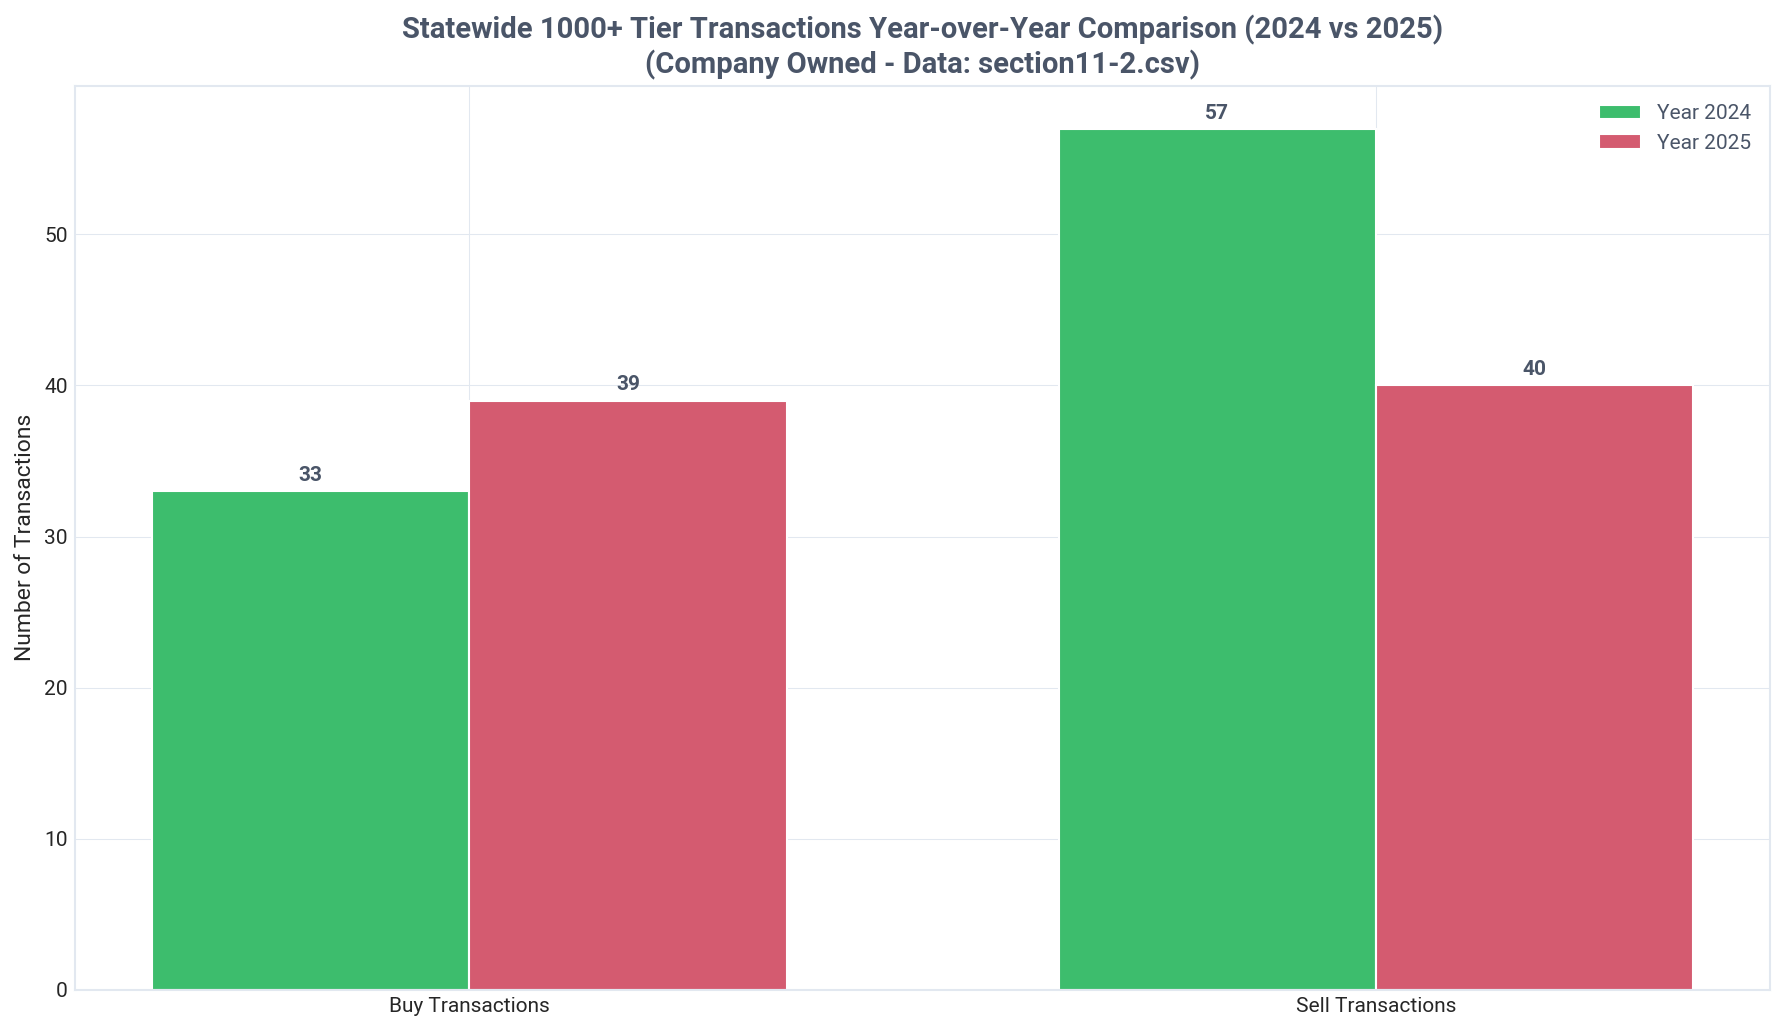
This trend is consistent, with landlords remaining strong net buyers throughout 2024 and 2025. Institutional investors have shifted strategy, becoming slight net buyers in Q2 2026 (13 buys vs 10 sells) after being net sellers in both 2024 and 2025.
Current Quarter Transactions
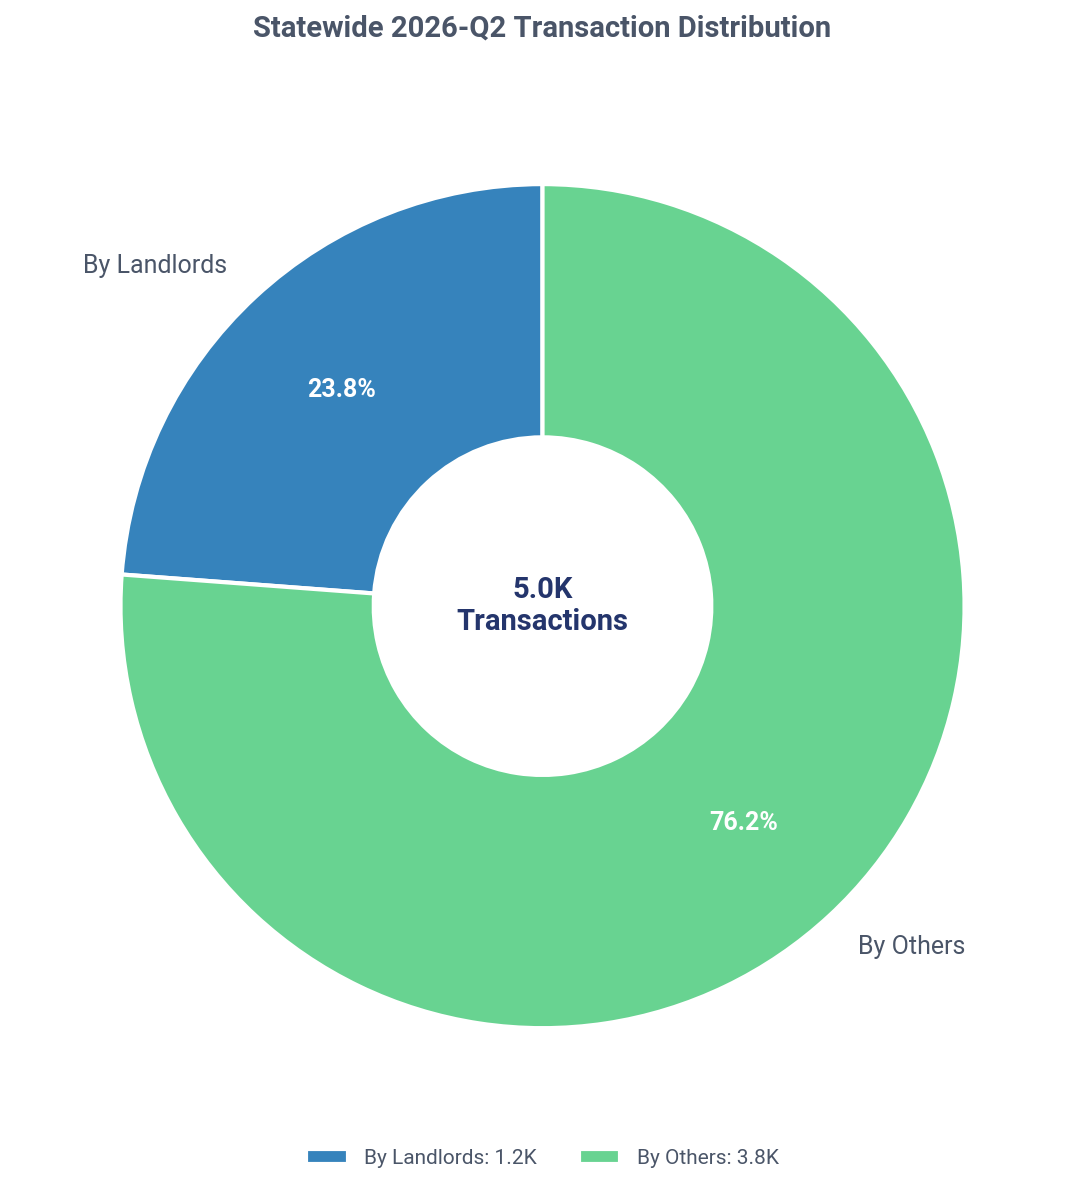
Landlord activity accounted for 23.8% of all 5,003 SFR transactions in West Virginia during Q2 2026.
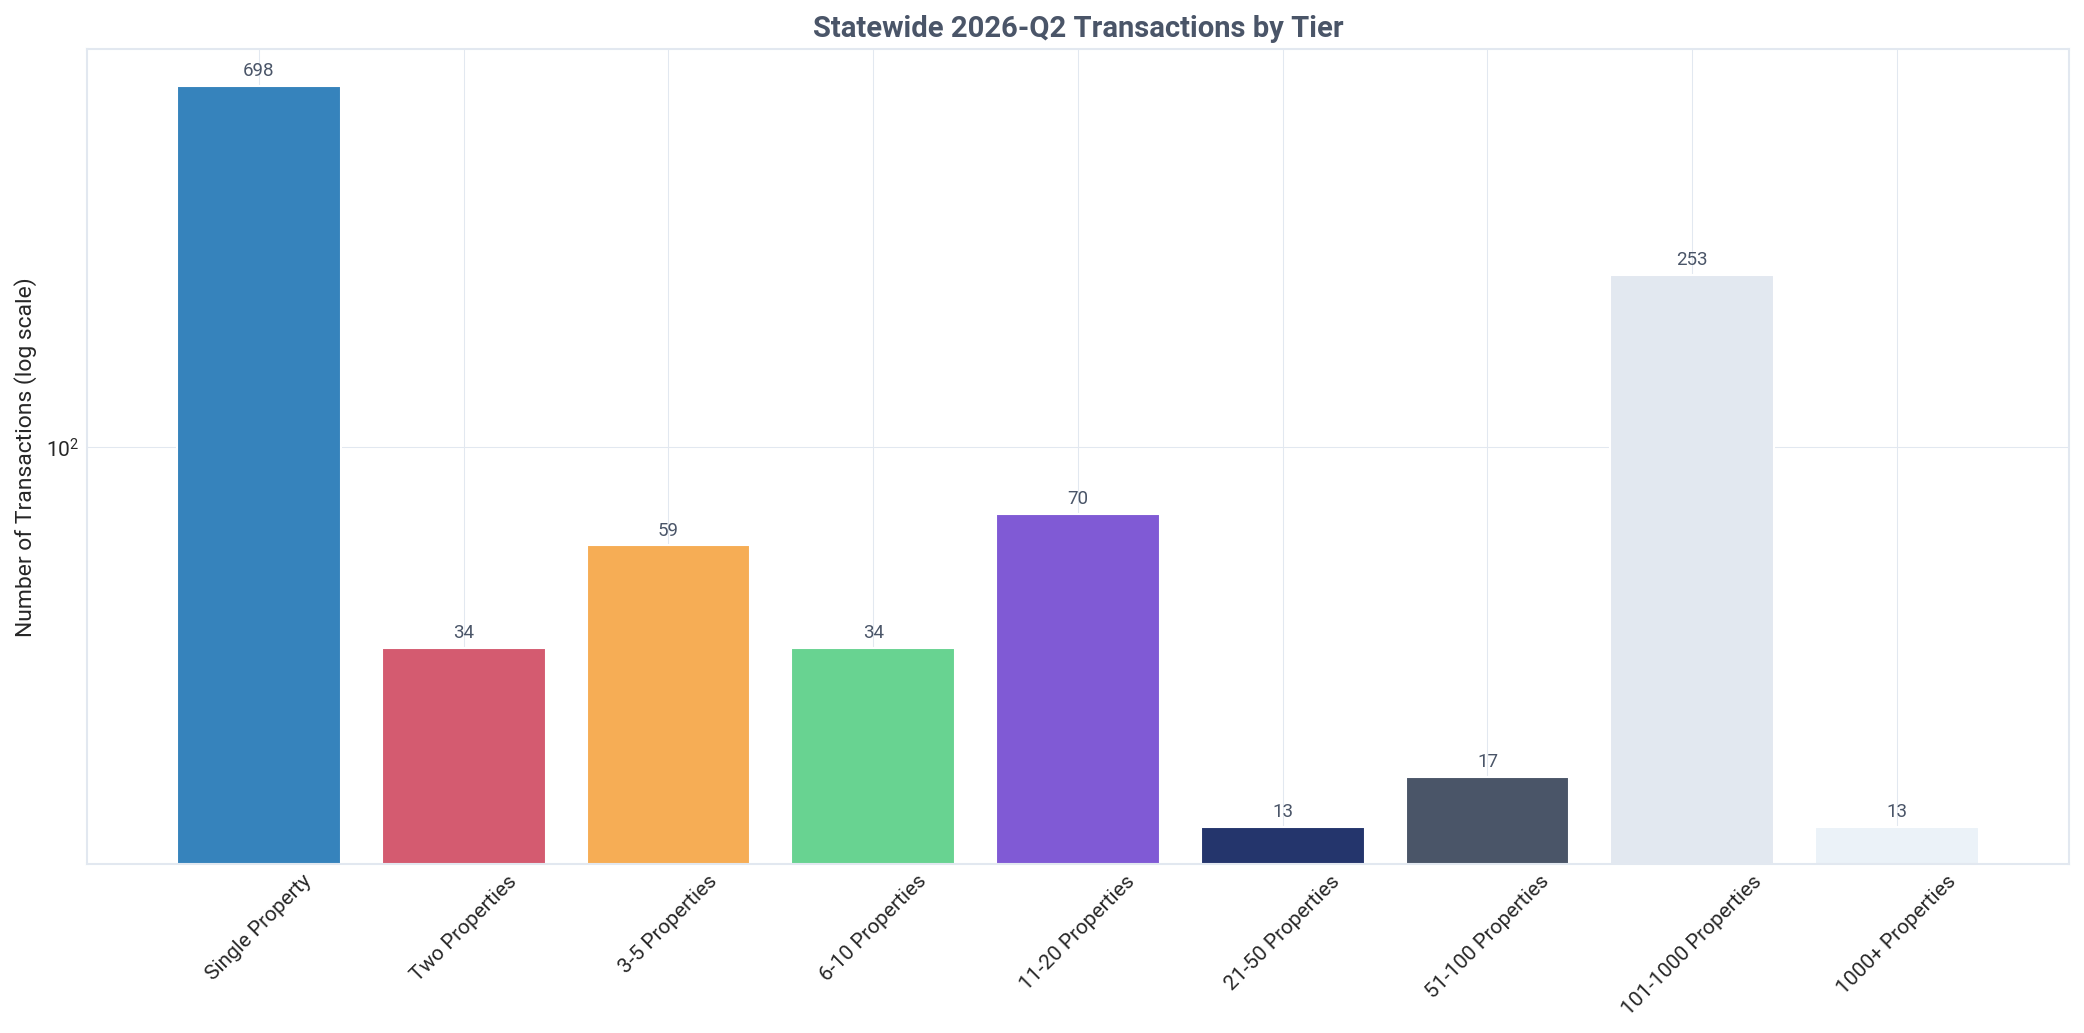
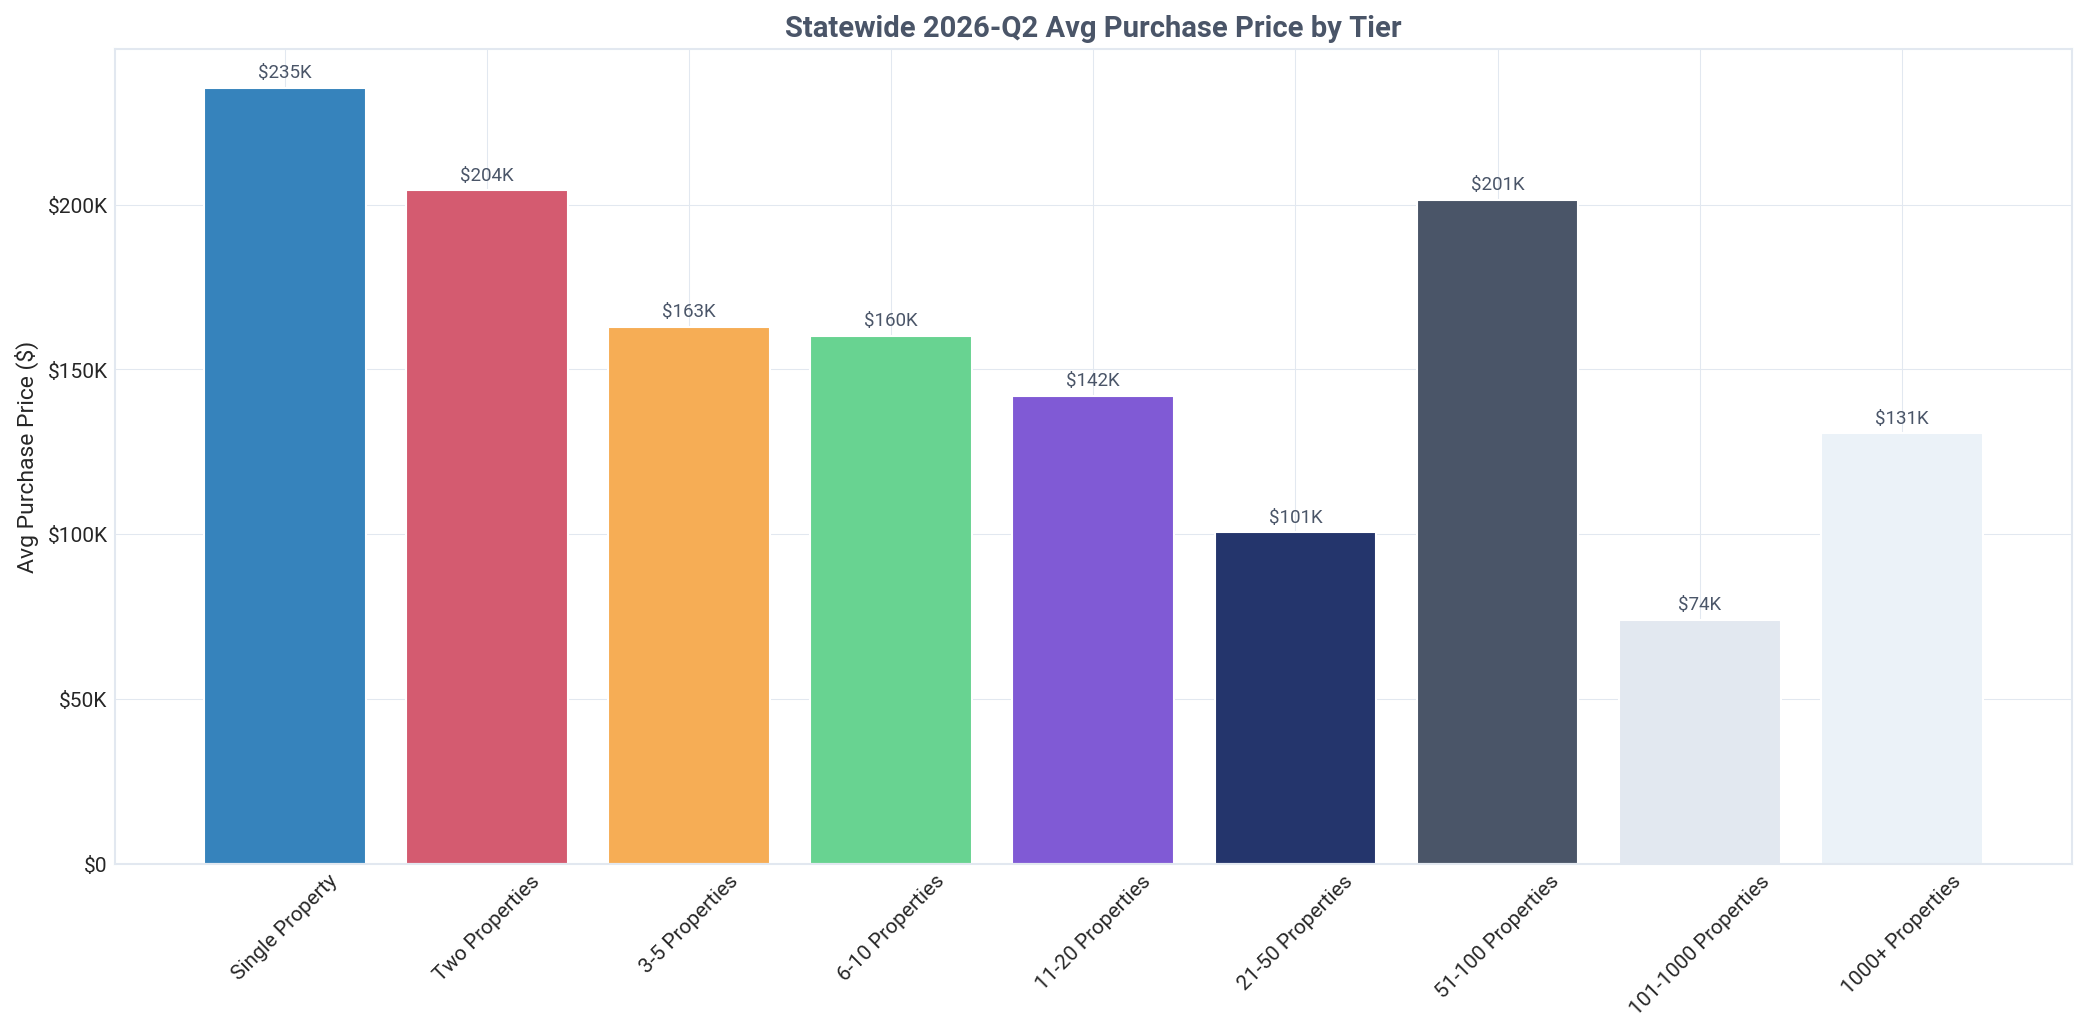
New, single-property landlords paid the highest average price at $235,492, while institutional buyers paid 44.5% less at $130,596. Institutions also sourced 46.2% of their purchases from other landlords, compared to just 7.0% for new buyers.

Want deeper insights tailored to your investment strategy?

TALK TO AN EXPERT

Current Holdings Portfolio

Analysis of landlord property holdings by type, financing method, and owner category

West Virginia: landlord SFR holdings by type, Q2 2026
Key Insight
Investors hold 125,225 SFR properties in WV, with individual investors owning 85.8% of the portfolio.
Detailed Findings

In West Virginia, the investor-owned single-family residential market comprises 125,225 properties, making up 23.8% of the state's total SFR housing stock. This portfolio is firmly in the hands of small-scale operators, with individual investors owning 107,472 properties, a commanding 85.8% share, compared to just 14.6% (18,296 properties) held by companies.

The financial structure of these holdings reveals a low-leverage environment. A massive 87.5% of investor-owned properties (109,577) are owned with cash, while only 12.5% (15,648) are financed. This suggests a mature investor base with significant equity, less susceptible to interest rate fluctuations.

The entity-level data further underscores the dominance of individual investors. There are 135,627 individual landlords compared to just 10,279 company landlords. This 13-to-1 ratio of individuals to companies shows that the market's backbone is comprised of local, small-scale real estate investing, not large corporate entities.

The portfolio's primary purpose is clear, with 122,555 properties identified as rented. This high rental penetration confirms that the overwhelming majority of these assets are active rental units contributing to the state's housing supply.

This composition challenges the common narrative of corporate landlords dominating the rental space. In West Virginia, the typical landlord is an individual, likely local, who owns their properties outright and operates on a small scale. Understanding this requires deep assessor data to differentiate ownership patterns accurately.
Acquisition Timing & Pricing

Comparison of acquisition prices between landlords and traditional homeowners

Key Insight
In Q2 2026, landlords paid 26.4% less than homeowners, an average discount of $75,131 per property.
Detailed Findings

A significant pricing advantage defines investor activity in West Virginia. In Q2 2026, landlords acquired properties for an average of $209,820, a full $75,131 less than the $284,951 paid by traditional homeowners. This 26.4% discount highlights investors' ability to identify and secure undervalued assets.

The trend shows this investor advantage is growing. The discount has widened consistently over the past year, moving from 19.2% in Q4 2025 to 23.0% in Q1 2026, and now reaching its current 26.4% peak. This suggests investors are becoming more effective at deal-finding relative to the general market.

Despite securing larger discounts, investors are still participating in a rising market. The average landlord acquisition price in Q2 2026 ($209,820) represents a 31.0% increase from the 2020-2023 average of $160,213, signaling significant market appreciation over the past few years.

Quarter-over-quarter acquisition prices show continued upward momentum. The average price rose 9.3% from $191,938 in Q1 2026 to $209,820 in Q2 2026, a faster pace than in previous quarters. This acceleration, combined with a widening discount, points to a market where skilled investors are capitalizing on price inefficiencies.

This pricing behavior is a key theme in our Investor Pulse reports, where finding value below market rate is a primary investor strategy. The data for West Virginia provides a clear example of this principle in action, possibly using tools like an automated valuation (AVM) to spot opportunities.

West Virginia: properties purchased by timeframe, Q2 2026
West Virginia: average acquisition price by timeframe, Q2 2026
West Virginia: average acquisition price by buyer type, Q2 2026
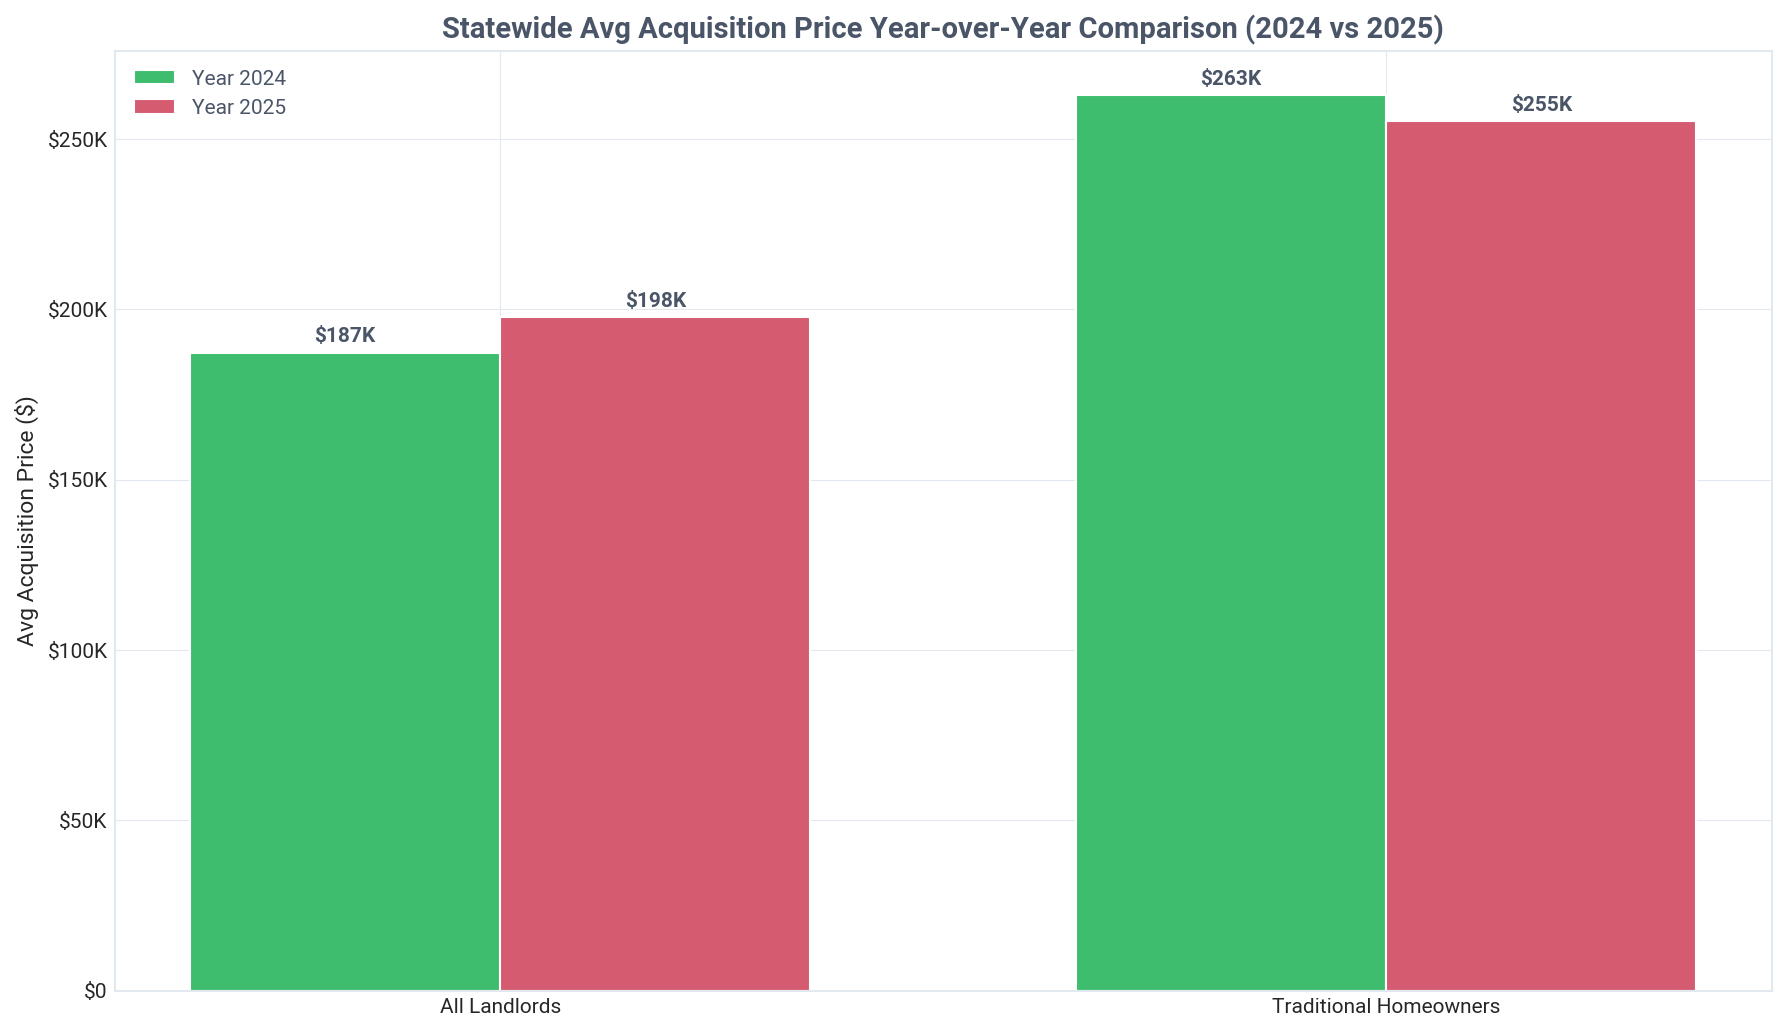
West Virginia: average acquisition price year over year, Q2 2026

Current Quarter Purchase Summary

Analysis of Q2 2026 purchase activity by investor tier and type

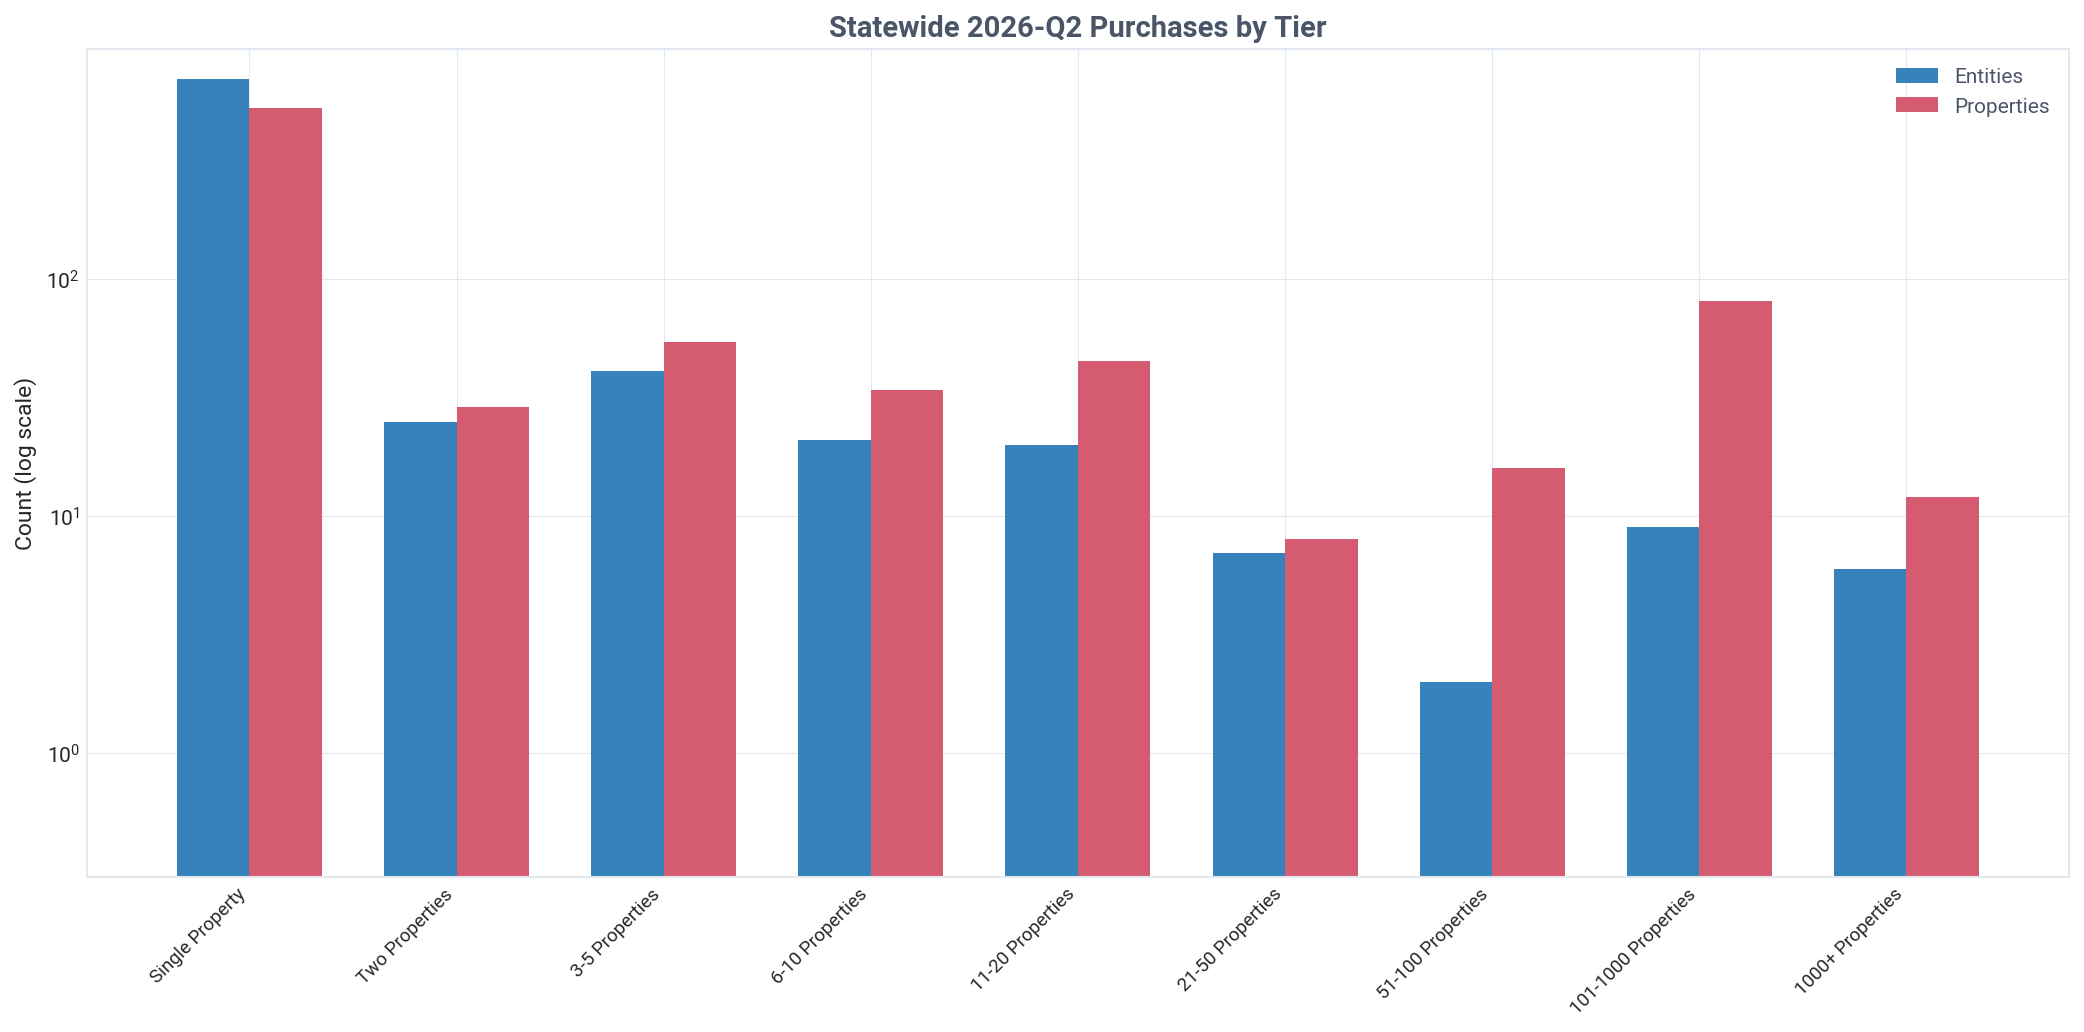
West Virginia: purchases by tier, Q2 2026
West Virginia: purchased property share by tier, Q2 2026
Key Insight
Landlords purchased 790 properties in Q2 2026, capturing 22.6% of all SFR sales in West Virginia.
Detailed Findings

Investor purchasing activity remained robust in Q2 2026, with landlords acquiring 790 single-family residential properties. This represents a significant 22.6% share of the 3,498 total homes sold across West Virginia during the quarter.

The market's growth is overwhelmingly fueled by small-scale investors. Mom-and-pop landlords (owning 1-10 properties) were responsible for 641 of these purchases, or 79.8% of all investor activity. This highlights a grassroots market structure rather than one driven by large firms.

In stark contrast, institutional investors with portfolios of over 1,000 properties played a minimal role, purchasing only 12 homes. Their 1.5% share of investor acquisitions underscores their near-zero impact on the West Virginia market this quarter.

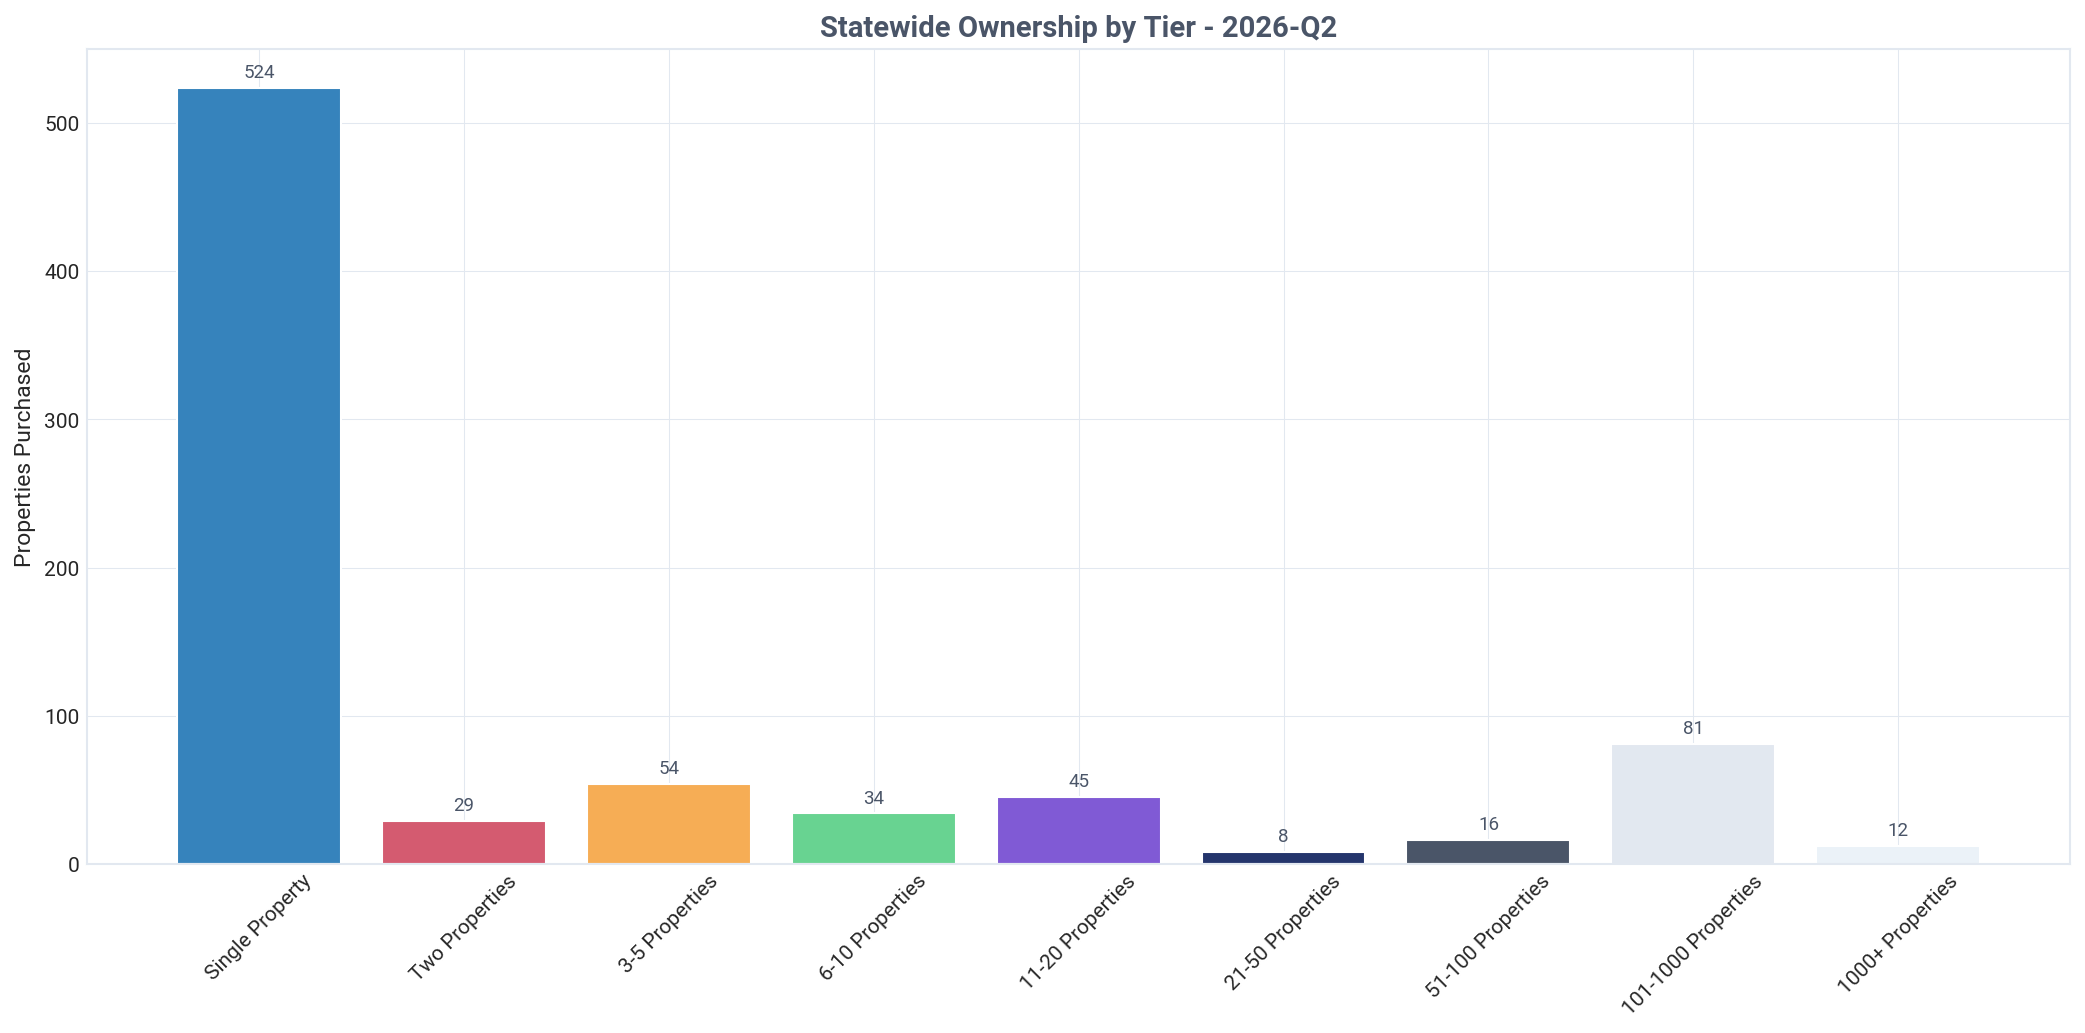
A key indicator of market health and accessibility is the influx of new participants. In Q2 2026, 524 properties were bought by investors who now own just one property, represented by 698 distinct entities. This signifies a large and active entry-level segment, with many new individuals or partners beginning their investment journeys.

The concentration of activity in the smallest tier is profound. Single-property landlords alone made up 65.3% of all properties purchased by investors, demonstrating that the market's momentum comes from new and small operators, a pattern often seen in market reports focusing on emerging trends.

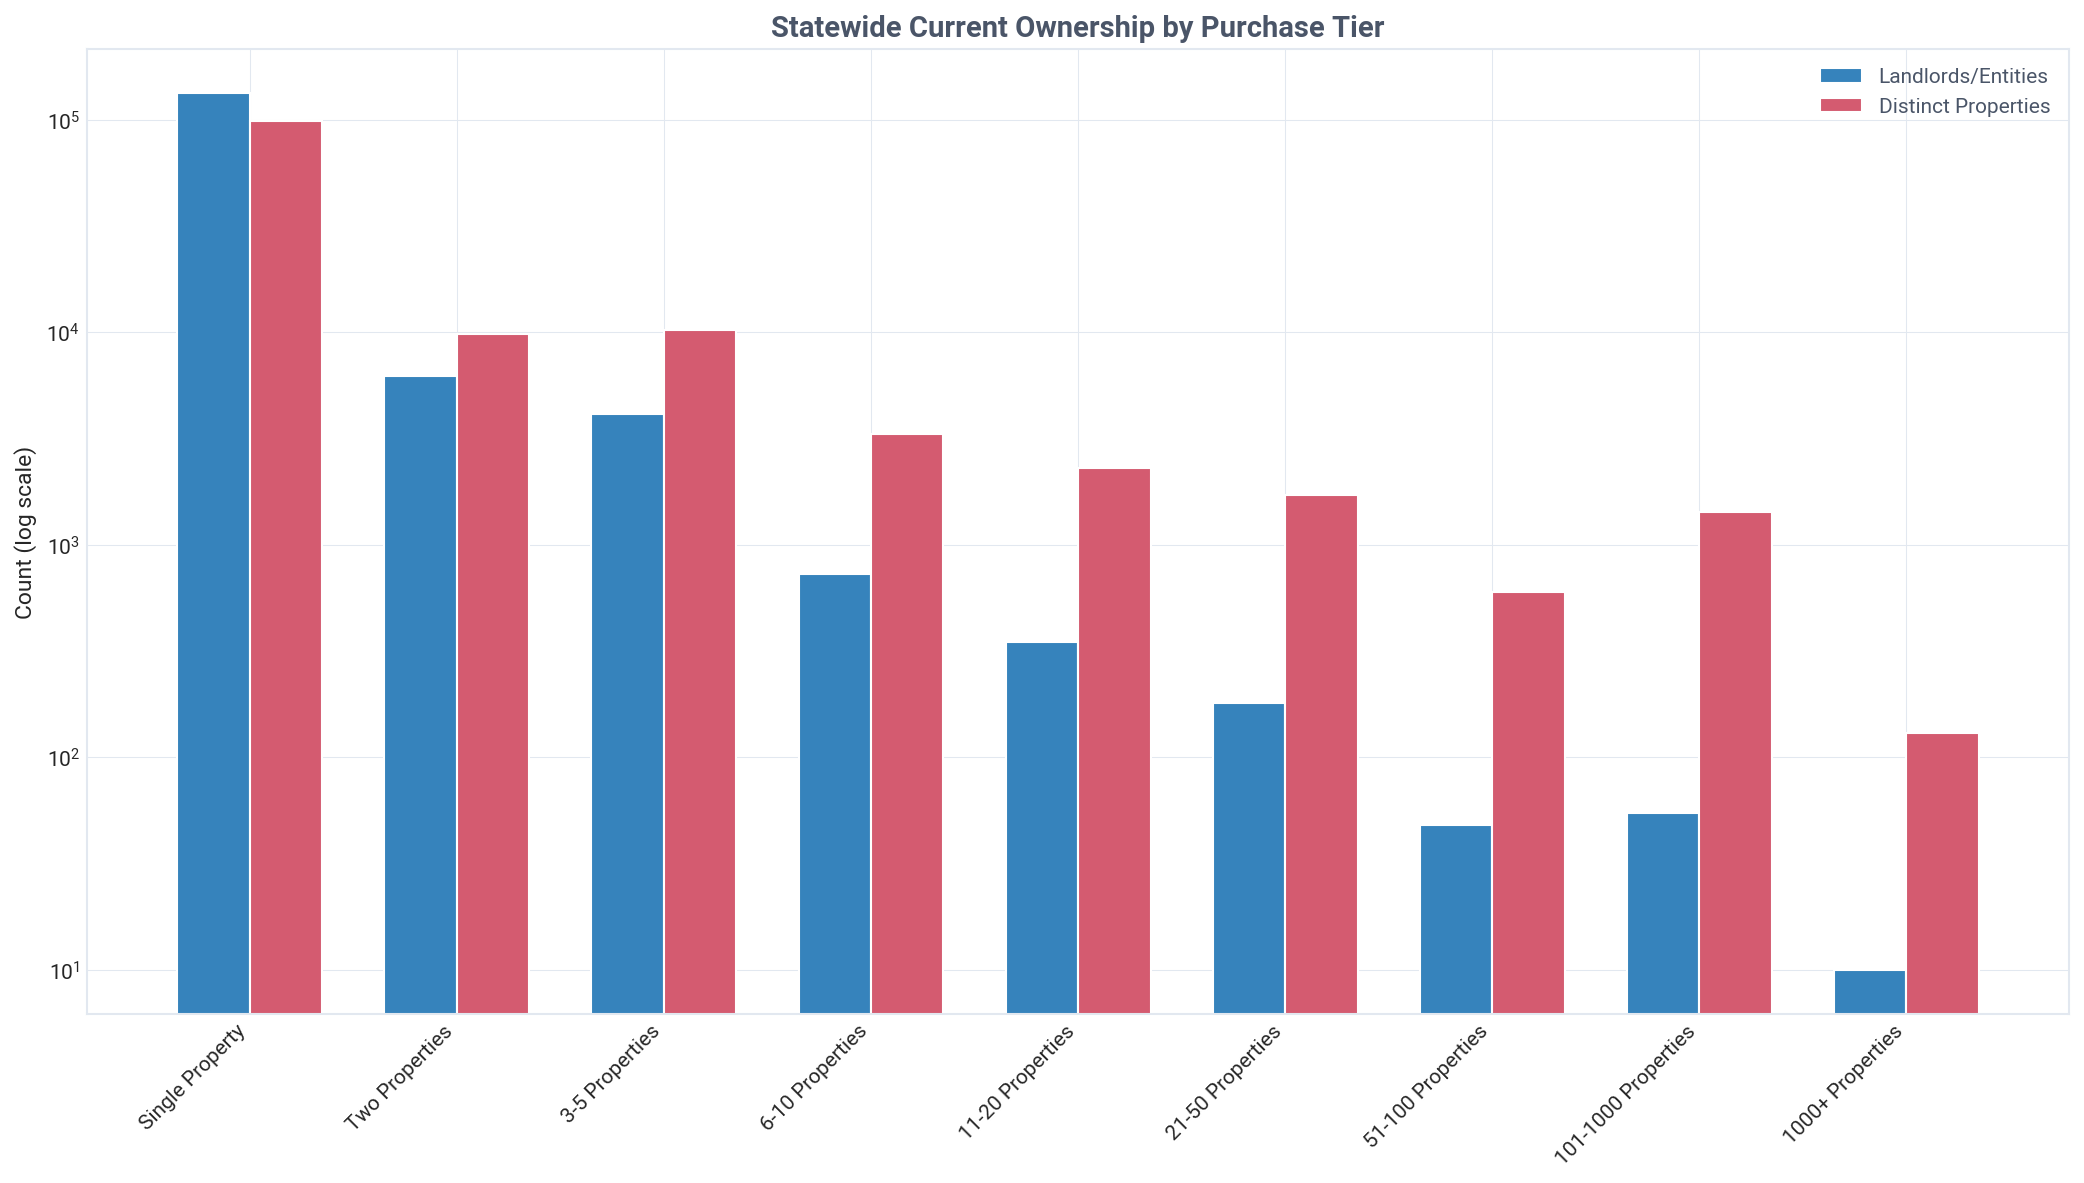
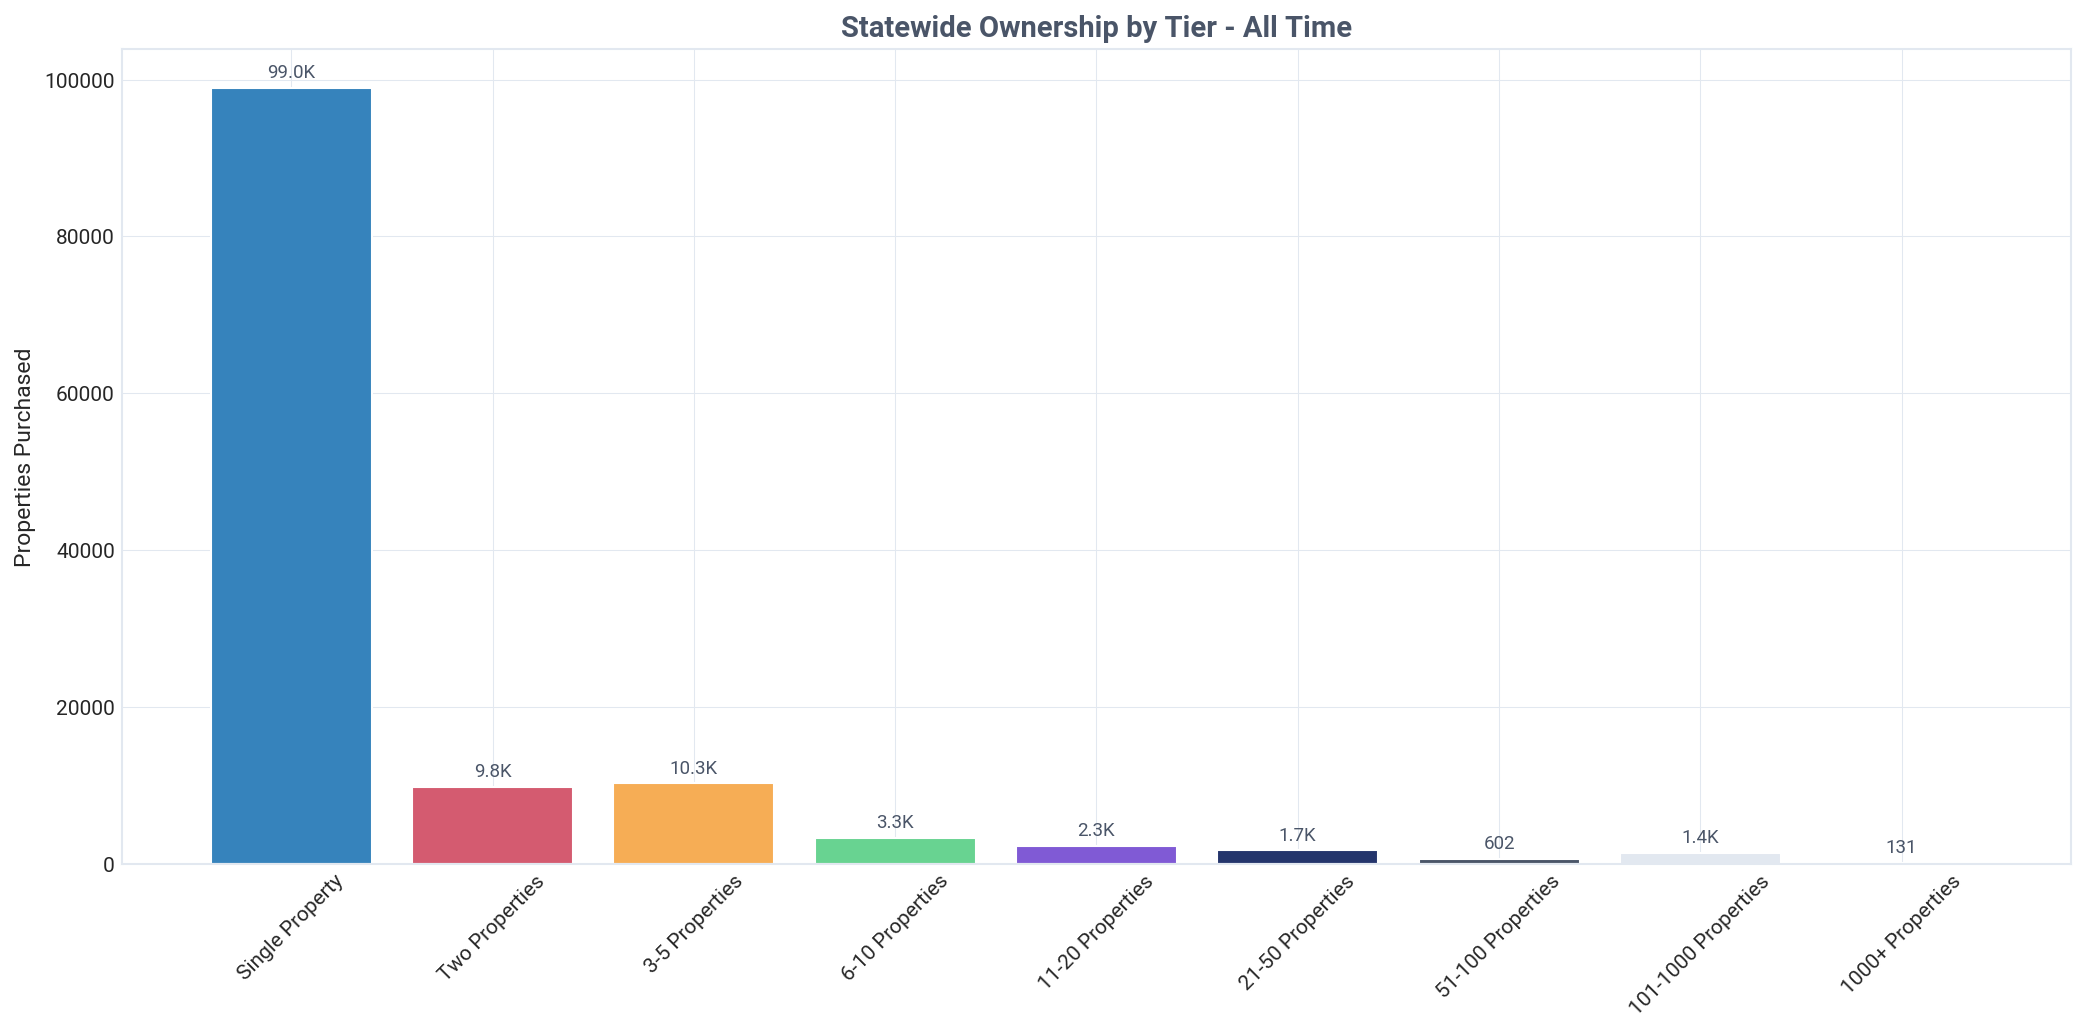
Ownership by Purchase Tier

Distribution of investor-owned properties across portfolio size tiers

Key Insight
Mom-and-pop landlords (1-10 properties) overwhelmingly control 95.2% of West Virginia's investor-owned SFR housing.
Detailed Findings

The ownership structure of West Virginia's rental market is definitively decentralized and dominated by small investors. Mom-and-pop landlords, defined as those owning 1-10 properties, control a staggering 95.2% of all investor-held SFRs. This concentration at the small end of the market is one of its most defining characteristics.

The role of institutional capital is almost negligible. Investors in the 1,000+ property tier own just 131 properties, accounting for only 0.1% of the investor-owned housing stock. This finding directly counters the narrative of large corporations controlling the housing market in this state.

The foundation of the investor market is the single-property landlord. This group alone owns 98,956 properties, which translates to 77.0% of all investor-owned SFRs. The next closest tier, two-property owners, holds just 7.6%, highlighting the extreme concentration in the entry-level tier.

Mid-size landlords (11-1000 properties) also have a limited footprint, collectively owning just 4.7% of the portfolio. This further reinforces that the market dynamics in West Virginia are shaped by the decisions of thousands of individual owners, not a handful of large operators.

This distribution pattern is crucial for anyone in the home services business or other related industries, as it indicates a fragmented client base of individual owners rather than large portfolio managers. A comprehensive property ownership by owner type report would confirm this granular structure.

West Virginia: current ownership by purchase tier, Q2 2026
West Virginia: properties purchased by tier, all time, Q2 2026
West Virginia: properties purchased by tier this quarter, Q2 2026
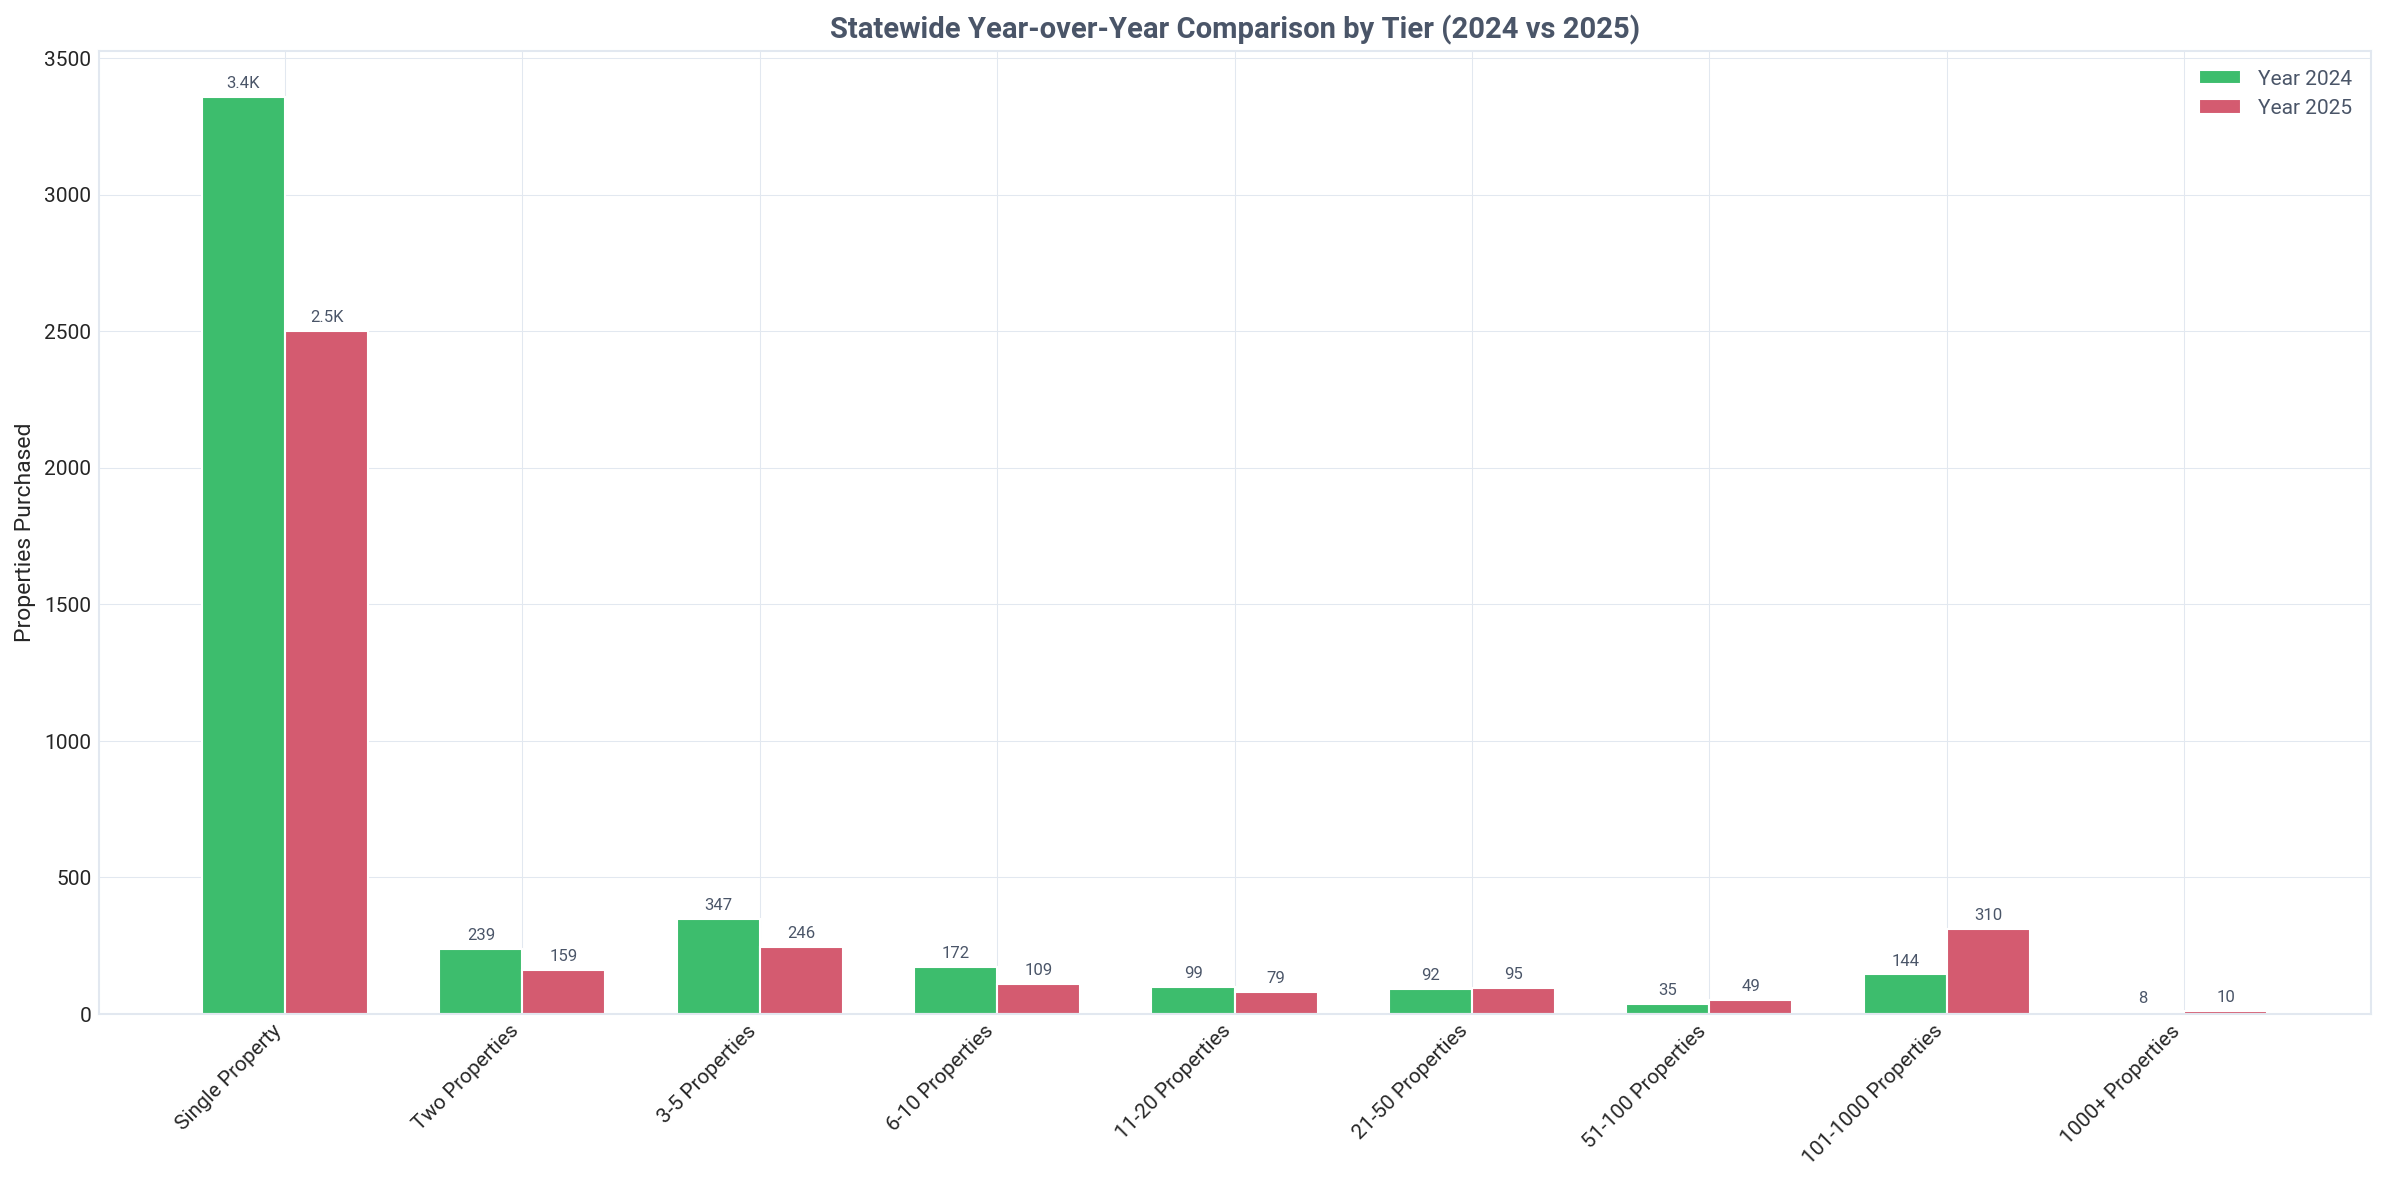
West Virginia: properties purchased by tier year over year, Q2 2026

Need custom portfolio analysis based on these tier insights?

TALK TO AN EXPERT

Ownership by Tier & Owner Type

Breakdown of individual vs corporate ownership across portfolio tiers

West Virginia: ownership by tier and owner type, Q2 2026
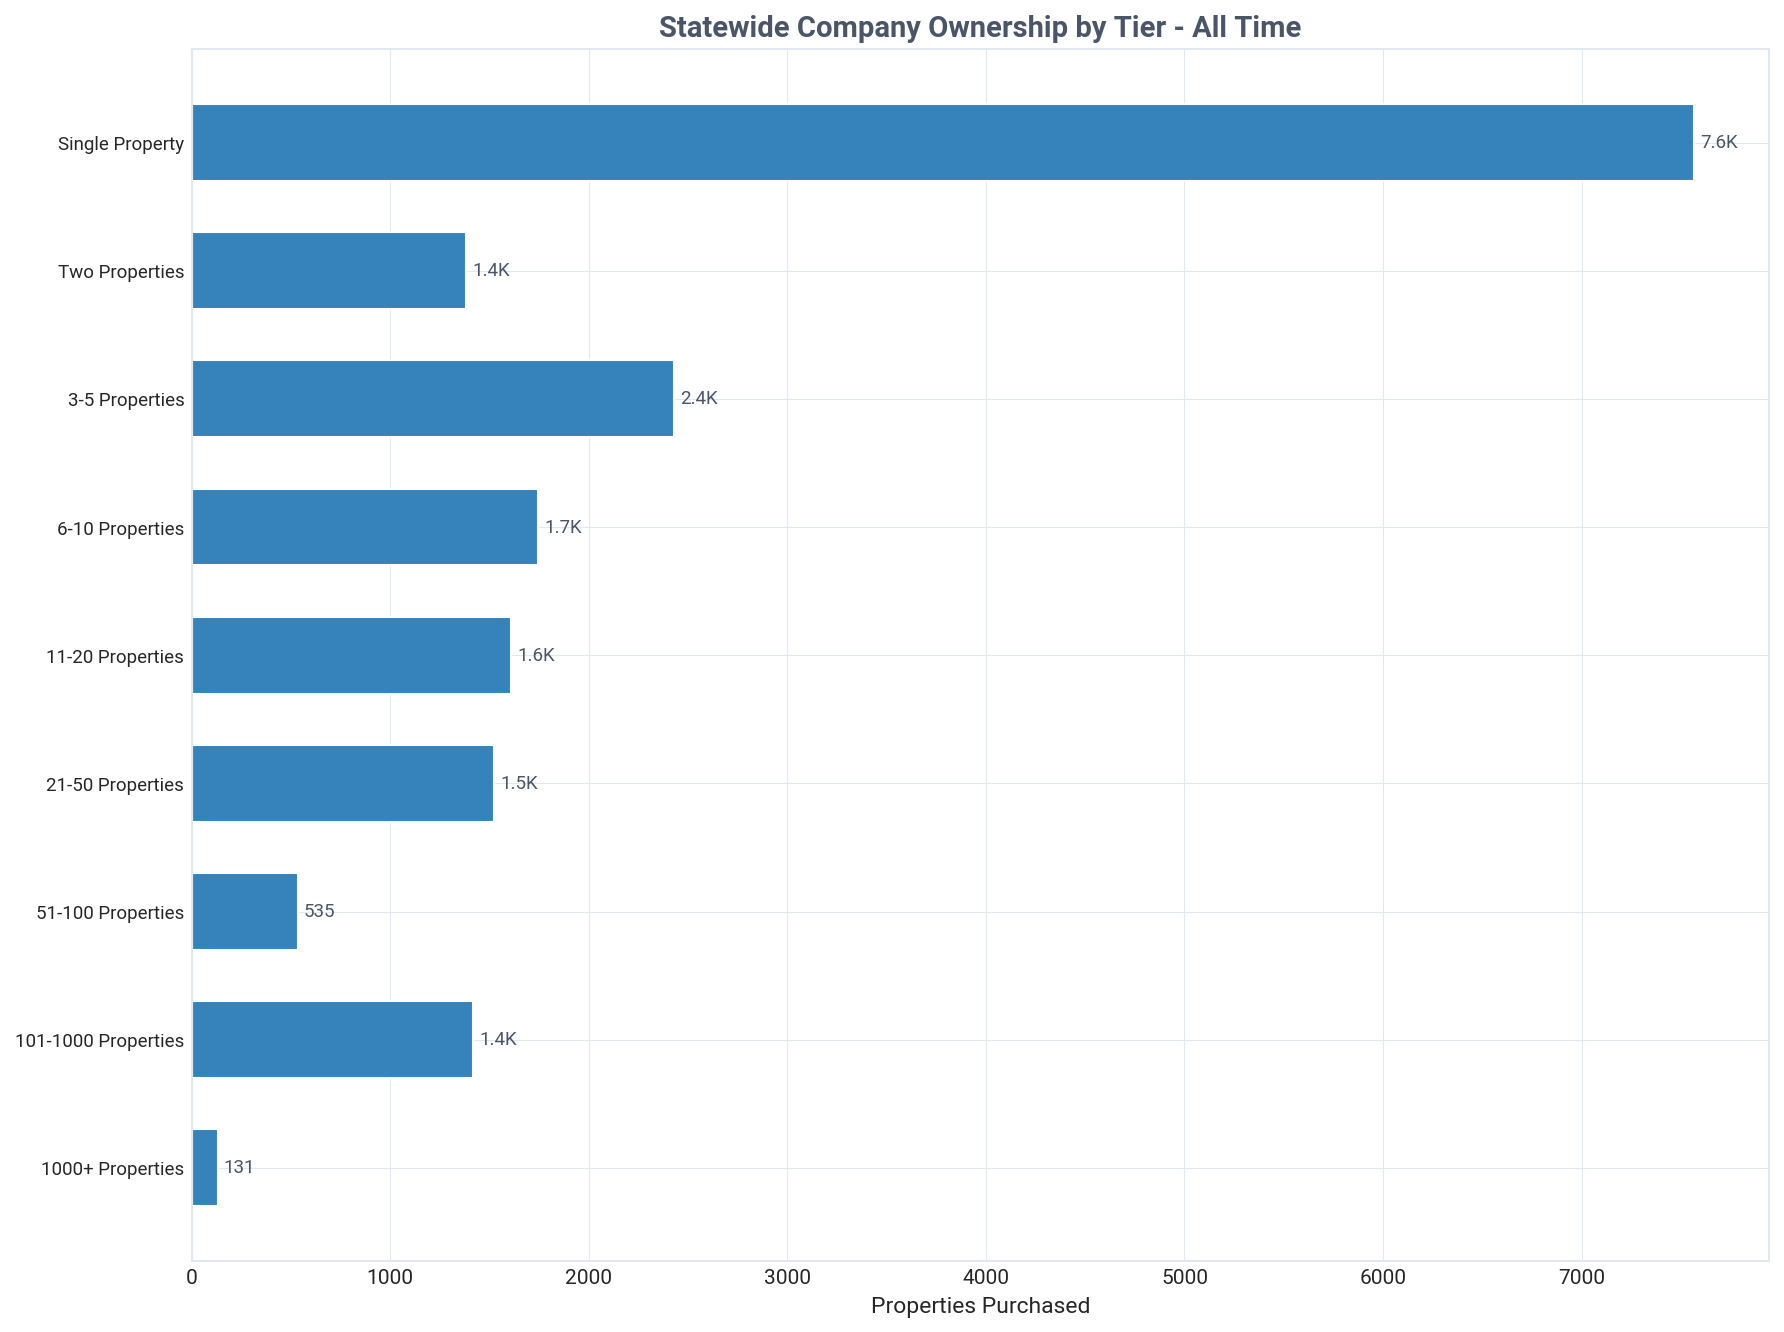
West Virginia: company purchases by tier, all time, Q2 2026
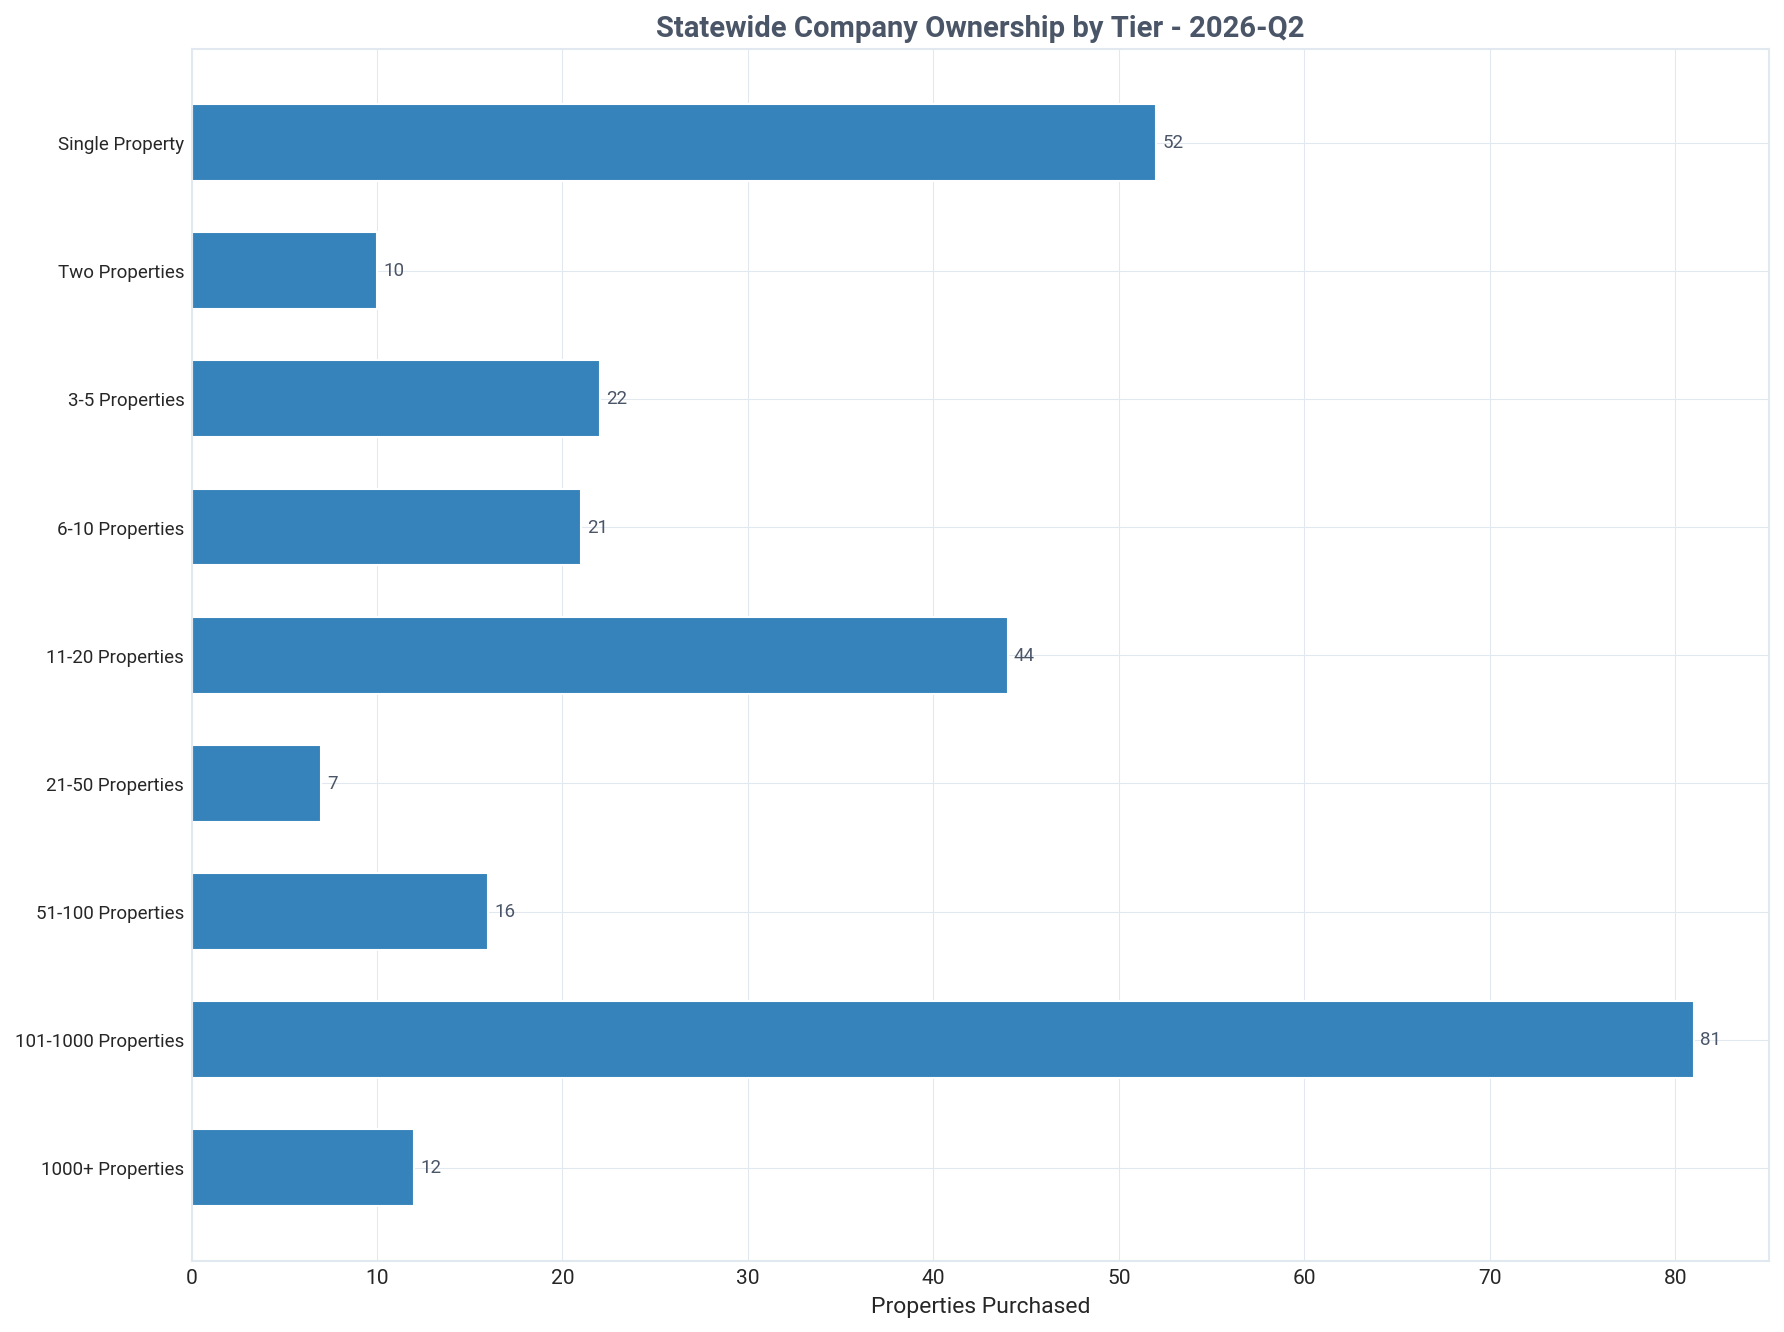
West Virginia: company purchases by tier this quarter, Q2 2026
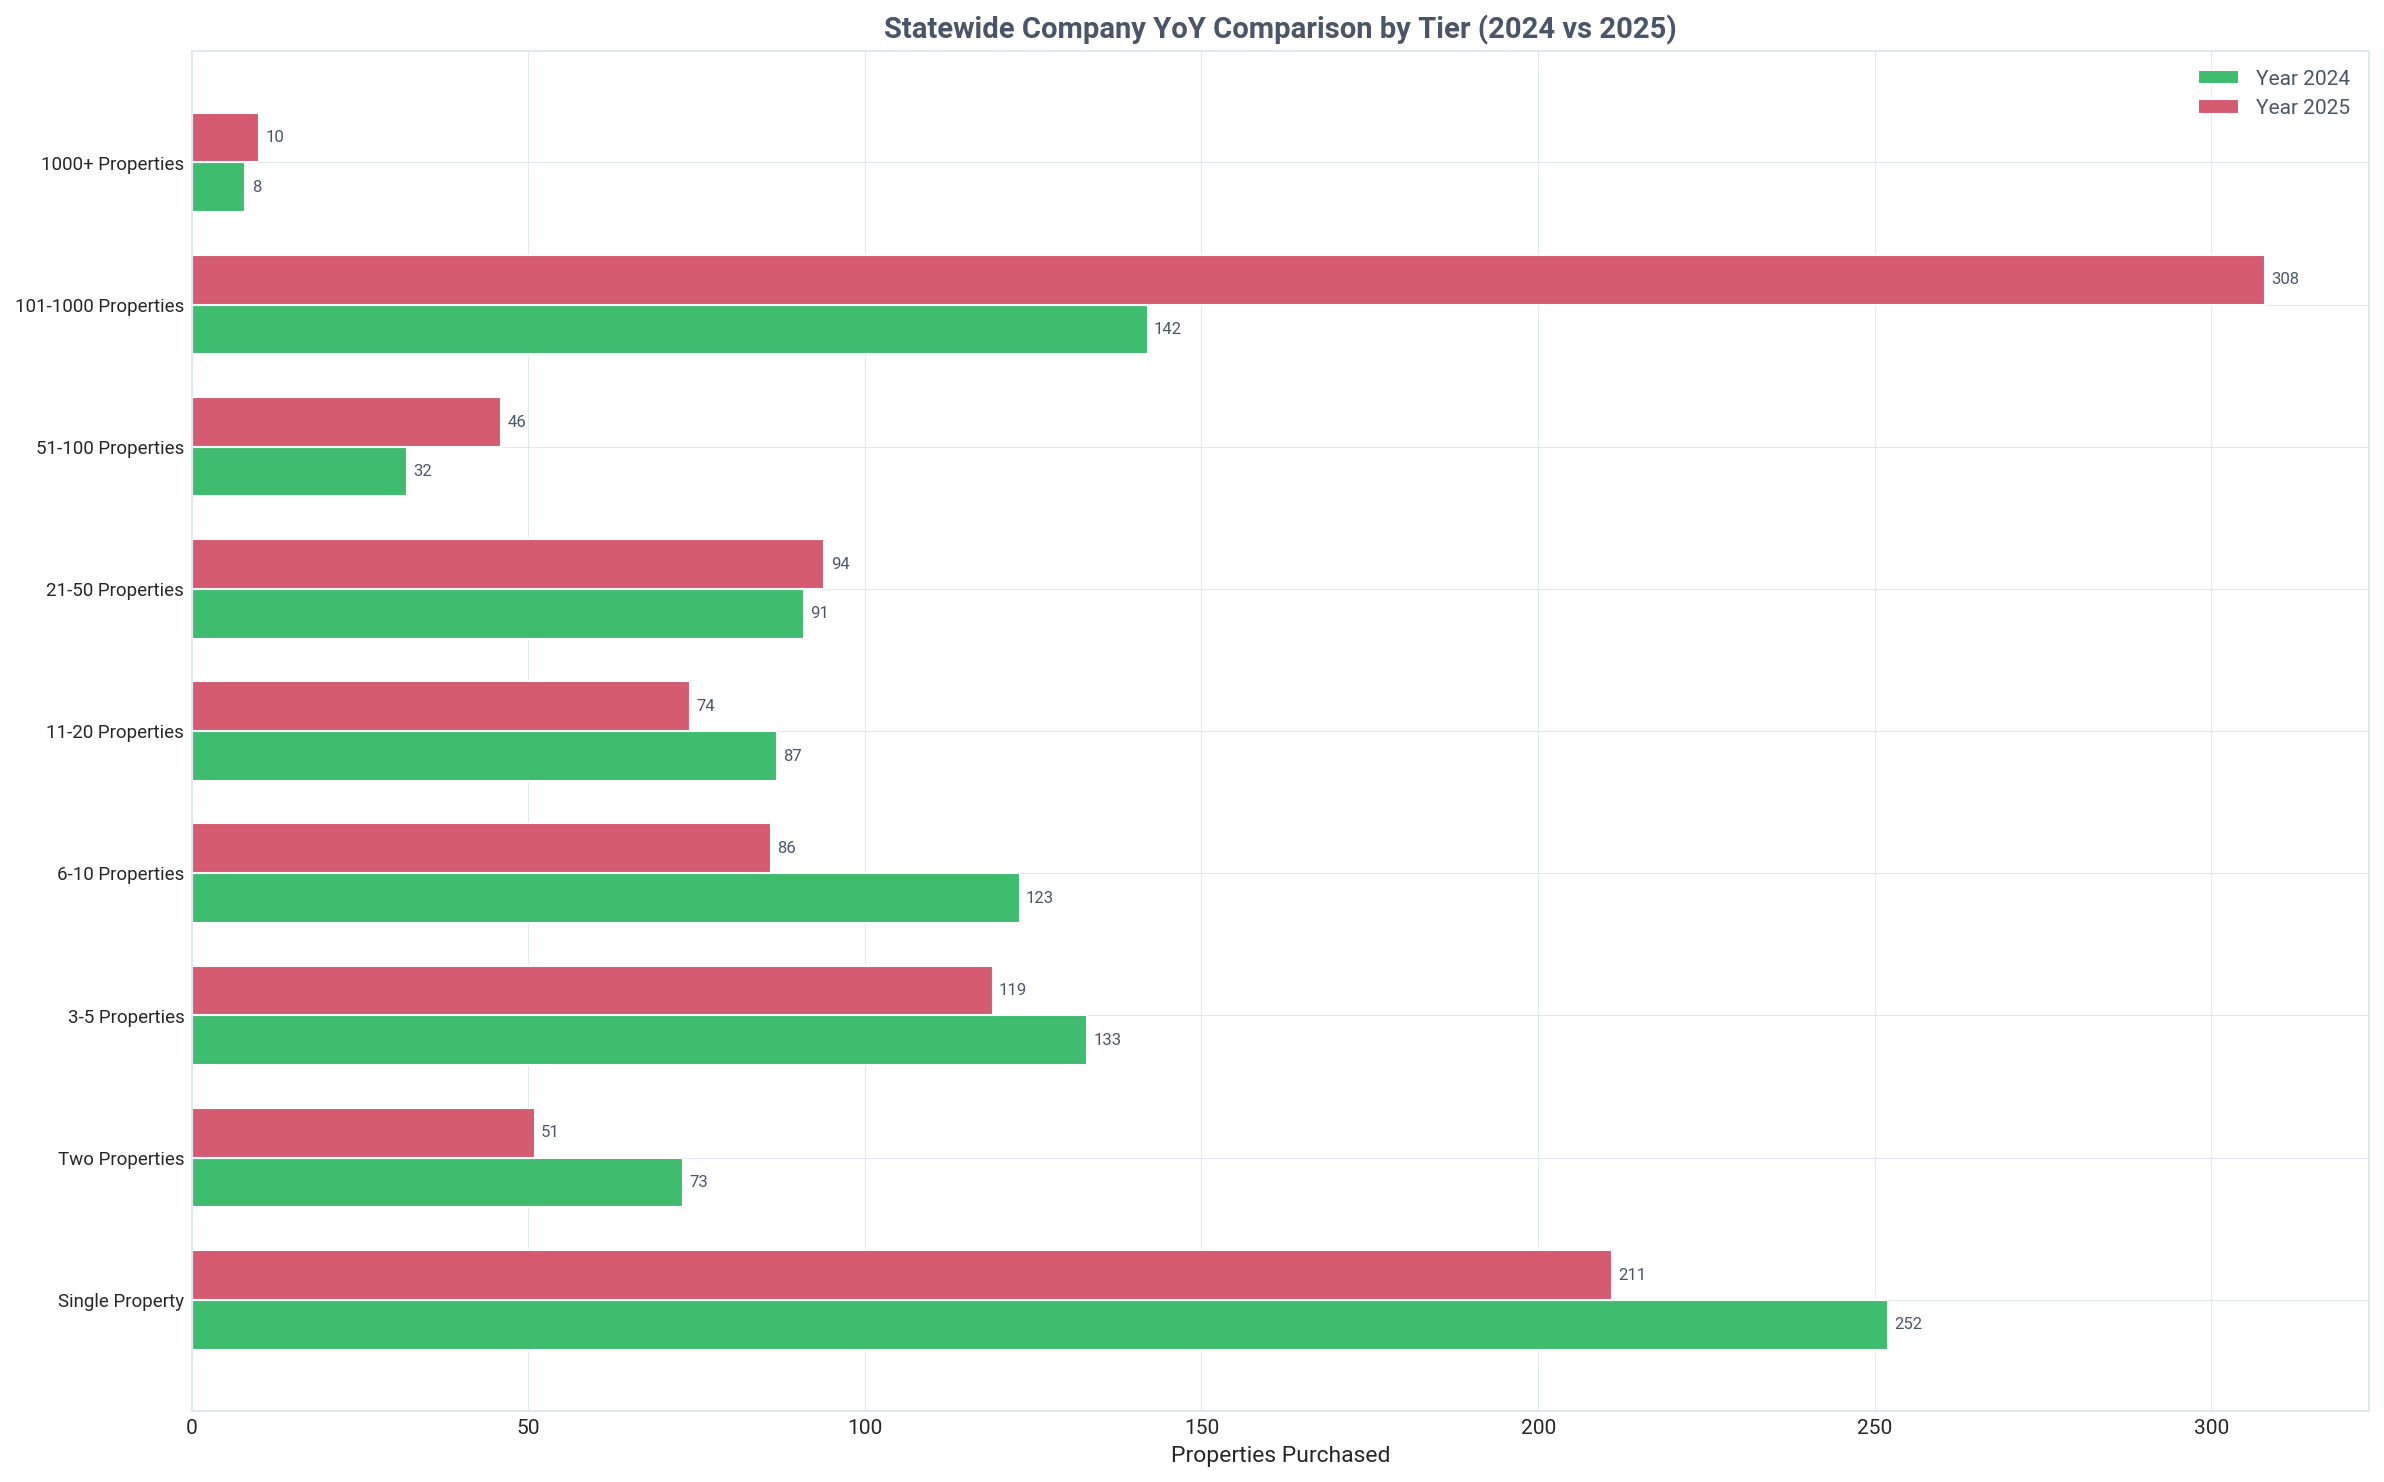
West Virginia: company purchases by tier year over year, Q2 2026
Key Insight
Companies become the majority owners at the 6-10 property tier, holding 52.7% of properties in that segment.
Detailed Findings

In West Virginia's investor market, the transition from individual to corporate ownership occurs as portfolios begin to scale. The key crossover point is the 6-10 property tier, where companies first become the majority, holding 1,747 properties (52.7%) compared to individuals' 1,567 (47.3%).

At the smaller end of the spectrum, individual ownership is nearly absolute. Individuals own 92.4% of single-property investor portfolios (91,822 properties) and 85.9% of two-property portfolios (8,423 properties). This demonstrates that the entry point for real estate investing is overwhelmingly an individual pursuit.

As portfolios grow, corporate structures become standard practice. In the 11-20 property tier, company ownership jumps to 70.1%. This trend accelerates dramatically in the largest tiers, with companies owning 88.9% of properties in the 51-100 tier and a virtually complete 99.6% in the 101-1000 property tier.

This pattern suggests that investors incorporate their holdings for liability and operational efficiency once they reach a certain scale, typically around half a dozen properties. This shift is a critical strategic step for growing investors.

For businesses looking to connect with these owners, understanding this structure is vital. A property search combined with ownership details can help identify whether the target is an individual or a registered company, allowing for tailored outreach strategies.

Geographic Distribution

Regional breakdown of investor activity and ownership patterns

Key Insight
Kanawha County leads West Virginia with 13,231 investor-owned properties, the highest count in the state.
Detailed Findings

Investor activity in West Virginia is concentrated in key population centers when measured by sheer volume. Kanawha County is the clear leader with 13,231 investor-owned properties, followed by Raleigh County (9,152) and Cabell County (6,110). These areas represent the largest hubs of rental housing in the state.

A different story emerges when looking at investor ownership as a percentage of the total housing market. Rural counties show the highest saturation, led by Pendleton County where investors own 44.9% of SFRs. McDowell (44.6%), Pocahontas (40.7%), and Wyoming (40.3%) counties also show investor ownership rates exceeding 40%.

This divergence indicates two distinct investment strategies at play. In urban areas like Kanawha County, investors are participating in a larger, more active market, even if their ownership rate (22.7%) is moderate. In contrast, investors in counties like Pendleton have a much more dominant market share, suggesting a focus on lower-cost housing or vacation rental markets.

Berkeley County stands out as a major hub (5,926 properties) but with a relatively low investor ownership rate of 14.1%. This suggests a market with a higher proportion of traditional homeowners, potentially offering different types of investment opportunities.

Analyzing geographic distribution with demographic data can provide deeper context, explaining why certain rural areas have such high investor penetration compared to more populous regions. This level of detail is a cornerstone of effective market analysis.

West Virginia: landlord ownership map, Q2 2026
West Virginia: top 15 areas by landlord-owned properties, Q2 2026
West Virginia: top 15 areas by landlord ownership share, Q2 2026

Historical Transactions

Buy/sell transaction trends over time for all landlords and institutional investors

West Virginia: landlord buy and sell transactions, Q2 2026
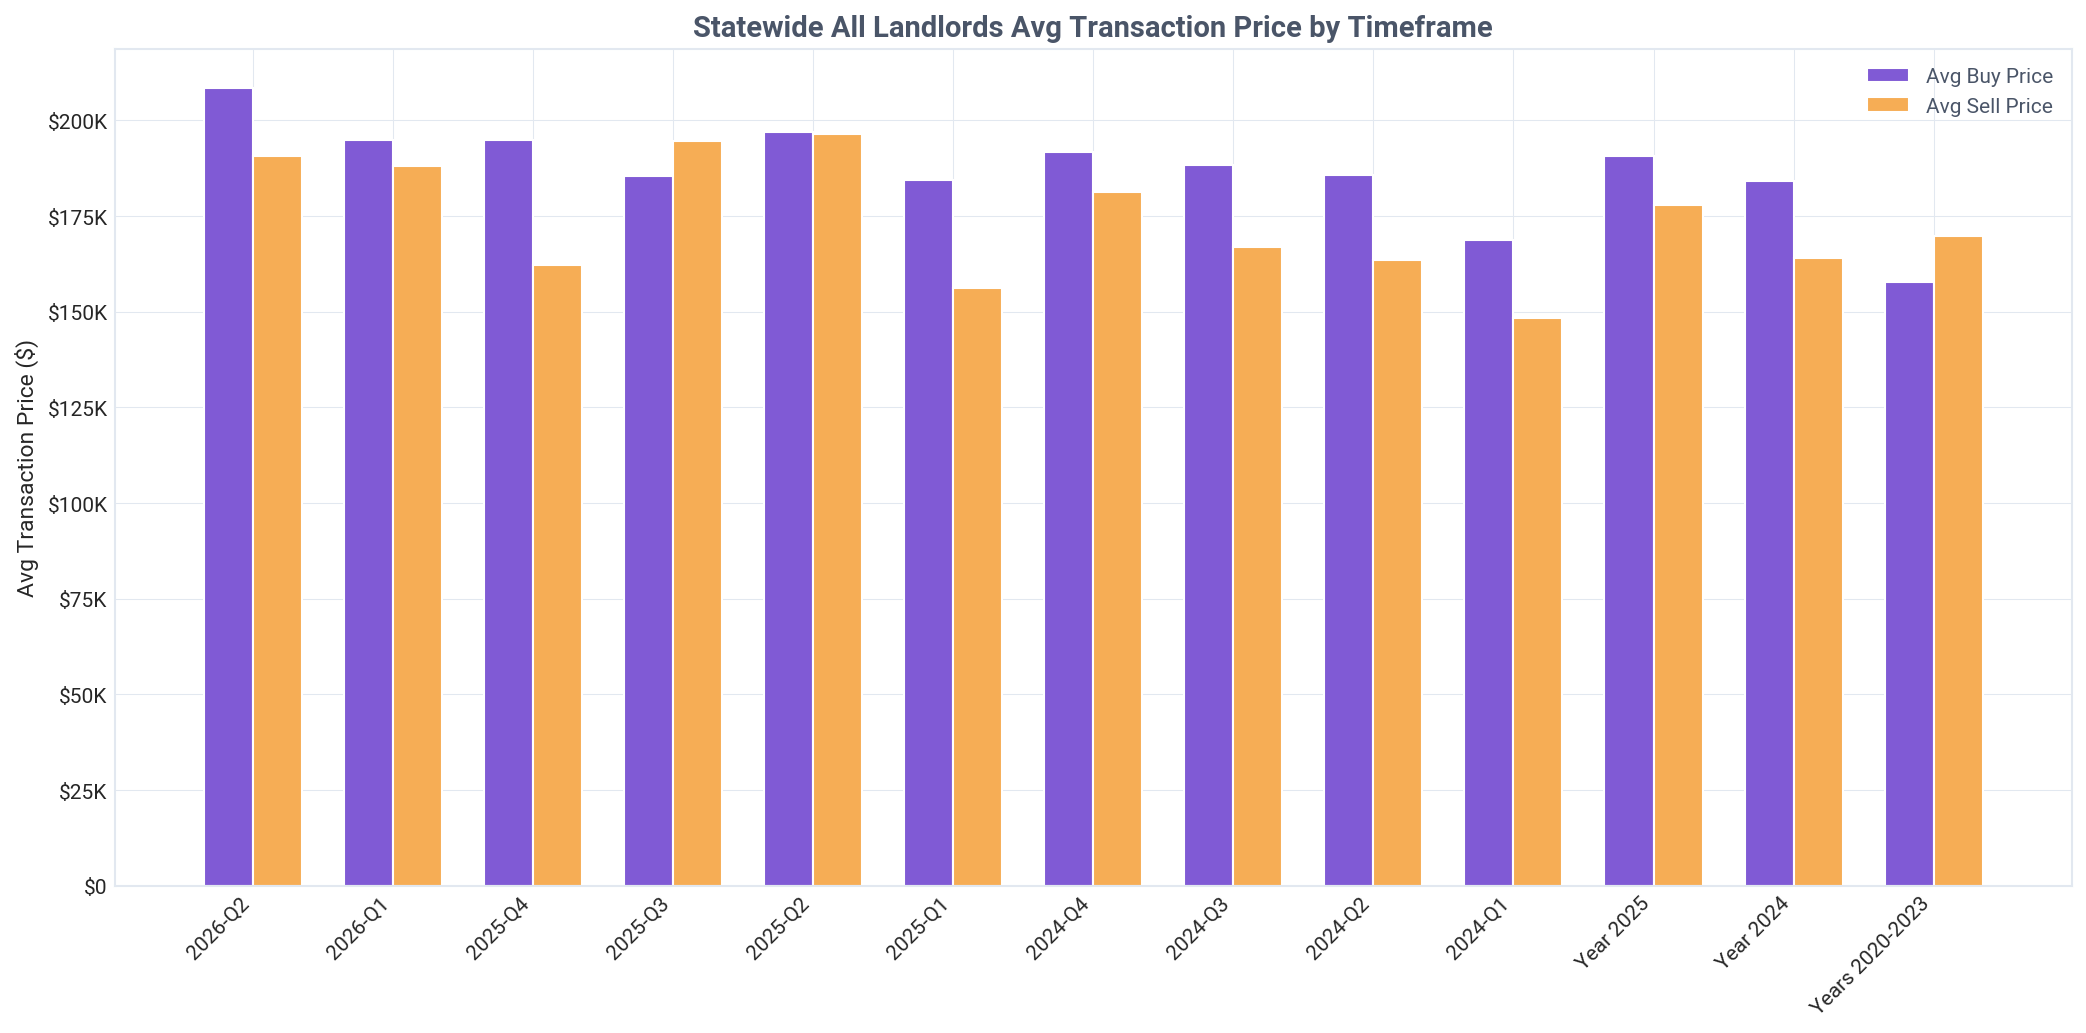
West Virginia: landlord average buy and sell prices, Q2 2026
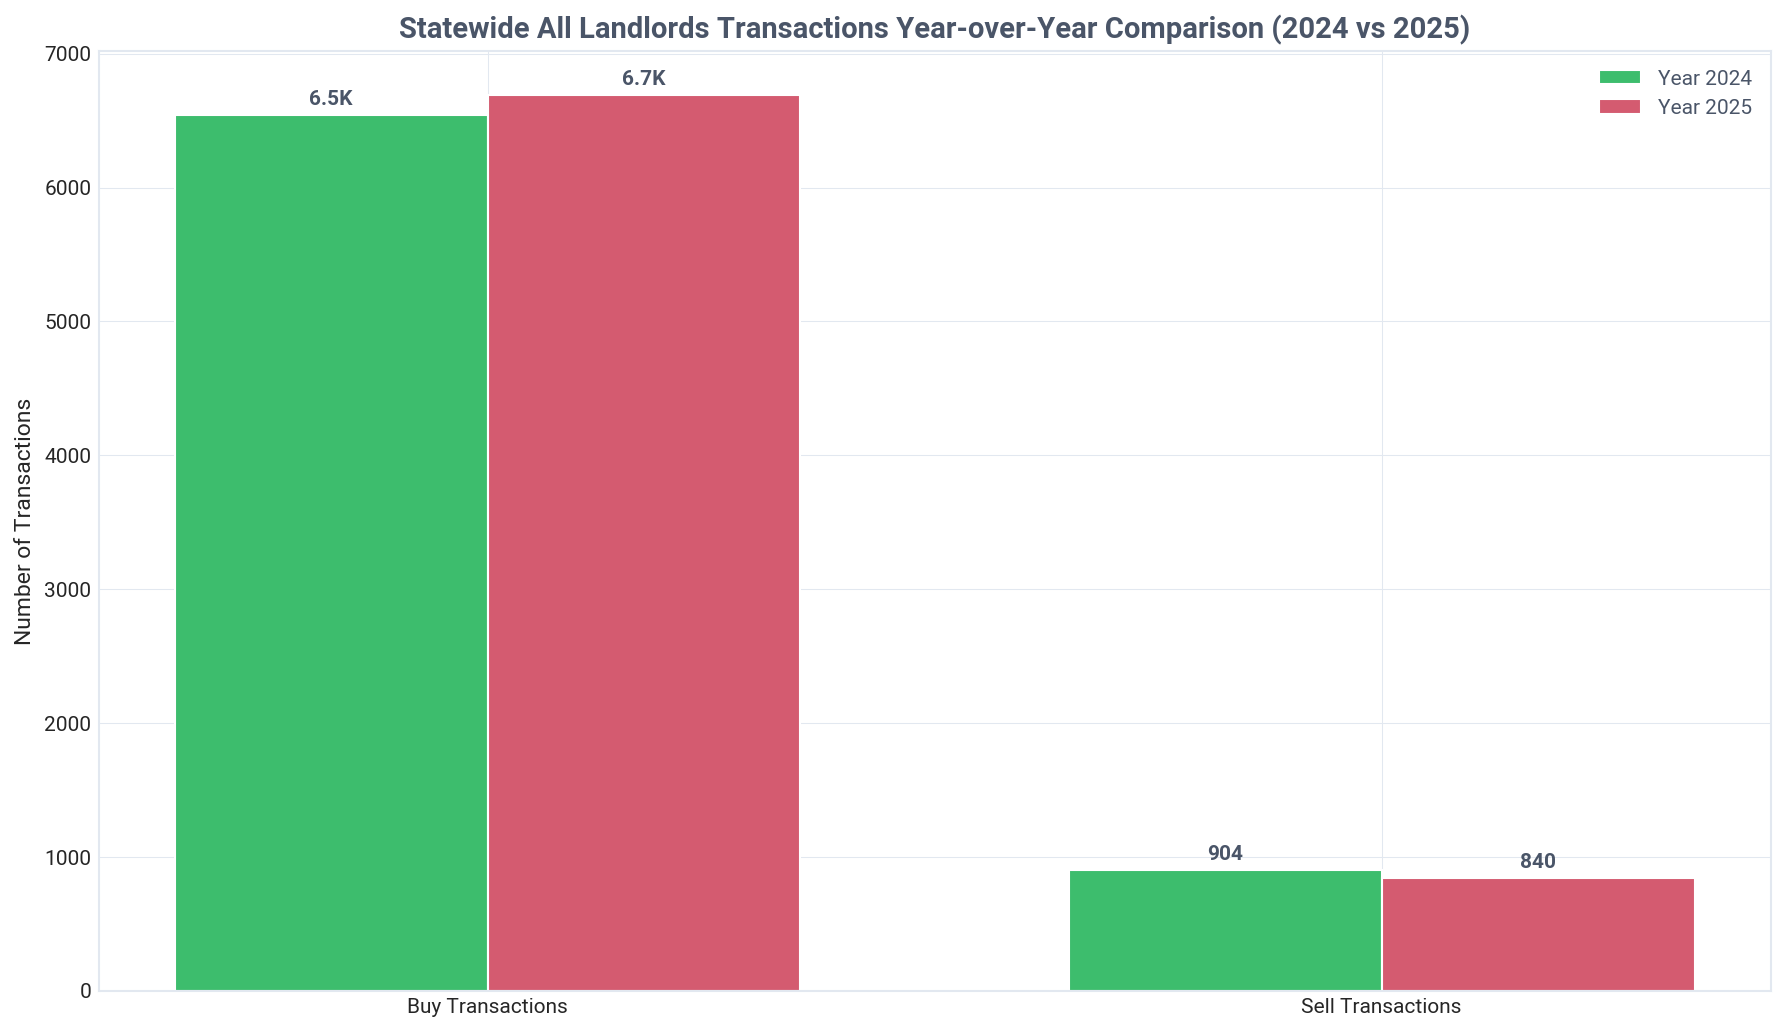
West Virginia: landlord transactions year over year, Q2 2026
West Virginia: 1000+ tier company transactions, Q2 2026
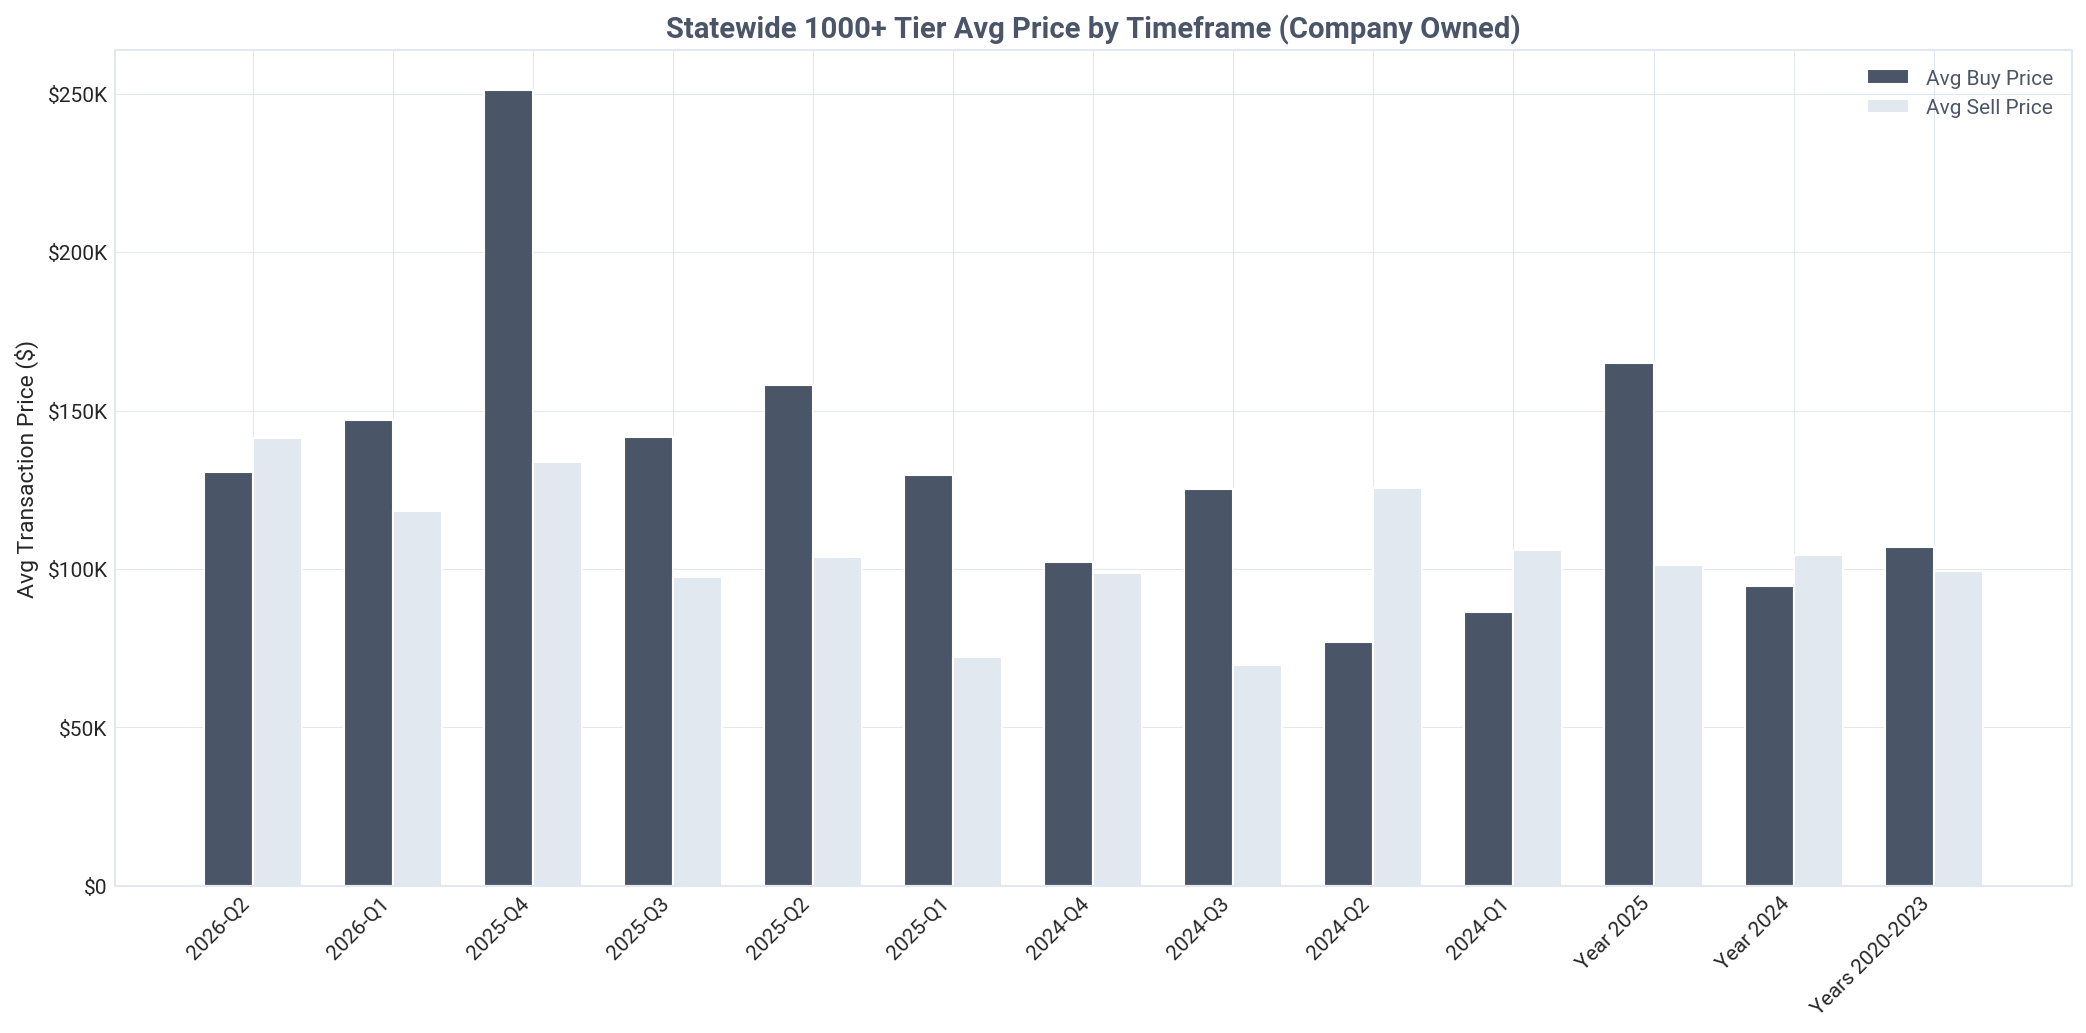
West Virginia: 1000+ tier company average prices, Q2 2026
West Virginia: 1000+ tier transactions year over year, Q2 2026
Key Insight
West Virginia landlords are aggressive net buyers, acquiring 6.6 properties for every one they sold in Q2 2026.
Detailed Findings

The transaction data reveals a clear and sustained appetite for acquisition among West Virginia's landlords. In Q2 2026, they purchased 1,191 properties while selling only 181, resulting in a net gain of 1,010 properties and a strong 6.6-to-1 buy-to-sell ratio. This indicates a bullish outlook on the state's rental market.

This net buyer position is not a recent development. Landlords have consistently expanded their portfolios, with a net gain of 5,638 properties in 2024 and 5,848 in 2025. The high transaction velocity points to a liquid and active market where investors are continuously reinvesting.

Institutional investors (1,000+ properties) show a more volatile pattern. After being net sellers for two consecutive years (net -24 in 2024, net -1 in 2025), they have reversed course in Q2 2026, becoming slight net buyers with 13 acquisitions against 10 sales. This could signal a renewed, albeit small-scale, interest in the West Virginia market from larger players.

The overall market's momentum is clearly driven by the broader base of small and mid-size landlords who are consistently in accumulation mode. Their steady buying pressure is a primary force shaping housing inventory and pricing dynamics.

Tracking these transaction flows, especially signs of distress like in pre-foreclosure data, can reveal the sources of this inventory and predict future market movements. This is a critical component for investors seeking an edge.

Current Quarter Transactions

Q2 2026 transaction analysis by tier, price, and inter-landlord activity

Key Insight
Landlord activity accounted for 23.8% of all 5,003 SFR transactions in West Virginia during Q2 2026.
Detailed Findings

In Q2 2026, landlords were involved in 1,191 of the 5,003 total SFR transactions in West Virginia, capturing a 23.8% market share. This highlights their significant and consistent role in market liquidity.

A stark pricing disparity exists between investor tiers. New landlords entering the market (Tier 01) paid the highest average price at $235,492. In contrast, institutional investors (Tier 09) paid an average of just $130,596, a 44.5% discount compared to their smallest counterparts. This suggests larger investors leverage scale and experience to secure more favorable pricing.

The most aggressive pricing was seen from large landlords in the 101-1000 tier, who paid an average of only $73,927 per property. This massive price difference indicates a strategy focused on acquiring lower-cost housing stock, possibly in bulk or off-market deals.

Sourcing strategies also differ dramatically by tier. Institutional investors engaged heavily in inter-landlord trading, with 46.2% of their acquisitions coming from other landlords. This points to a professionalized network where portfolios are traded between experienced operators. Many proptech platforms facilitate these connections.

Conversely, new single-property investors are far more likely to buy from traditional homeowners, with only 7.0% of their purchases sourced from other landlords. This shows they primarily compete in the open market, which may explain why they pay higher prices. Finding motivated sellers through methods like skip tracing could help them find better deals.

West Virginia: landlord share of transactions, Q2 2026
West Virginia: transactions by tier this quarter, Q2 2026
West Virginia: average purchase price by tier, Q2 2026

Ready to leverage this data for your real estate investment decisions?

TALK TO AN EXPERT

Executive Summary

West Virginia's Investor Market: 95% Controlled by Small Landlords Buying at a 26% Discount
Holdings
Investors own 125,225 SFR properties, representing 23.8% of West Virginia's total market. The portfolio is dominated by individual investors, who hold 107,472 properties (85.8%), while companies own the remaining 18,296 (14.6%).
Pricing
In Q2 2026, landlords paid an average of $209,820, securing a 26.4% discount compared to traditional homeowners who paid $284,951. This represents a significant price advantage of $75,131 per property for investors.
Activity
Landlords were highly active in Q2 2026, purchasing 790 properties and accounting for 22.6% of all market sales. The quarter saw a surge of new entrants, with 698 new single-property landlords joining the market.
Market Share
The market is overwhelmingly controlled by small 'mom-and-pop' landlords (1-10 properties), who own 95.2% of all investor-held SFRs. In contrast, institutional investors (1,000+ properties) hold a minuscule 0.1% share.
Ownership Type
Individual investors are the primary owners in smaller portfolios, but companies become the majority owners once a portfolio reaches the 6-10 property size. This indicates a trend of incorporation as investors scale their operations.
Transactions
Landlords are strong net buyers, acquiring 6.6 properties for every one they sold in Q2 2026 (1,191 buys vs. 181 sells). After two years as net sellers, institutional investors shifted to become slight net buyers this quarter.
Market Narrative

West Virginia's single-family rental market is defined by its grassroots structure and the savvy of its small, independent operators. Investors own 125,225 SFR properties, a 23.8% share of the state's total housing stock. This portfolio is not controlled by Wall Street; instead, 85.8% of it is held by individual investors. The market is highly fragmented, with 'mom-and-pop' landlords (1-10 properties) owning a commanding 95.2% of all investor-held homes, while large institutional firms control a mere 0.1%.

Investor behavior in Q2 2026 demonstrates both confidence and skill. Landlords were aggressive net buyers, acquiring 22.6% of all homes sold and purchasing 6.6 properties for every one they divested. Their most notable advantage is in pricing: investors paid an average of 26.4% less than traditional homeowners, a discount that has been widening over the past year. This indicates a sophisticated ability to identify value, likely through off-market channels or by targeting properties that require renovation, a trend highlighted in our on-market vs off-market sold report.

The key takeaway is that West Virginia's housing market dynamics are shaped by thousands of local investors, not a few corporate giants. With 698 new landlords entering the market in a single quarter, the path to real estate investment remains accessible. This market structure implies that the health and stability of the rental supply depend on the success of these small operators. For those looking to enter or serve this market, success hinges on understanding this decentralized landscape and the unique strategies these investors employ, from leveraging bulk property data to pinpointing opportunities.

About This Report

Report Methodology

This report analyzes BatchData's Investor Pulse dataset, covering single-family residential (SFR) investor activity across the United States.

Data is extracted from 15 CSV files covering ownership, transactions, and pricing trends, then analyzed using AI-powered insights.

Property Counting Methodology:

Distinct Counts: All headline totals represent distinct properties. If 2+ landlords co-own the same property, it's counted only once. This provides accurate market representation.

Category Breakdowns: When analyzing by tier (01-09), owner type (Individual/Corporate), or occupancy status, properties with co-ownership across categories are counted once per category. This causes breakdowns to sum 2-4% higher than totals, and percentages may sum to 100-104%. This is expected and reflects co-ownership patterns.

Tier Properties Category
01-041-10Mom-and-Pop
05-0711-100Mid-Size
08101-1000Large
091000+Institutional
About BatchData

BatchData provides comprehensive real estate data and analytics, offering insights into property ownership, investor activity, and market trends across the United States.

The Investor Pulse dataset tracks single-family residential (SFR) investor behavior at national, state, county, and MSA levels.

For more information, visit batchdata.io or explore our API documentation.

Data Freshness
Report Generated October 29, 2026 at 12:36 AM
Data Period Q2 2026
Geography Level State
Geography West Virginia
×
Chart Section2 Coverage
West Virginia: SFR vs other property coverage, Q2 2026
×
Chart Section3 Ownership Donut
West Virginia: SFR ownership share, company vs individual, Q2 2026
×
Chart Section3 Ownership Bar
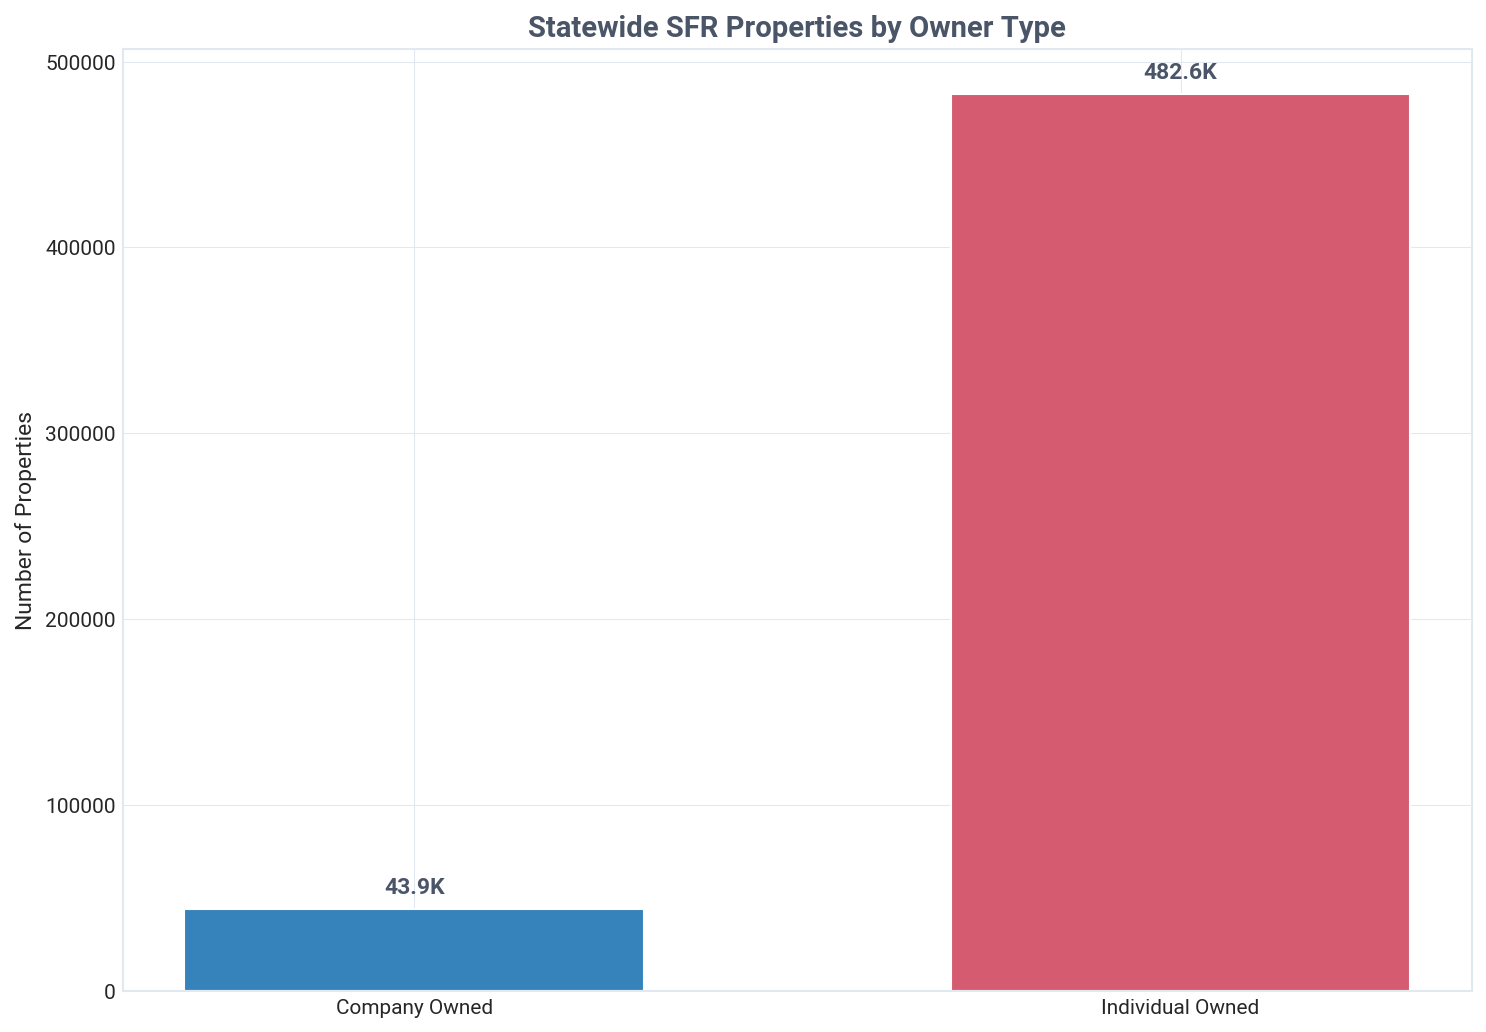
West Virginia: SFR properties by owner type, Q2 2026
×
Chart Section4 Distribution
West Virginia: company vs individual landlords, Q2 2026
×
Chart Section5 Holdings
West Virginia: landlord SFR holdings by type, Q2 2026
×
Chart Section6 Prices
West Virginia: properties purchased by timeframe, Q2 2026
×
Chart Section6 Prices Alt
West Virginia: average acquisition price by timeframe, Q2 2026
×
Chart Section6 Yoy Comparison
West Virginia: average acquisition price year over year, Q2 2026
×
Chart Section6 Trends
West Virginia: average acquisition price by buyer type, Q2 2026
×
Chart Section7 Purchases
West Virginia: purchases by tier, Q2 2026
×
Chart Section7 Tiers
West Virginia: purchased property share by tier, Q2 2026
×
Chart Section8 Distribution
West Virginia: current ownership by purchase tier, Q2 2026
×
Chart Section8 Prices
West Virginia: properties purchased by tier, all time, Q2 2026
×
Chart Section8 Prices Q4
West Virginia: properties purchased by tier this quarter, Q2 2026
×
Chart Section8 Prices 2020
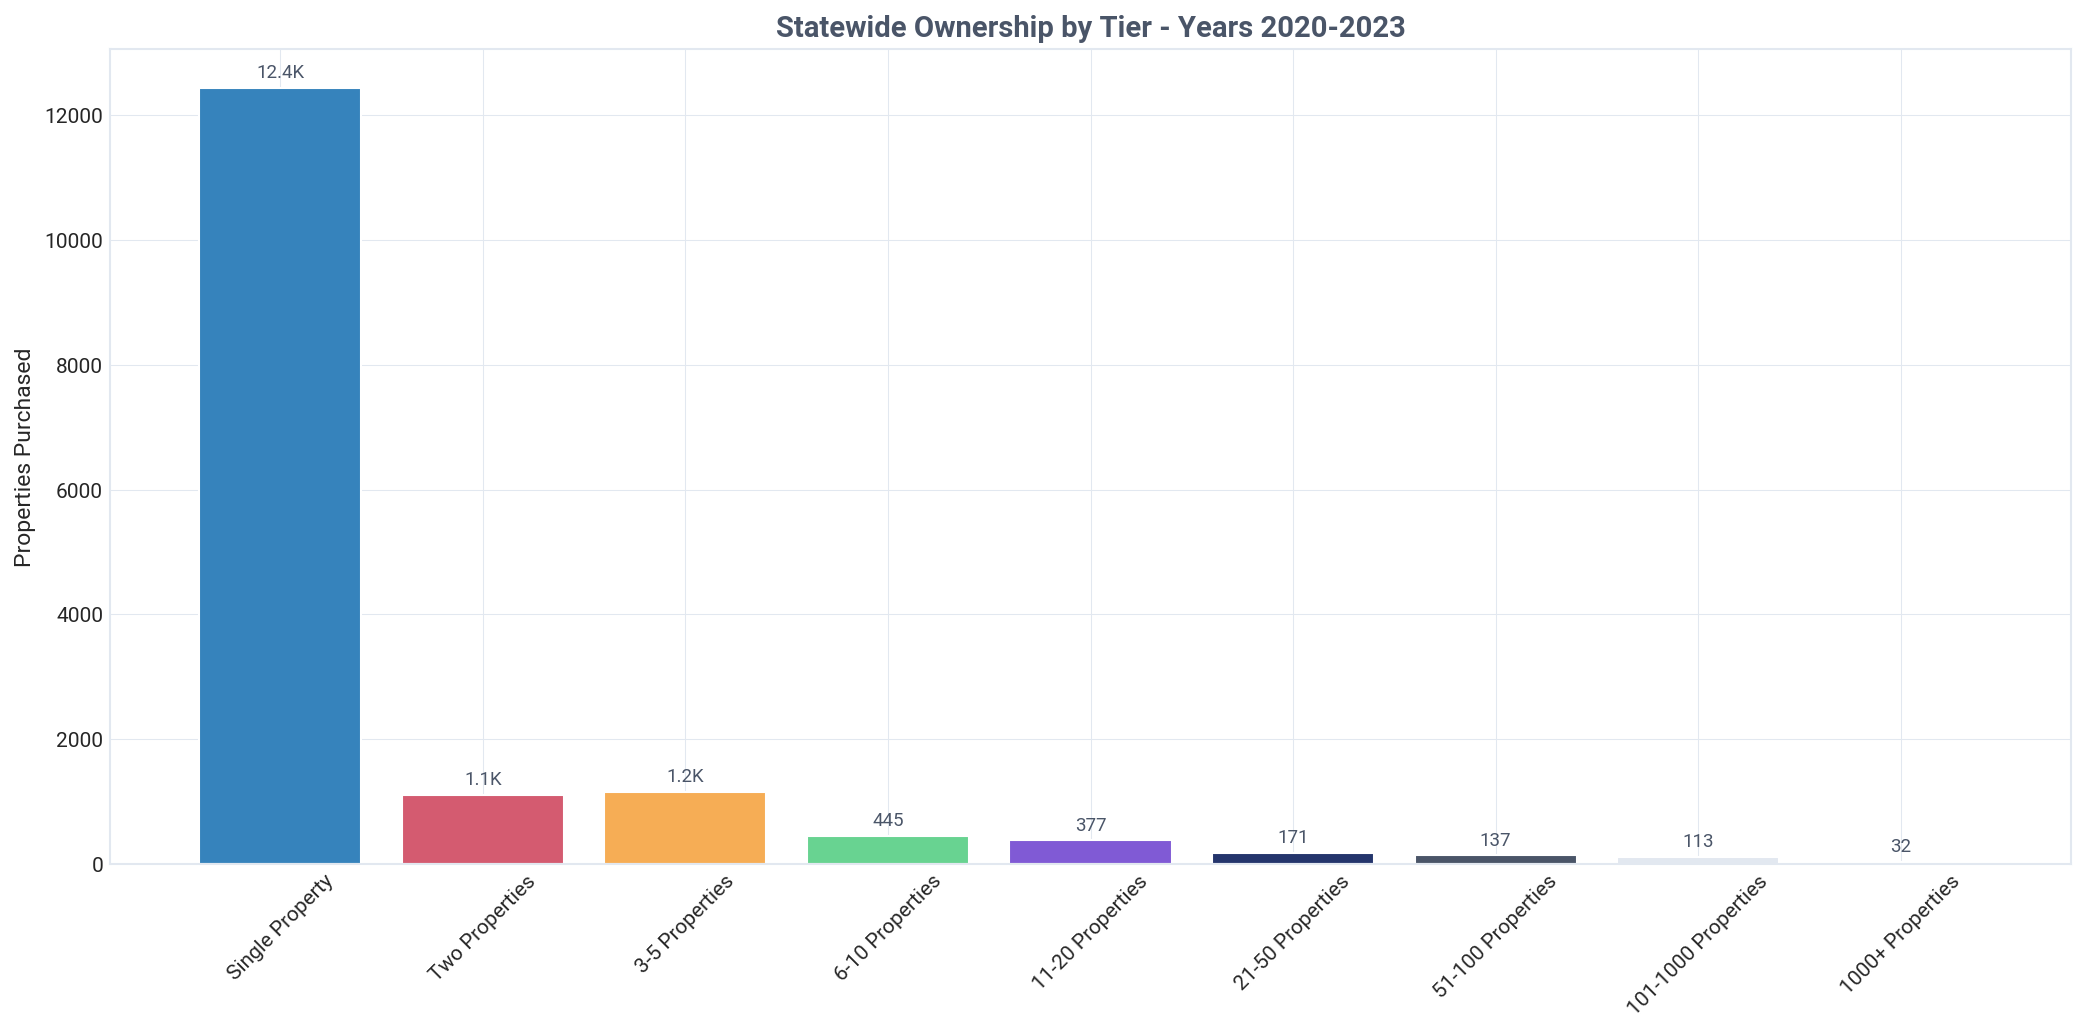
West Virginia: properties purchased by tier, historical, Q2 2026
×
Chart Section8 Yoy Comparison
West Virginia: properties purchased by tier year over year, Q2 2026
×
Chart Section9 Ownership
West Virginia: ownership by tier and owner type, Q2 2026
×
Chart Section9 Growth
West Virginia: company purchases by tier, all time, Q2 2026
×
Chart Section9 Growth Q4
West Virginia: company purchases by tier this quarter, Q2 2026
×
Chart Section9 Yoy Comparison
West Virginia: company purchases by tier year over year, Q2 2026
×
Chart Section10 Top Regions
West Virginia: top 15 areas by landlord-owned properties, Q2 2026
×
Chart Section10 Top Pct
West Virginia: top 15 areas by landlord ownership share, Q2 2026
×
Chart Section10 Map
West Virginia: landlord ownership map, Q2 2026
×
Chart Section11 Buysell
West Virginia: landlord buy and sell transactions, Q2 2026
×
Chart Section11 Buysell Price
West Virginia: landlord average buy and sell prices, Q2 2026
×
Chart Section11 Yoy All Landlords
West Virginia: landlord transactions year over year, Q2 2026
×
Chart Section11 Institutional
West Virginia: 1000+ tier company transactions, Q2 2026
×
Chart Section11 Institutional Price
West Virginia: 1000+ tier company average prices, Q2 2026
×
Chart Section11 Yoy Institutional
West Virginia: 1000+ tier transactions year over year, Q2 2026
×
Chart Section12 Transactions
West Virginia: landlord share of transactions, Q2 2026
×
Chart Section12 Prices
West Virginia: transactions by tier this quarter, Q2 2026
×
Chart Section12 Prices Detail
West Virginia: average purchase price by tier, Q2 2026

Licensing & Usage Rights

This report, data, and all visual analyses are the property of BatchData © 2026 BatchService, Inc. and are licensed under Creative Commons Attribution-NonCommercial-NoDerivatives 4.0 International (CC BY-NC-ND 4.0).

You MAY: Download, share, or excerpt this content for personal or non-commercial purposes, provided you give clear attribution to BatchData with a link back to this original page.

You MAY NOT: Use this data commercially, resell or redistribute it as your own, or publish modified versions.

For commercial licensing: batchdata.io/contact-sales

Creative Commons BY-NC-ND 4.0 - creativecommons.org/licenses/by-nc-nd/4.0/

How to cite this report

BatchData. (2026). Q2 2026 WV State Report. BatchService, Inc. Retrieved from https://reports.batchdata.io/investorpulse-reports/2026-q2-state-wv/. Licensed under CC BY-NC-ND 4.0.