United States Investor Pulse Report (2026-Q2)

Real Estate comprehensive investment analysis of investor activity in the United States single-family residential housing market. Discover ownership trends, transaction patterns, and market insights.

Market Overview

Total SFR Properties in United States
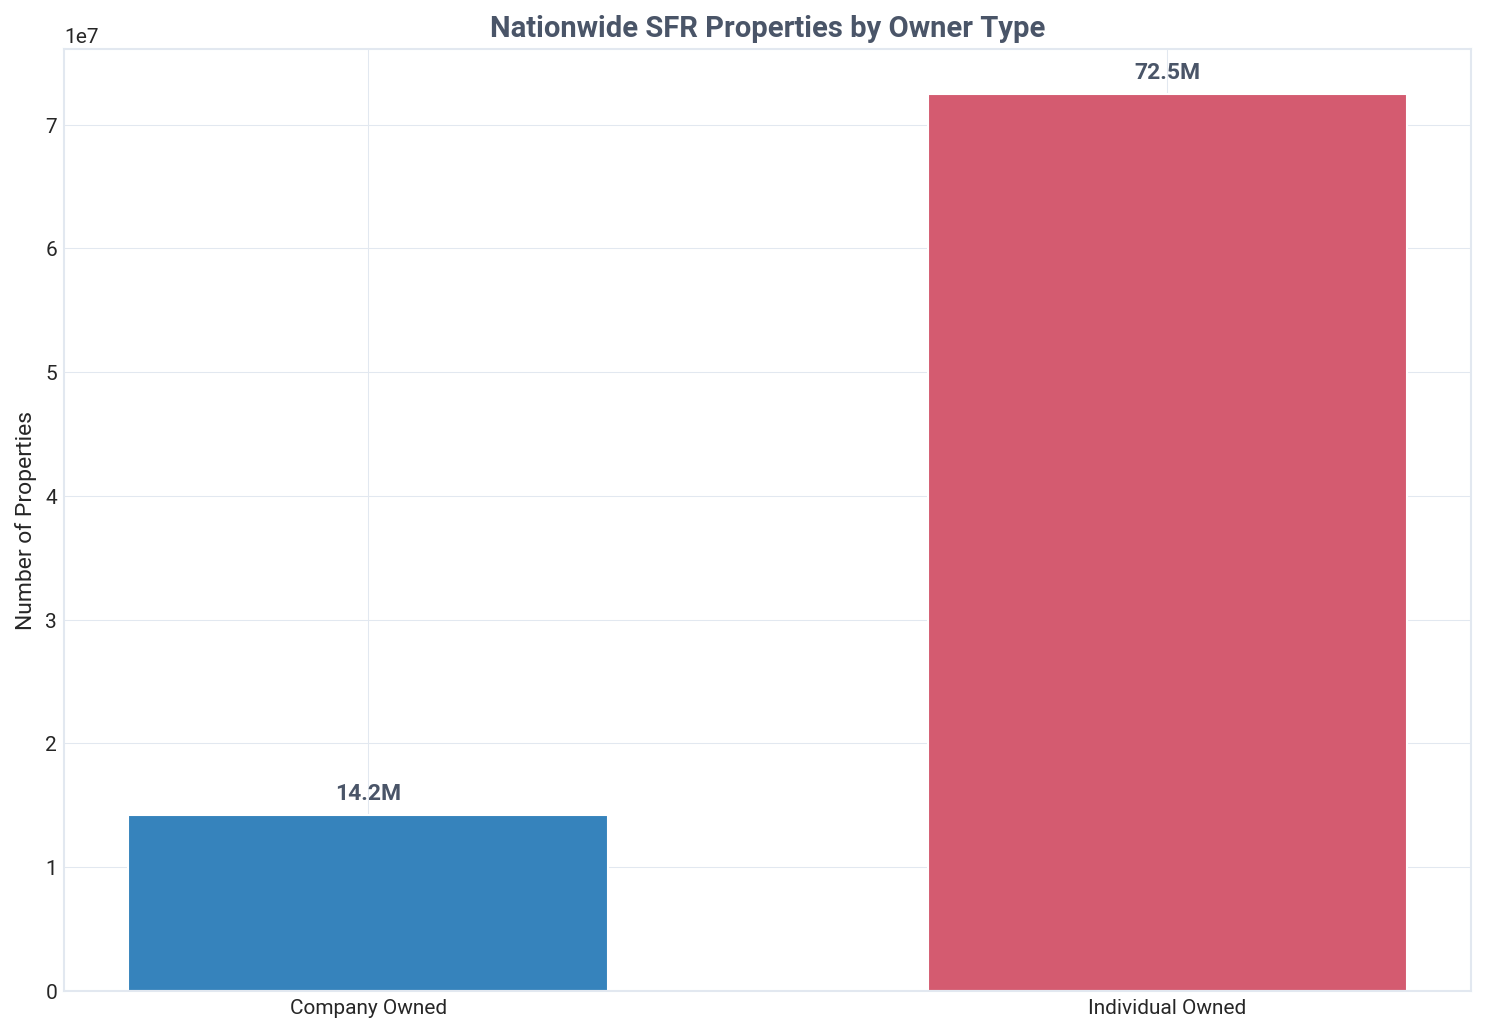
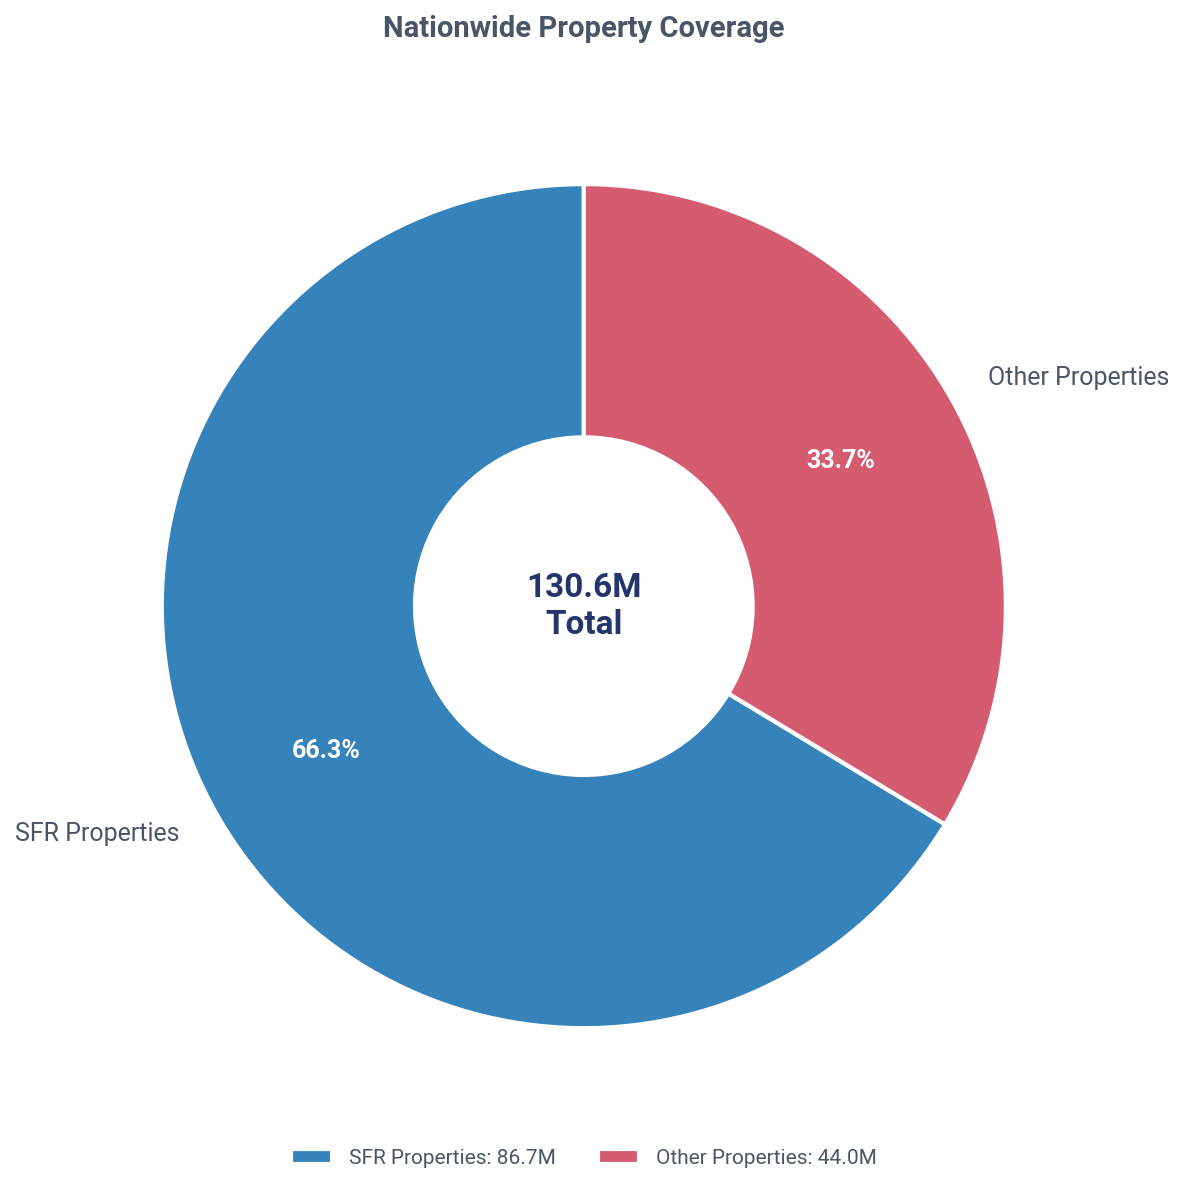
86,670,934
Total Investors in United States
16,762,254
Investor Owned SFR in United States
15,383,022(17.7%)
Individual Landlords
Landlords
14,726,147
SFR Owned
11,793,129
Corporate Landlords
Landlords
2,036,107
SFR Owned
3,986,346
Understanding Property Counts

Distinct Count Methodology: The total 15,383,022 represents distinct properties - if 2+ landlords co-own the same property, it's counted only once. This provides the most accurate representation of investor-owned SFR properties.

Why totals don't sum: When broken down by Individual vs Corporate ownership (or by tier), properties with co-ownership across categories are counted once per category. For example, if a property is co-owned by an individual AND a corporate landlord, it appears in both counts. This is why Individual + Corporate totals may exceed the distinct total by 2-4%, and percentages may sum to 100-104%.

Market Visualization

United States: SFR vs other property coverage, Q2 2026
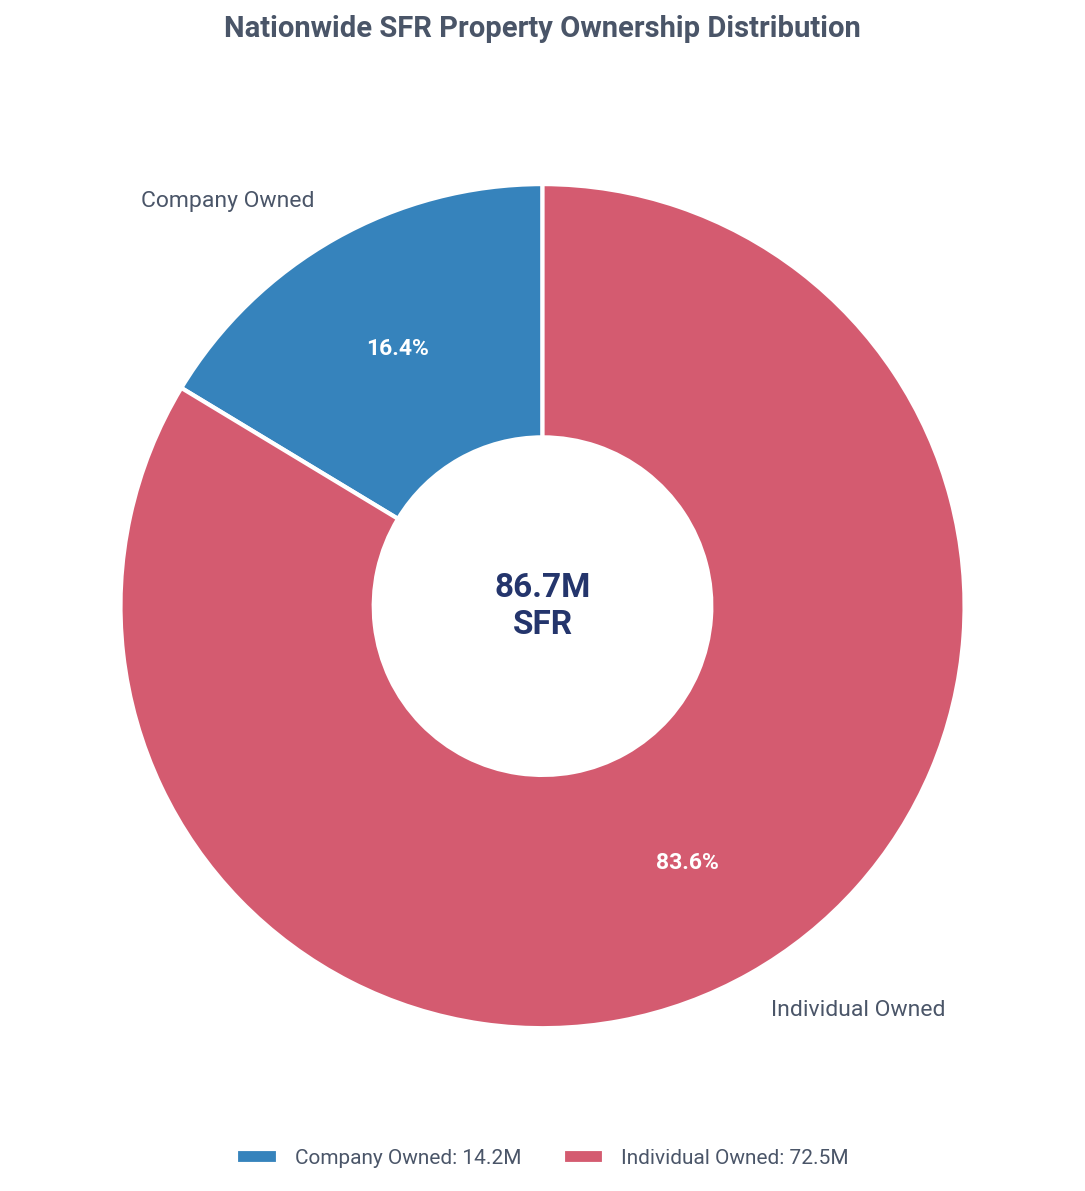
United States: SFR ownership share, company vs individual, Q2 2026
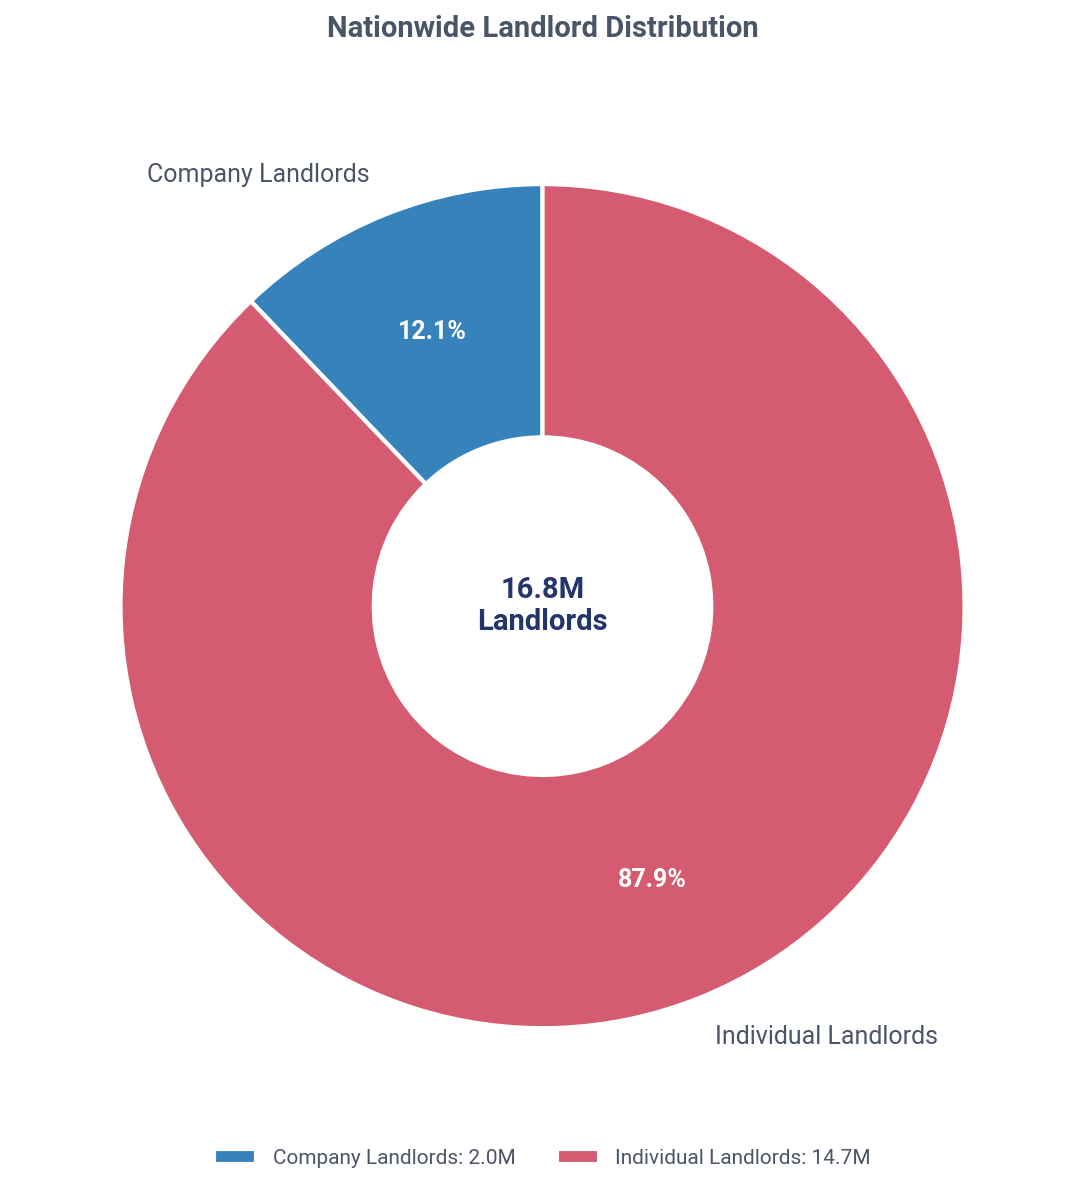
United States: company vs individual landlords, Q2 2026

Key Market Insights

Mom-and-Pop Landlords Dominate 91% of SFR Market as Institutions Retreat as Net Sellers
Investors own 15,383,022 SFR properties nationwide, 17.7% of the total market, with small 'mom-and-pop' landlords controlling 90.9% of that portfolio. In Q2 2026, landlords were net buyers, acquiring 22.7% of all homes sold at an 8.2% discount compared to homeowners. This activity was driven by small investors, as large institutional firms were net sellers, divesting more properties than they acquired.
Landlord Owned Current Holdings
Investors own 15.4M SFRs, with individuals controlling 76.7% of the portfolio.
Nationwide, 66.1% of investor-owned properties are held free-and-clear (10,163,445 cash properties) versus 33.9% that are financed (5,219,577 properties). There are 16,762,254 total landlords, with individuals comprising 87.8% of all landlord entities.
Landlord vs Traditional Homeowners
Landlords paid 8.2% less than homeowners in Q2 2026, an average discount of $42,215.
The price gap between landlords and homeowners has widened significantly, growing from a 2.1% discount in Q3 2025 to 8.2% in Q2 2026. Landlord acquisition prices have appreciated 18.2% from the 2020-2023 average of $400,599 to $473,673 in the current quarter.
Current Quarter Purchases
Landlords purchased 22.7% of all single-family homes sold nationwide in Q2 2026.
Mom-and-pop landlords (1-10 properties) drove this activity, accounting for 86.9% of all investor purchases. In contrast, institutional investors (1000+ properties) made up just 2.2% of landlord acquisitions.
Ownership by Tier
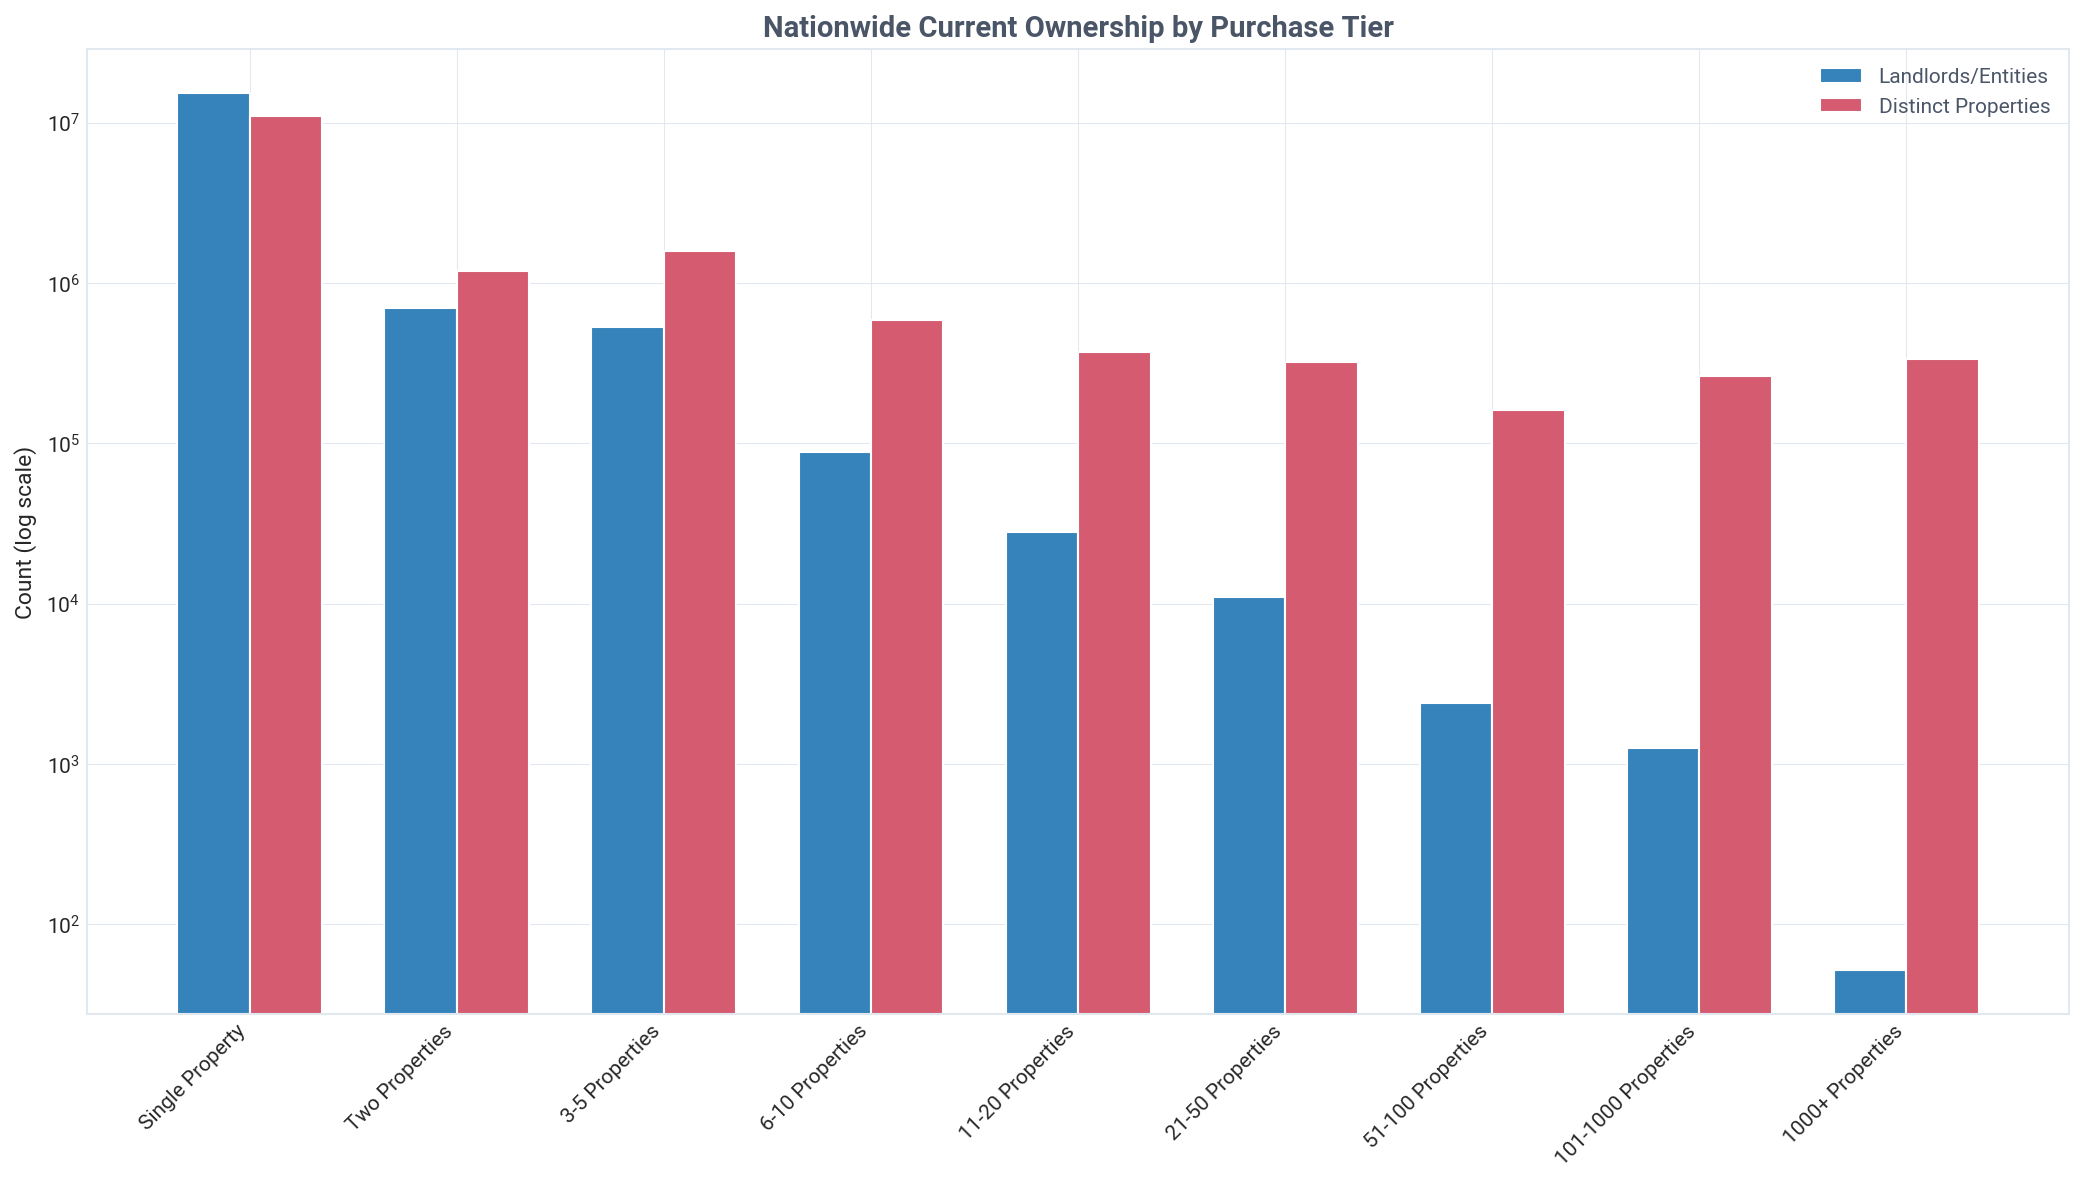
Mom-and-pop landlords (1-10 properties) control 90.9% of all investor-owned SFRs nationwide.
Institutional investors (1000+ properties) own just 2.1% of the national investor-owned housing stock, or 337,238 properties. Single-property landlords alone make up the largest segment, controlling 69.7% of all investor-held SFRs.
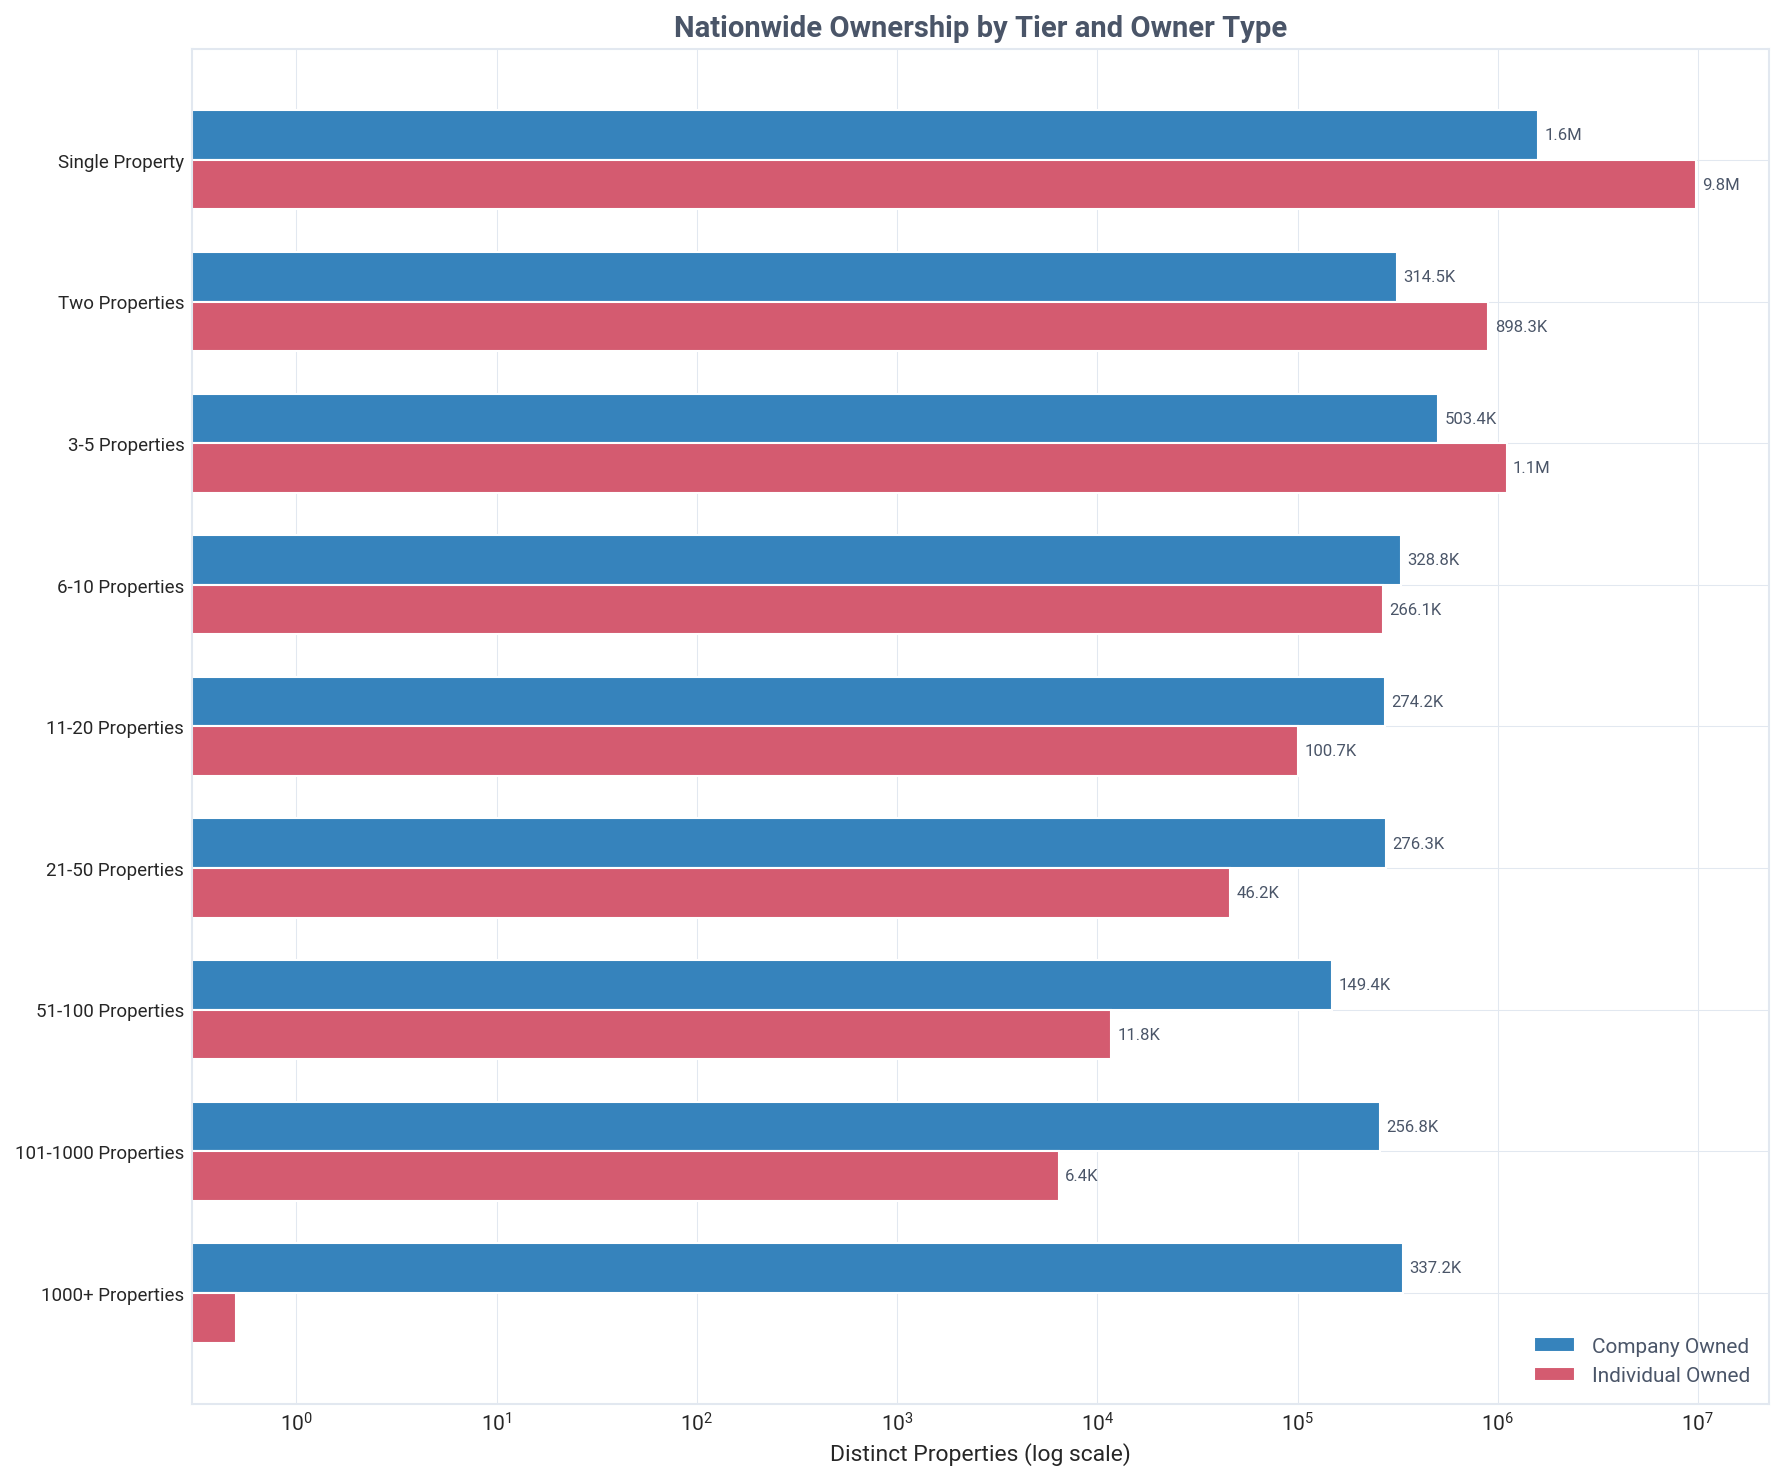
Ownership by Tier & Type
The typical crossover point occurs at 6-10 properties, where companies own 55.3% of homes.
Individuals dominate smaller portfolios, owning 86.0% of single-property holdings. Companies control the largest tiers, owning 97.6% of properties in the 101-1,000 tier.
Geographic Distribution
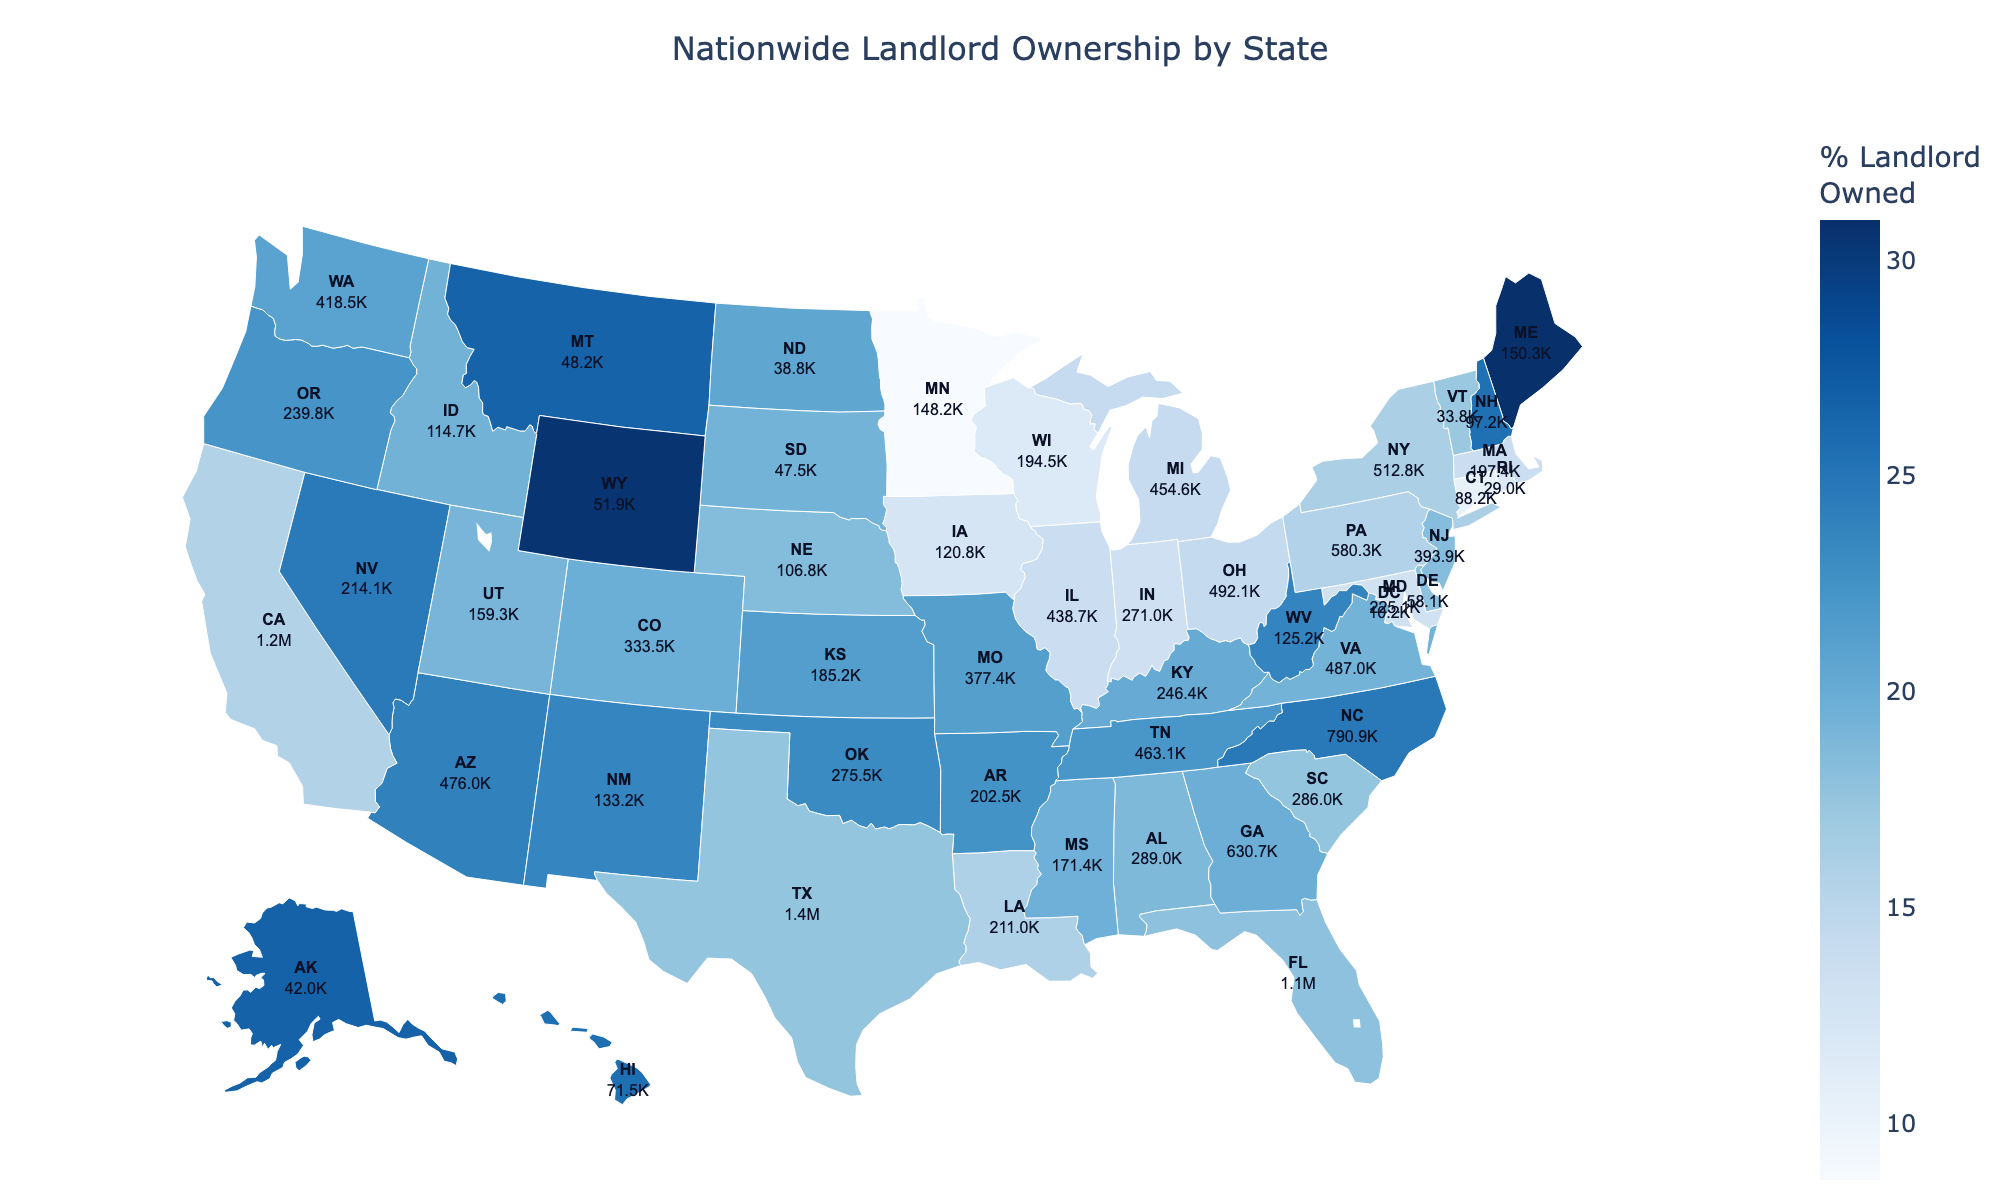
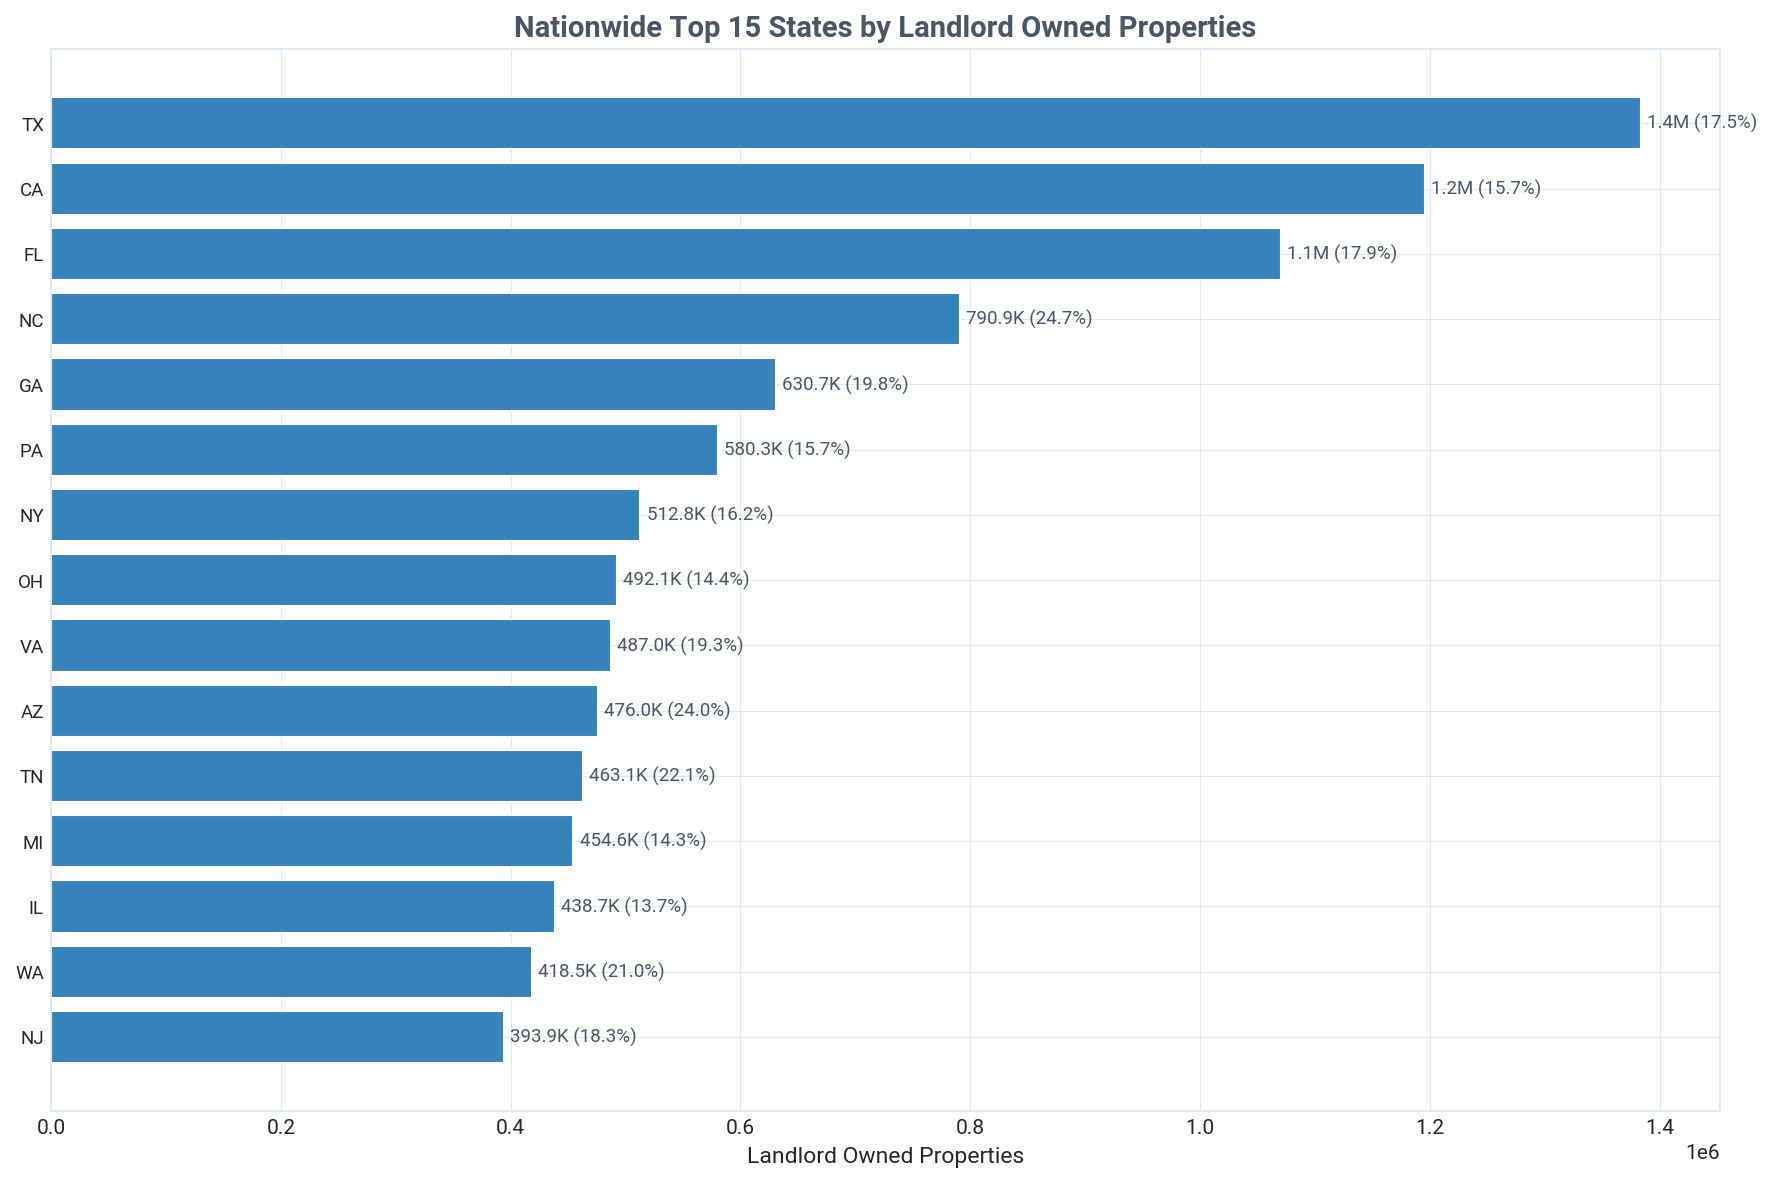
Texas, California, and Florida are the top 3 states for investor-owned property counts.
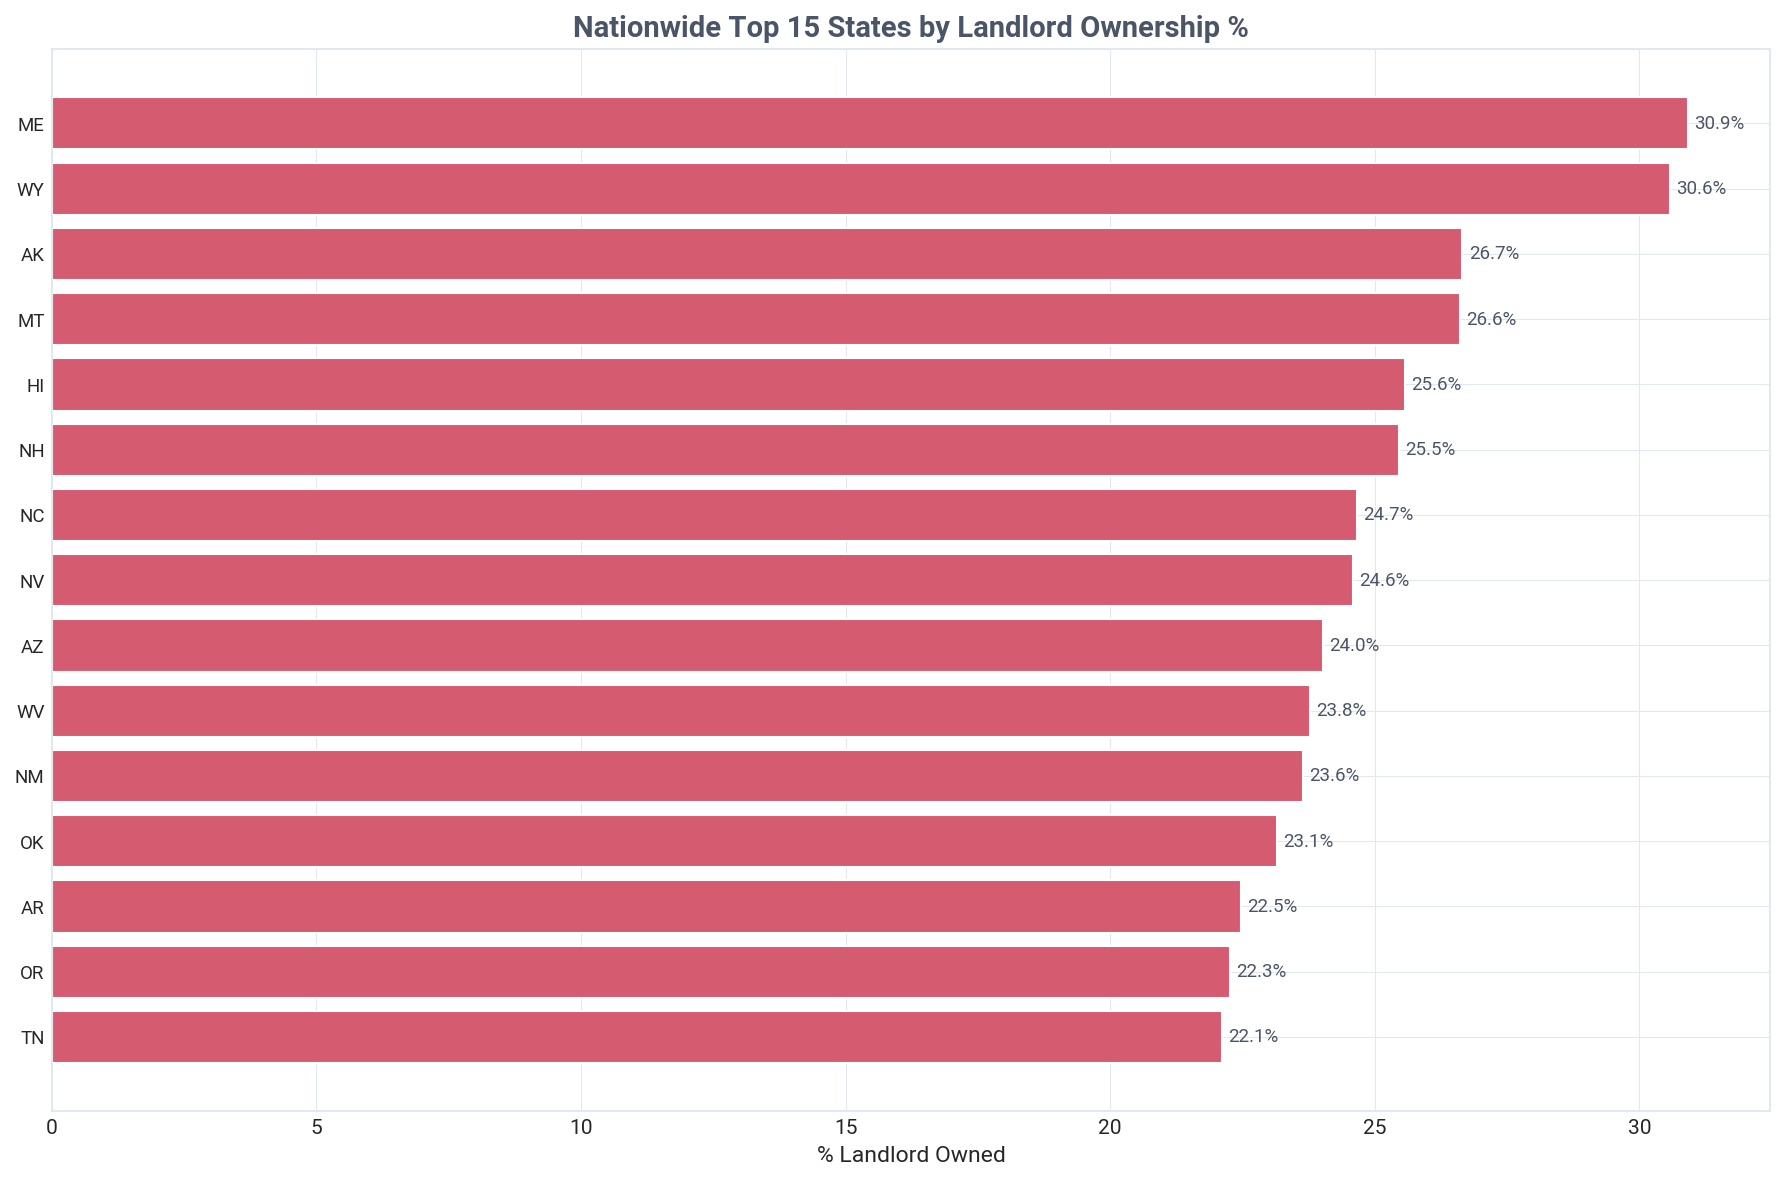
Texas leads with 1,383,569 investor-owned properties, followed by California (1,195,773) and Florida (1,070,206). However, Maine (30.9%), Wyoming (30.6%), and Alaska (26.7%) have the highest investor ownership rates.
Historical Transactions
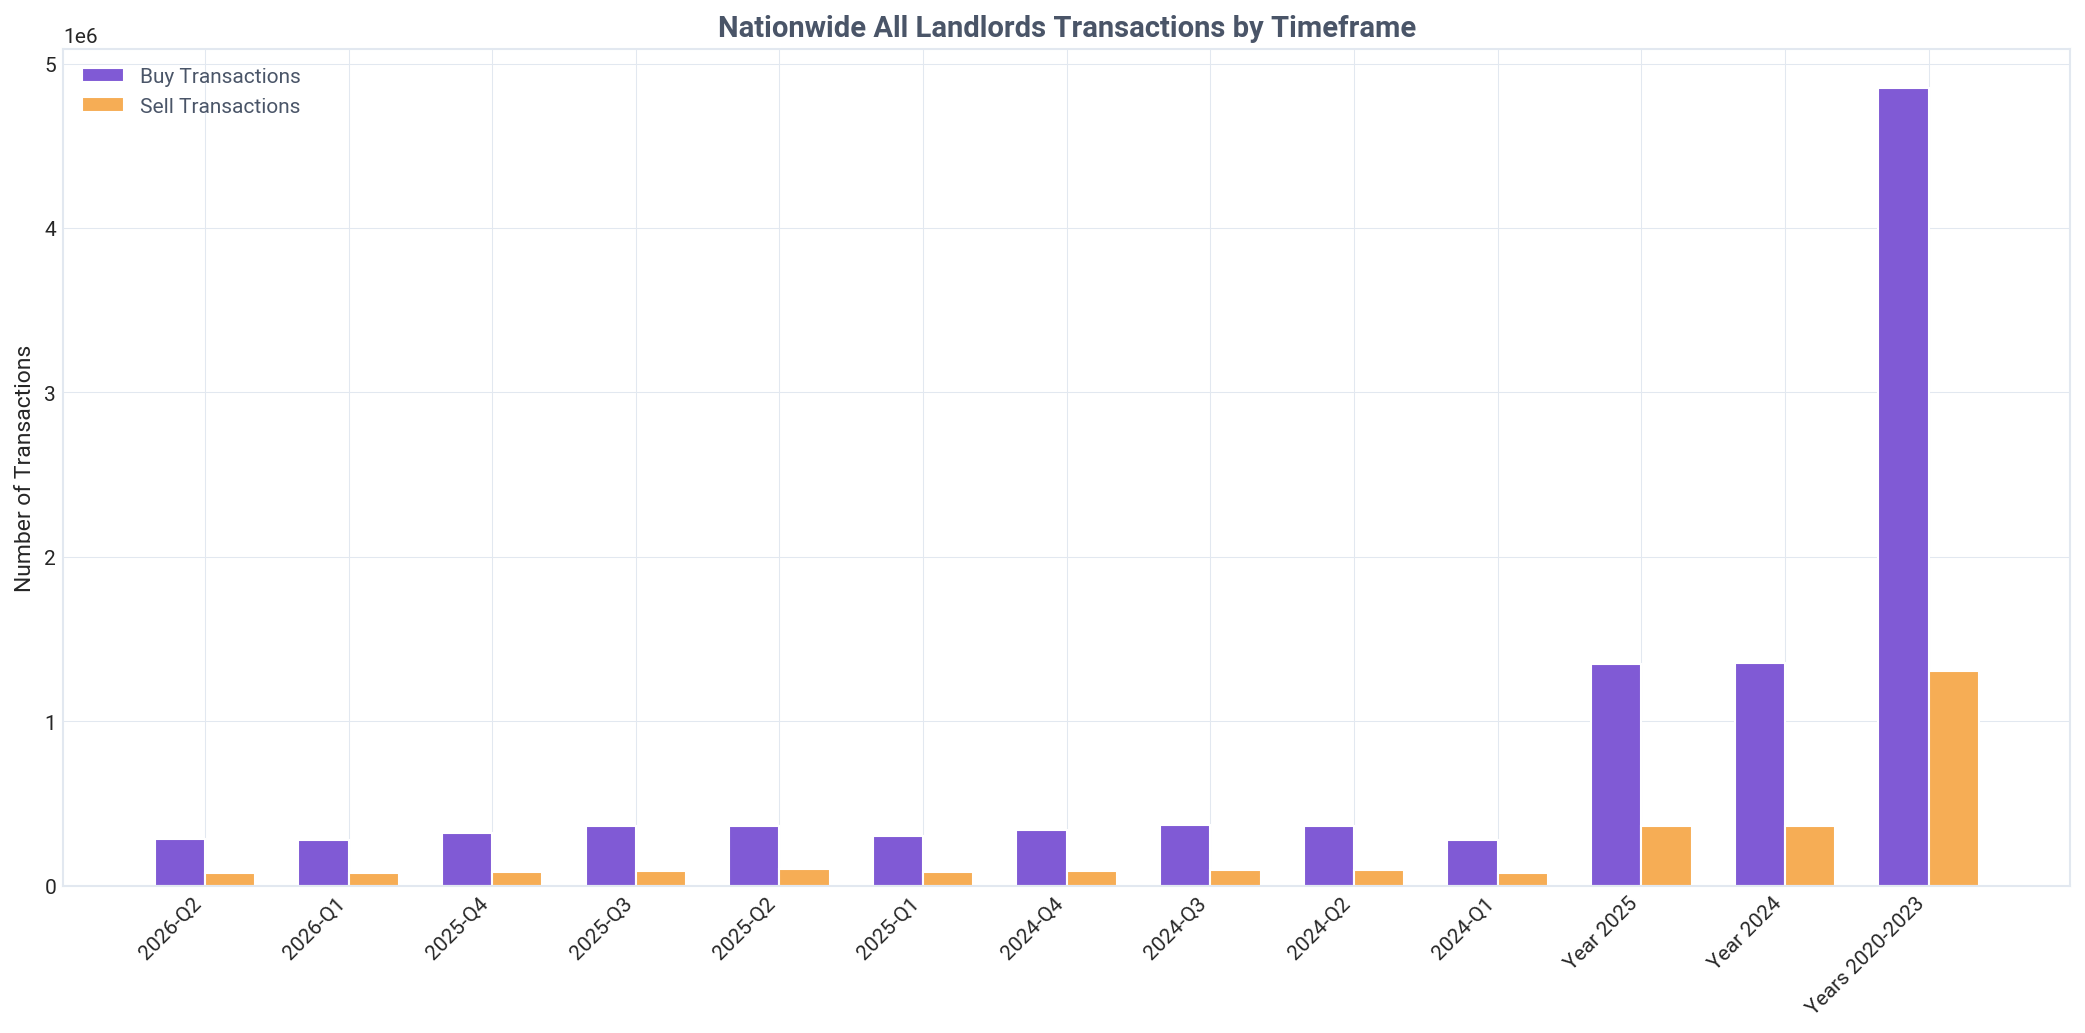
Landlords remain strong net buyers, but institutional investors are net sellers.
In Q2 2026, landlords nationwide were net buyers, acquiring 205,452 more properties than they sold (284,068 buys vs. 78,616 sells). In contrast, institutional investors (1000+ tier) were net sellers, divesting 1,737 more properties than they bought (5,430 buys vs. 7,167 sells).
Current Quarter Transactions
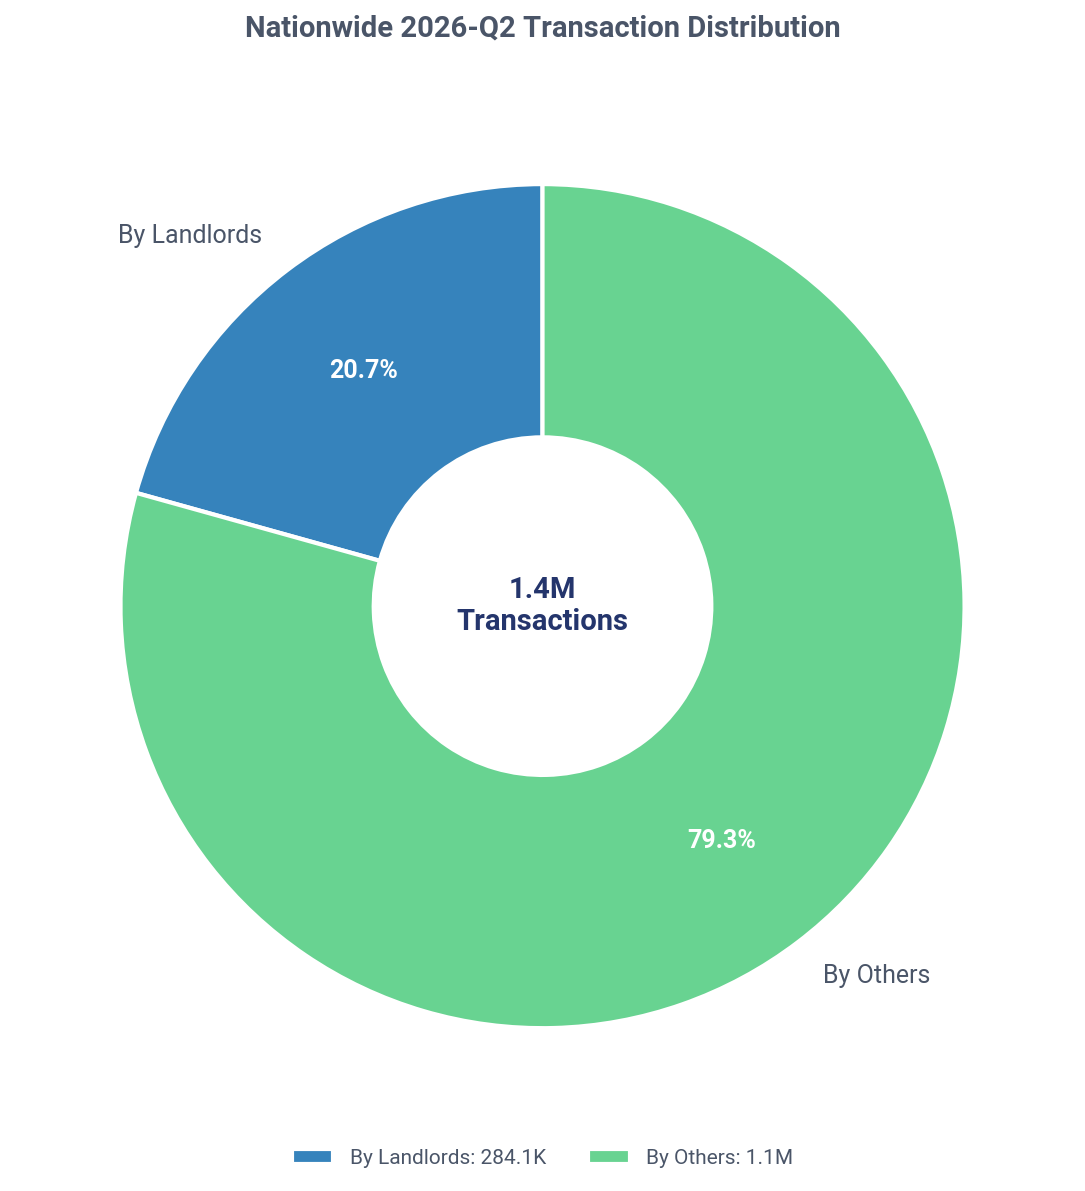
Landlords participated in 20.7% of all housing transactions in Q2 2026.
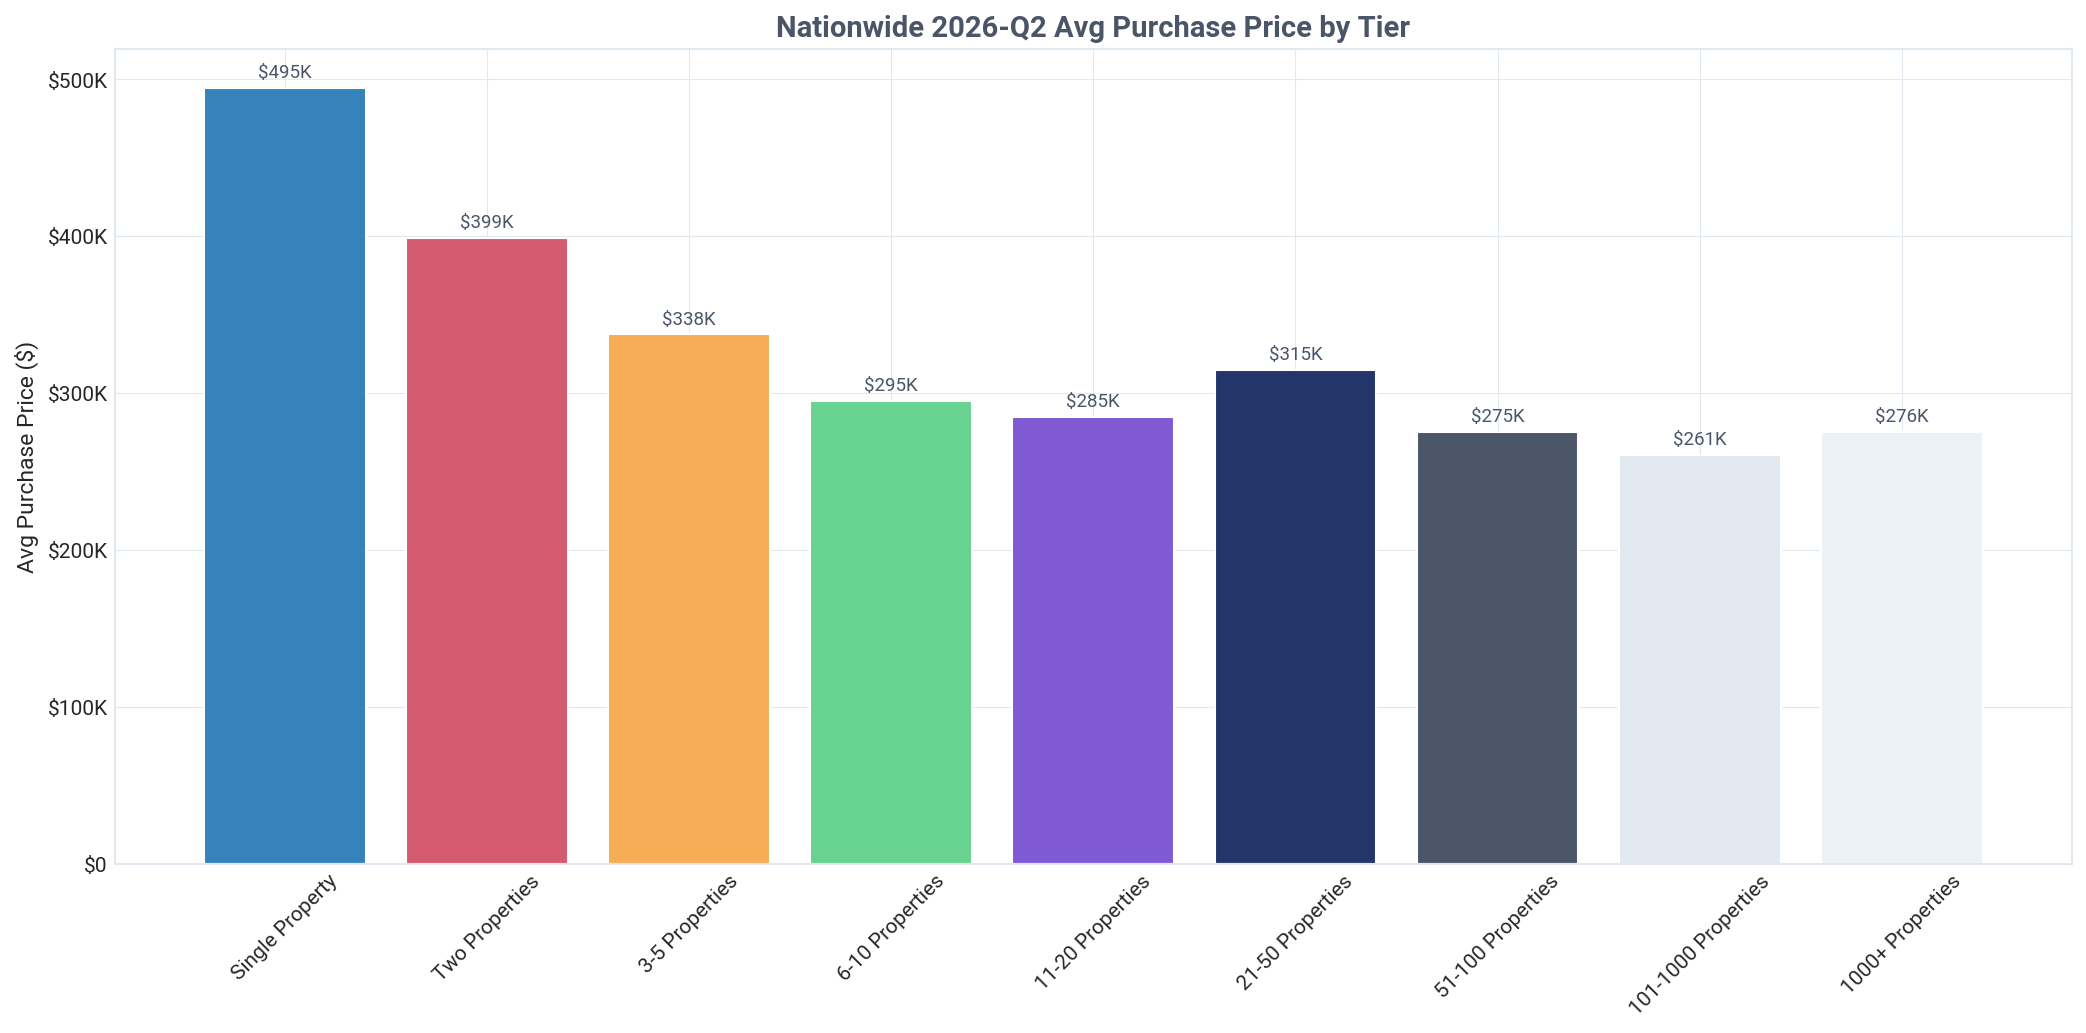
In Q2 2026, institutional buyers paid 44.3% less than new mom-and-pop landlords ($275,526 vs. $494,715). Institutions were also far more likely to buy from other landlords (45.2% of acquisitions) compared to single-property investors (9.1%).

Want deeper insights tailored to your investment strategy?

TALK TO AN EXPERT

Current Holdings Portfolio

Analysis of landlord property holdings by type, financing method, and owner category

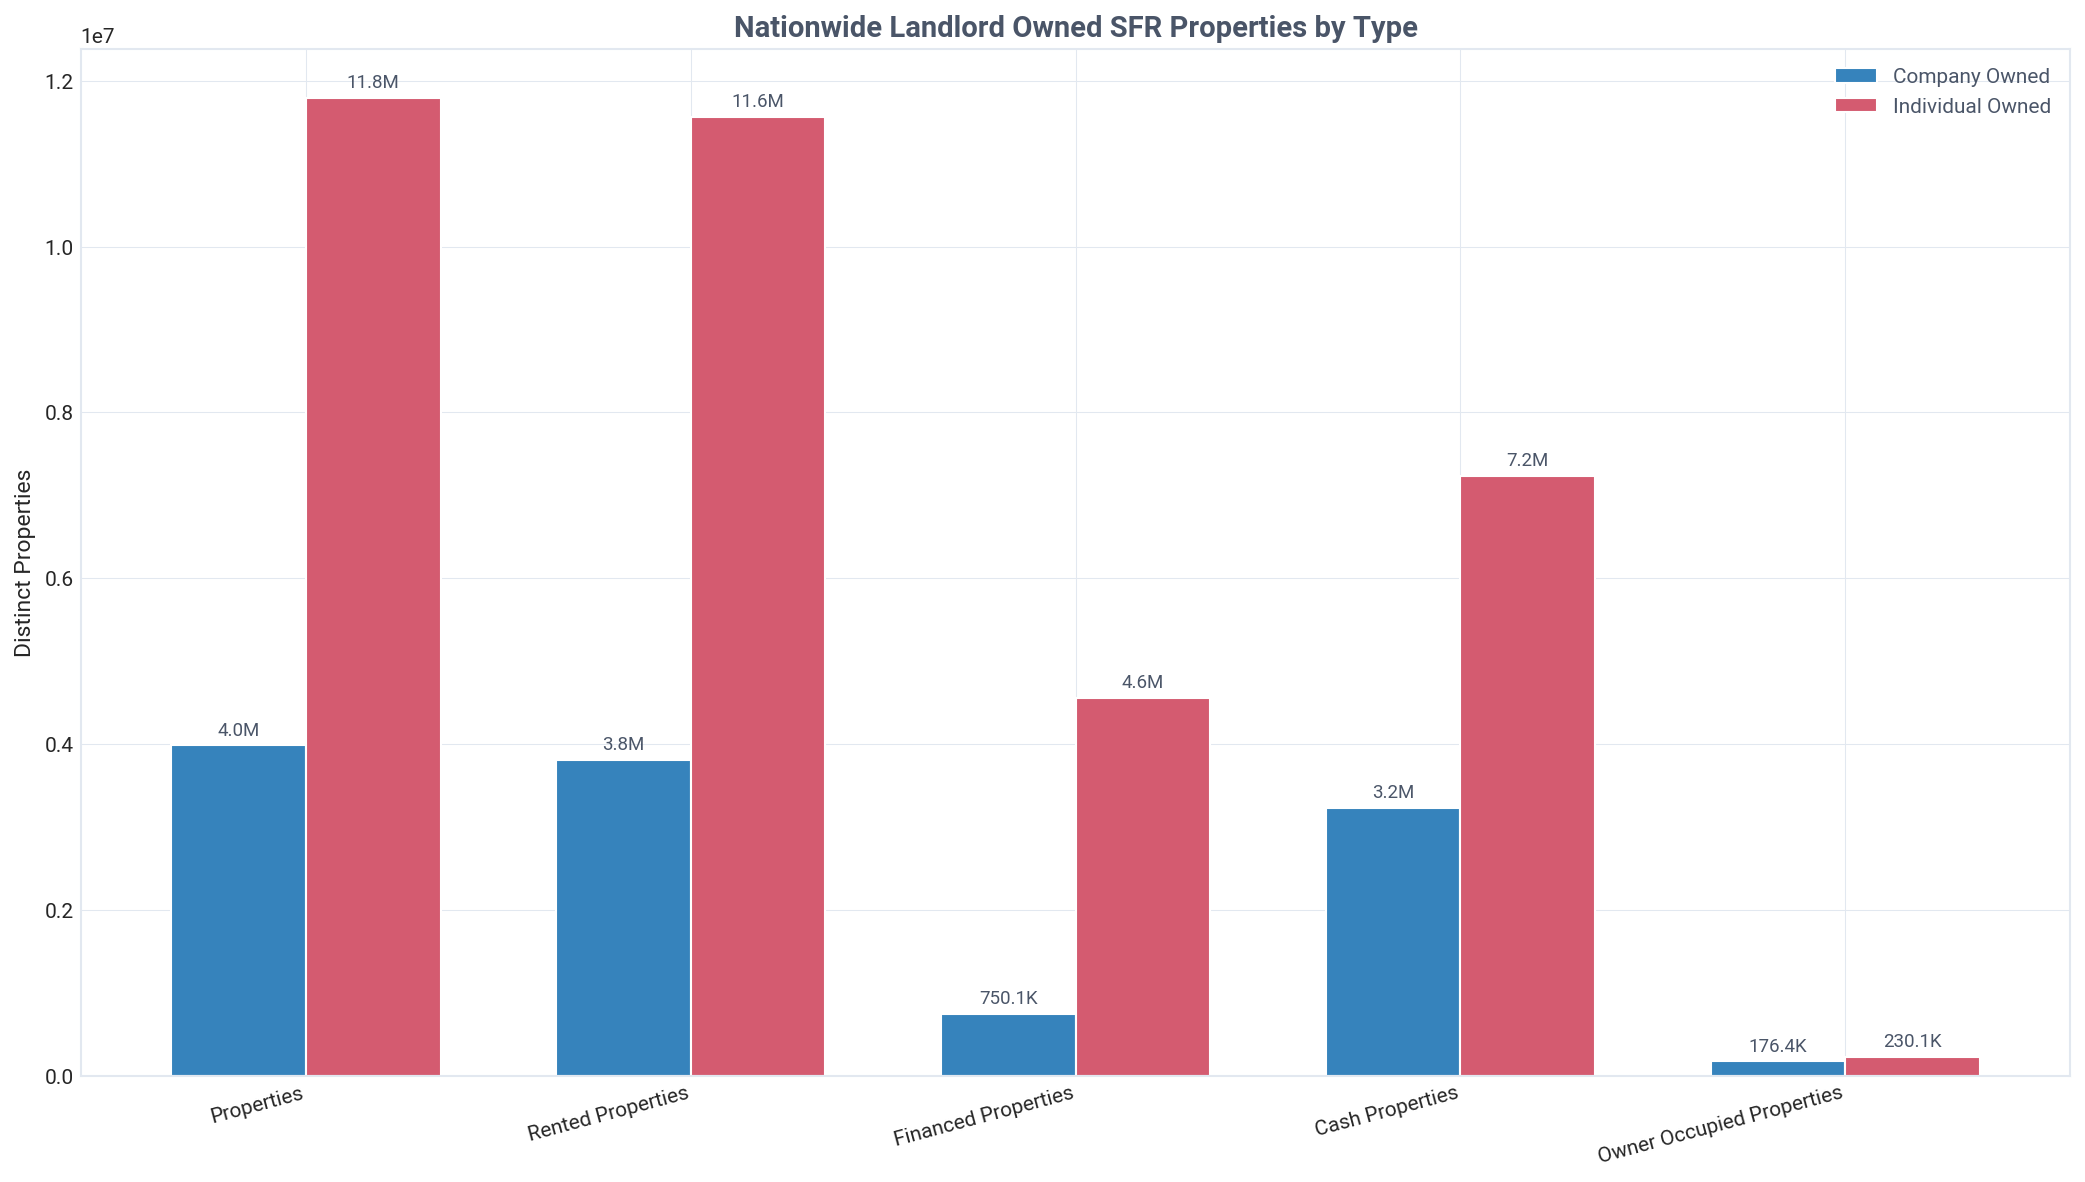
United States: landlord SFR holdings by type, Q2 2026
Key Insight
Investors own 15.4M SFRs, with individuals controlling 76.7% of the portfolio.
Detailed Findings

Across the United States, investors hold a significant portfolio of 15,383,022 single-family residential properties, making up 17.7% of the total 86,670,934 SFRs in the market. This demonstrates the substantial role private real estate investing plays in the national housing landscape.

Individual investors are the primary force in the rental market, owning 11,793,129 properties, or 76.7% of the total investor-owned stock. In contrast, company-owned properties number 3,986,346, representing a 25.9% share. This 3-to-1 ratio underscores the market's reliance on smaller, non-corporate landlords.

By entity count, the dominance of individual landlords is even more pronounced. Of the 16,762,254 distinct landlord entities, 14,726,147 are individuals (87.8%), while only 2,036,107 are companies (12.2%). This indicates that the average company portfolio is significantly larger than the average individual's.

A strong majority of investor-owned properties are held free-and-clear, with 10,163,445 properties owned with cash compared to 5,219,577 that are financed. This 66.1% cash ownership rate suggests that many investors are either well-capitalized or have held their properties long enough to pay off any associated mortgage transaction data.

The portfolio is overwhelmingly focused on rental income, with 14,979,110 properties classified as rented. This massive rental stock, supported by detailed assessor data, is a critical component of the nation's housing supply for non-homeowners.
Acquisition Timing & Pricing

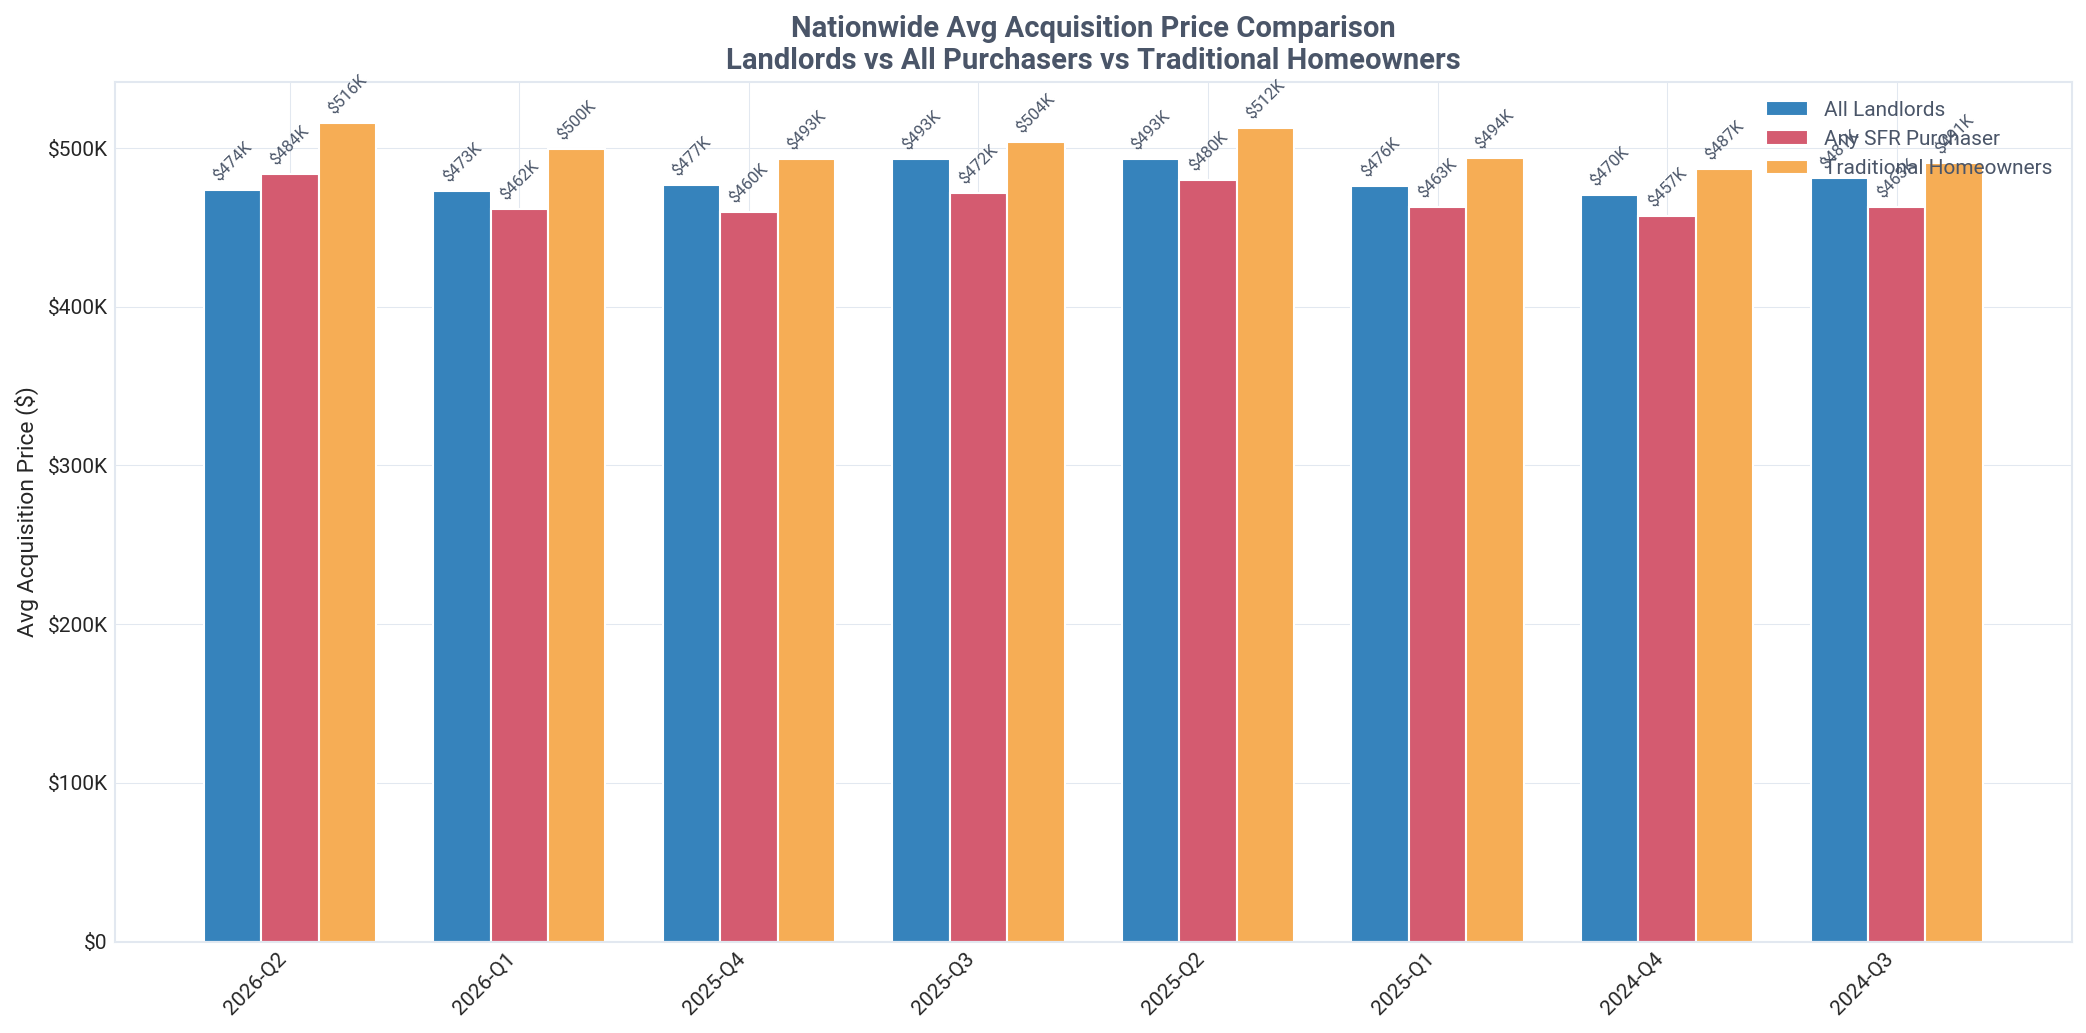
Comparison of acquisition prices between landlords and traditional homeowners

Key Insight
Landlords paid 8.2% less than homeowners in Q2 2026, an average discount of $42,215.
Detailed Findings

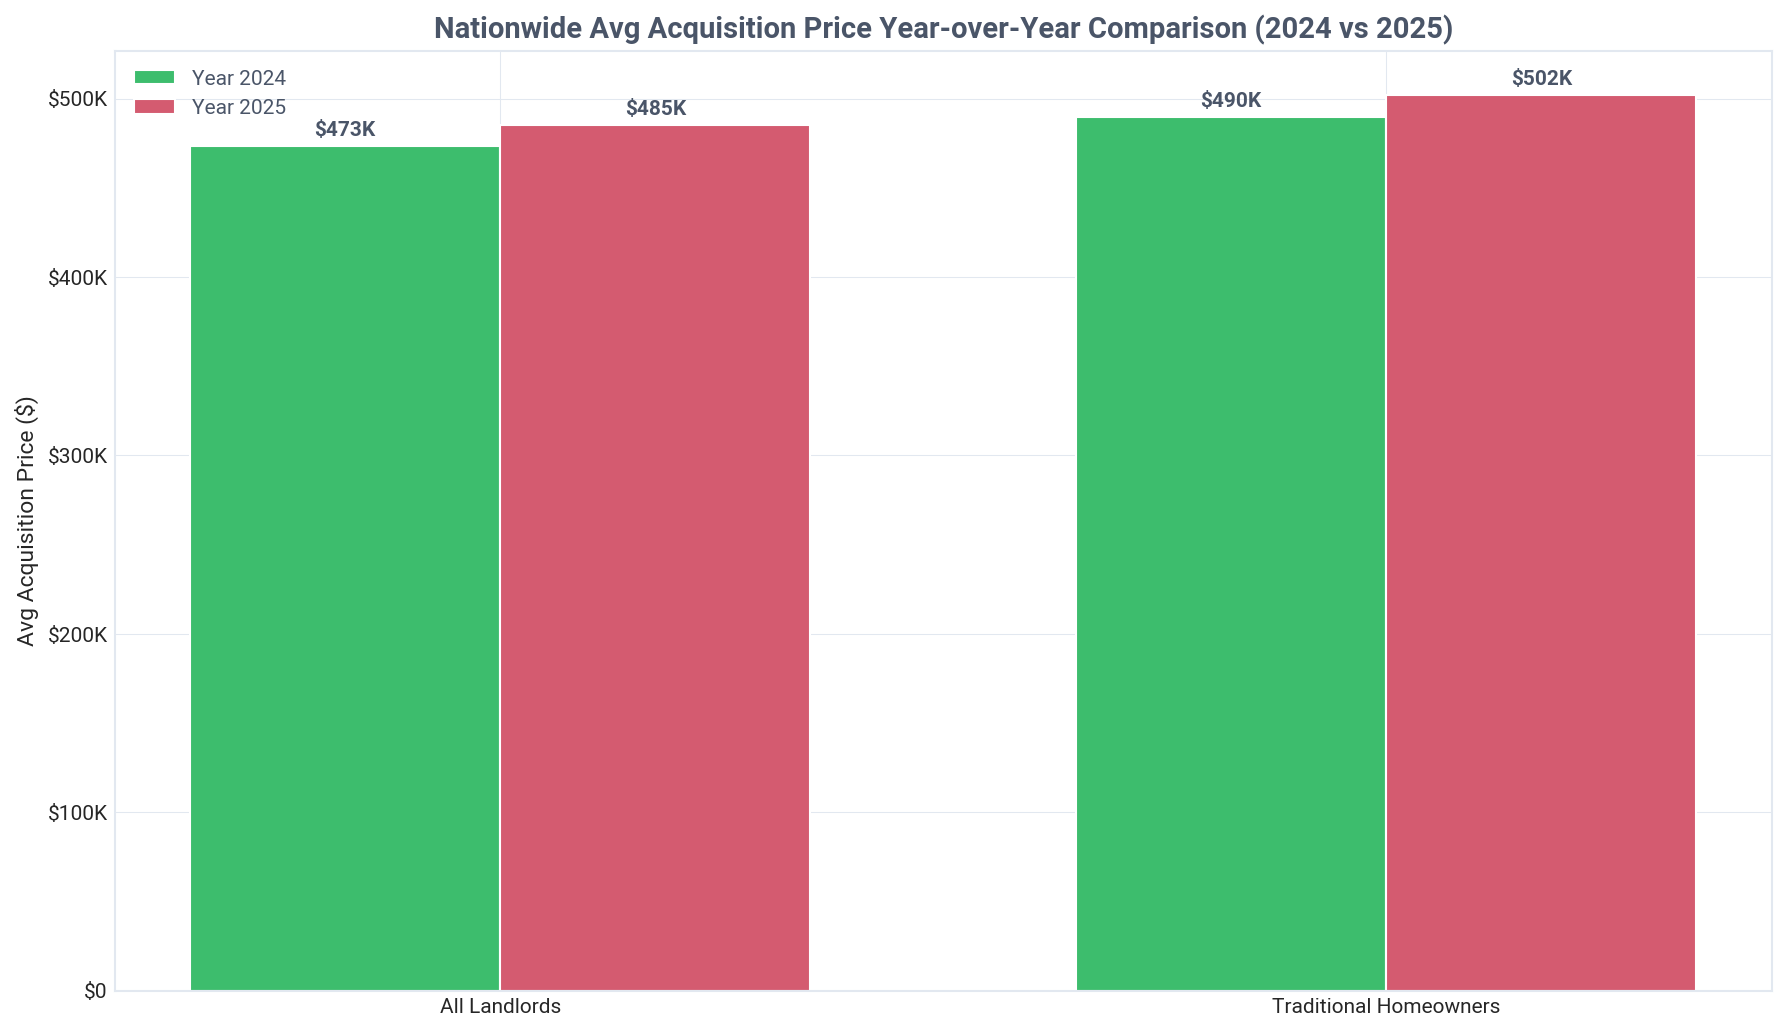
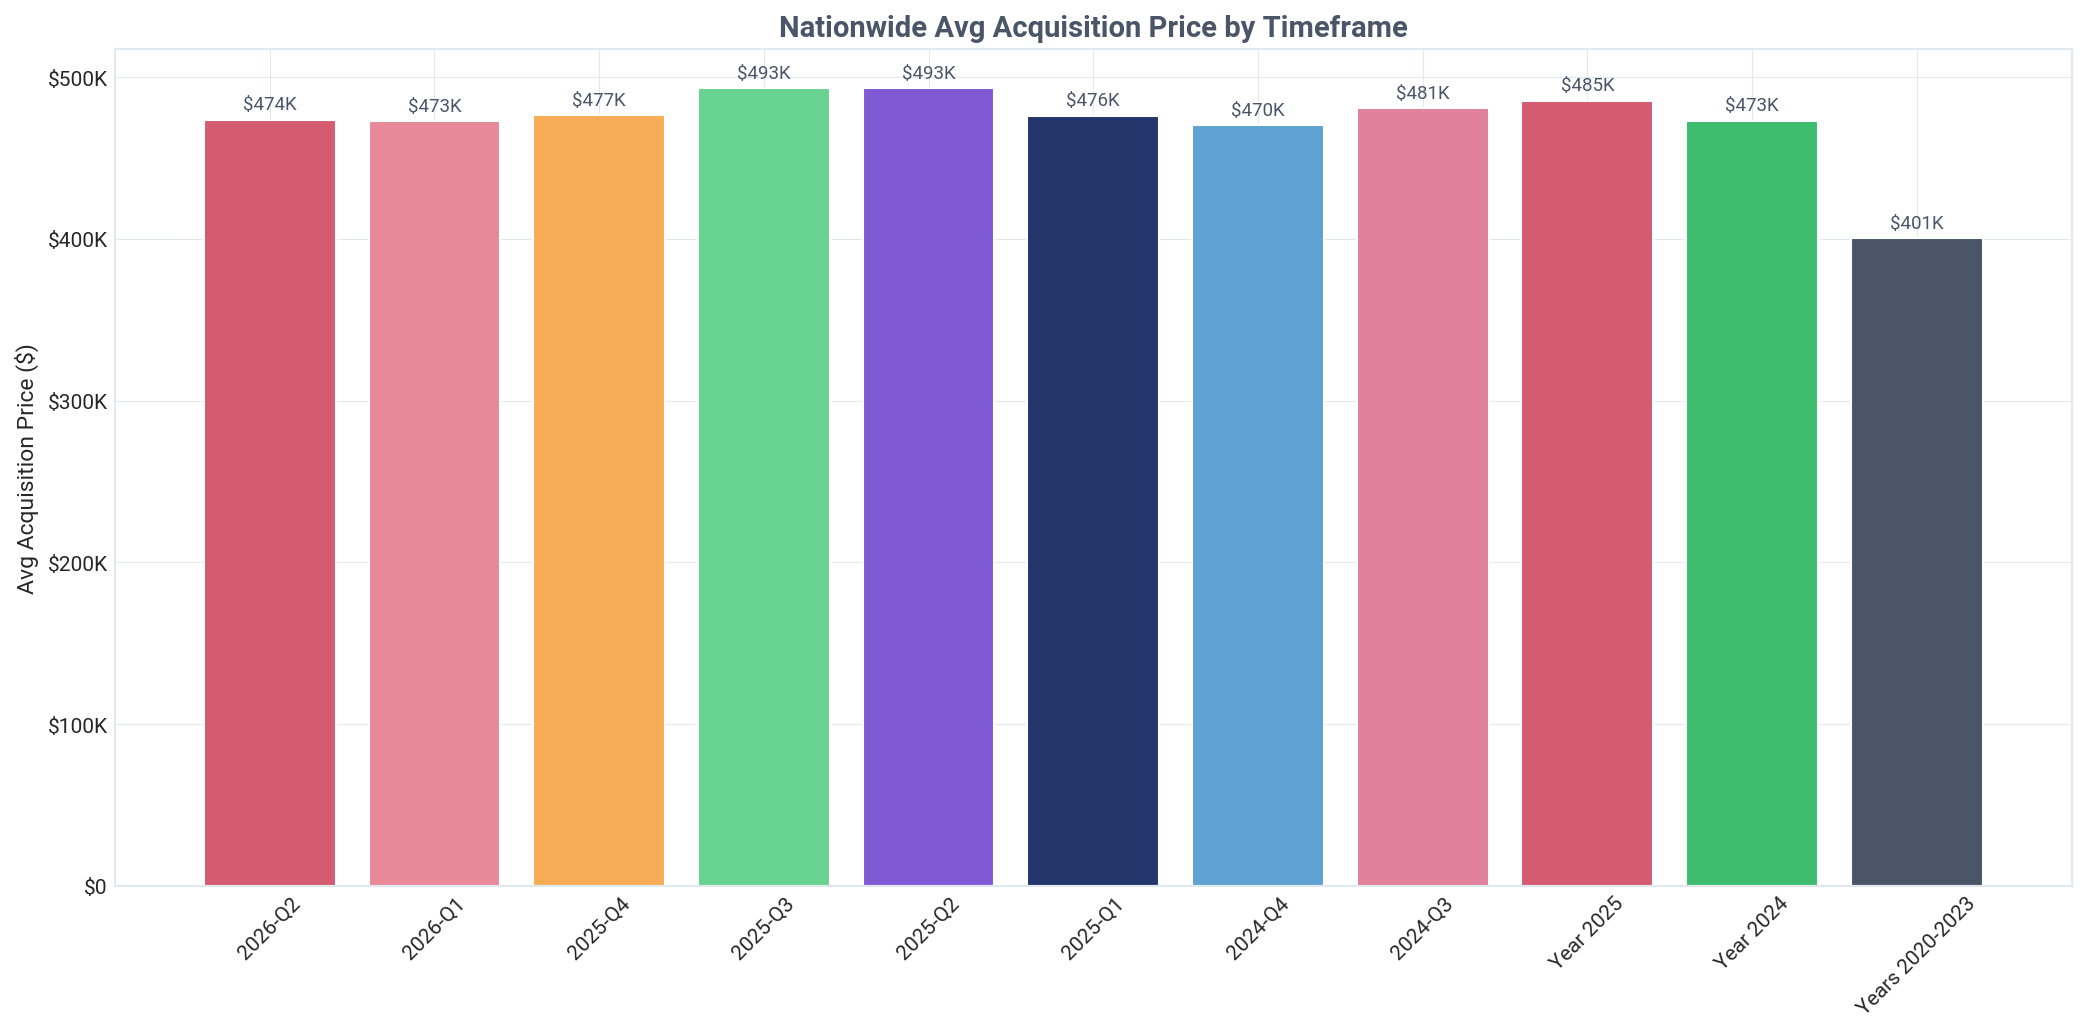
In Q2 2026, landlords demonstrated a distinct pricing advantage, acquiring properties for an average of $473,673, which is 8.2% less than the $515,888 paid by traditional homeowners. This translated to a substantial cash discount of $42,215 per property, a key factor in investor profitability models that often rely on automated valuation (AVM) tools to identify undervalued assets.

The discount investors achieve has been expanding, indicating a growing divergence in purchasing strategy. The gap widened from just 2.1% ($10,661) in Q3 2025 to 3.4% in Q4 2025, 5.4% in Q1 2026, and finally to its current 8.2% level in Q2 2026. This trend suggests investors are becoming more effective at sourcing off-market deals or negotiating better terms.

Acquisition prices have risen steadily since the pandemic era. The average price in Q2 2026 ($473,673) represents an 18.2% increase over the average price of $400,599 seen between 2020 and 2023. This reflects broad market appreciation but also shows that investors are adapting to a higher-cost environment.

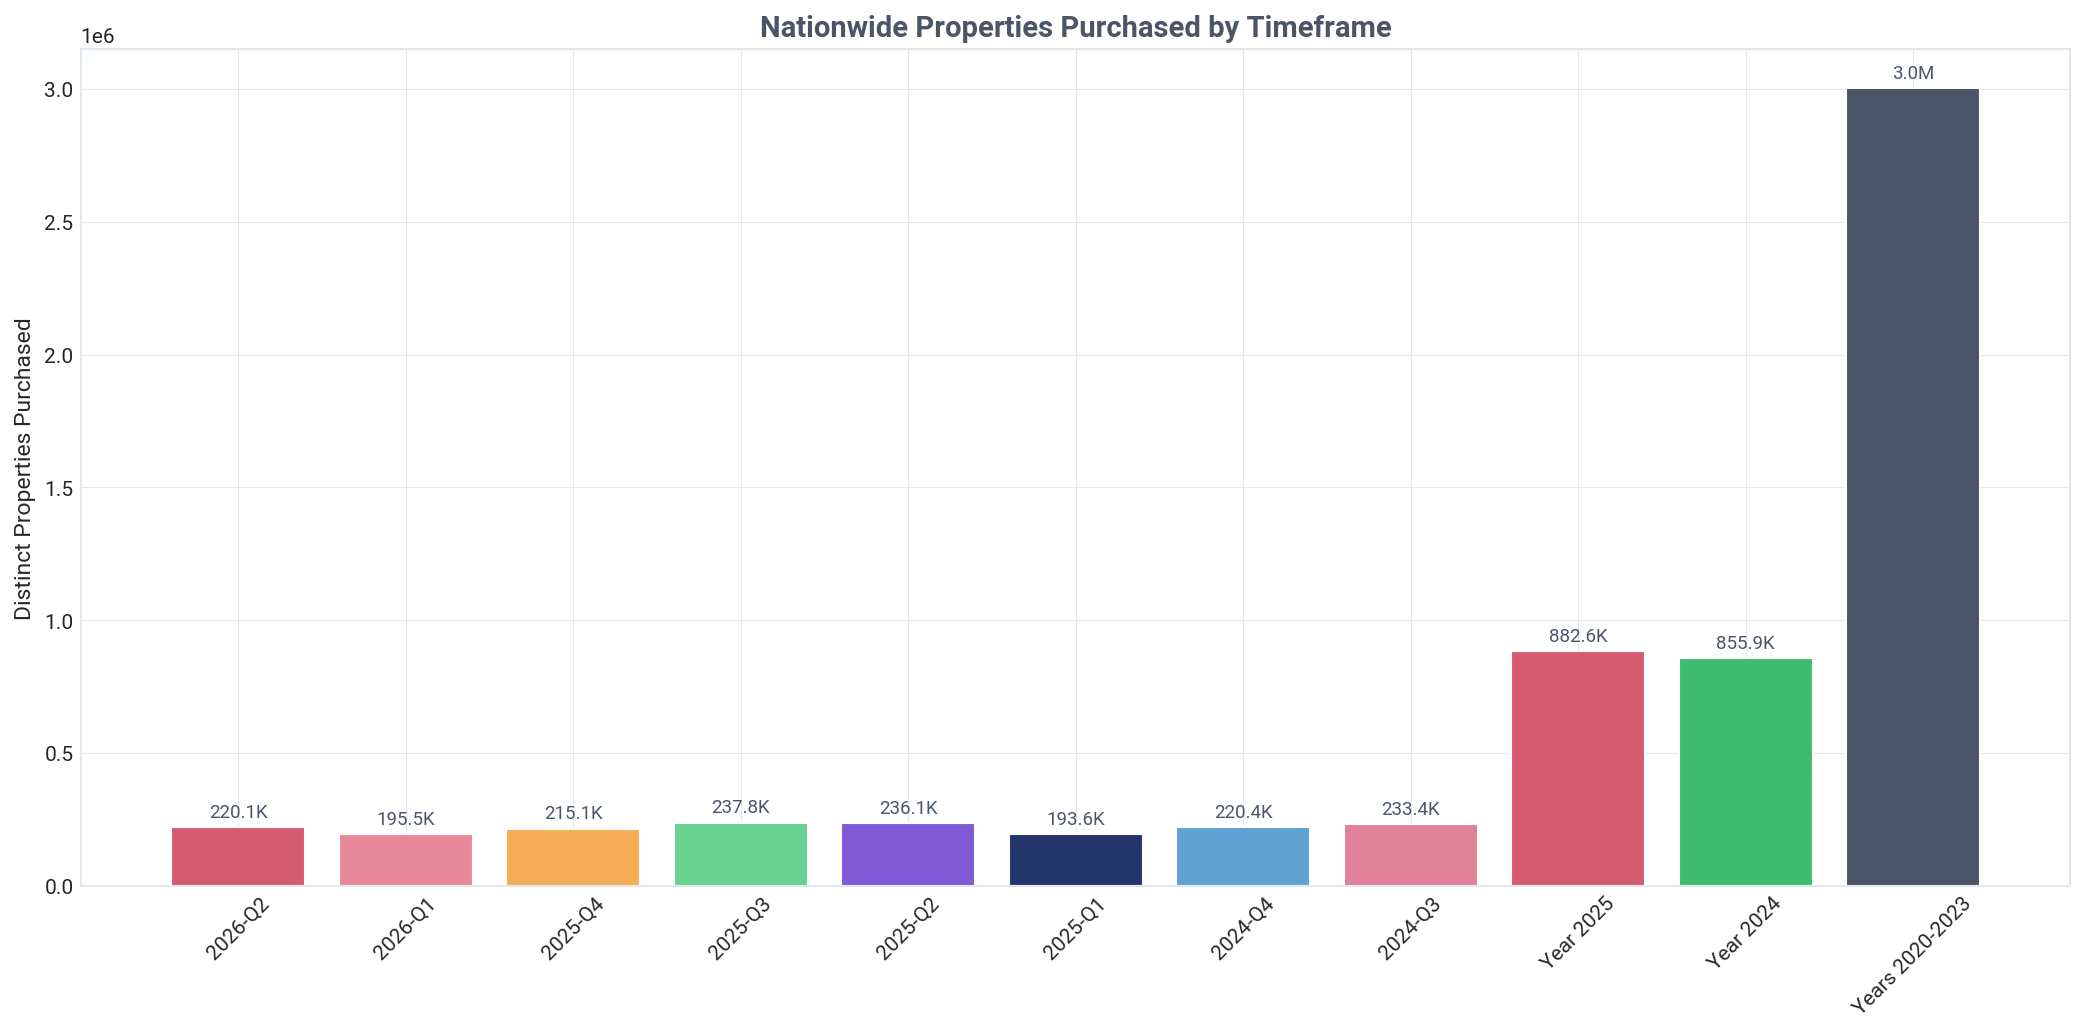
Investor purchasing velocity has remained robust, though slightly down from 2025 highs. Landlords acquired 220,102 properties in Q2 2026, following 195,511 in Q1 2026. This is comparable to the activity in 2025, where quarterly acquisitions ranged from 215,119 to 237,798.

The all-time average acquisition price for the entire 15.4 million property portfolio is $332,562. Comparing this to the Q2 2026 price of $473,673 highlights the significant equity growth investors have realized over the long term, a key finding in many Investor Pulse reports.

United States: properties purchased by timeframe, Q2 2026
United States: average acquisition price by timeframe, Q2 2026
United States: average acquisition price by buyer type, Q2 2026
United States: average acquisition price year over year, Q2 2026

Current Quarter Purchase Summary

Analysis of Q2 2026 purchase activity by investor tier and type

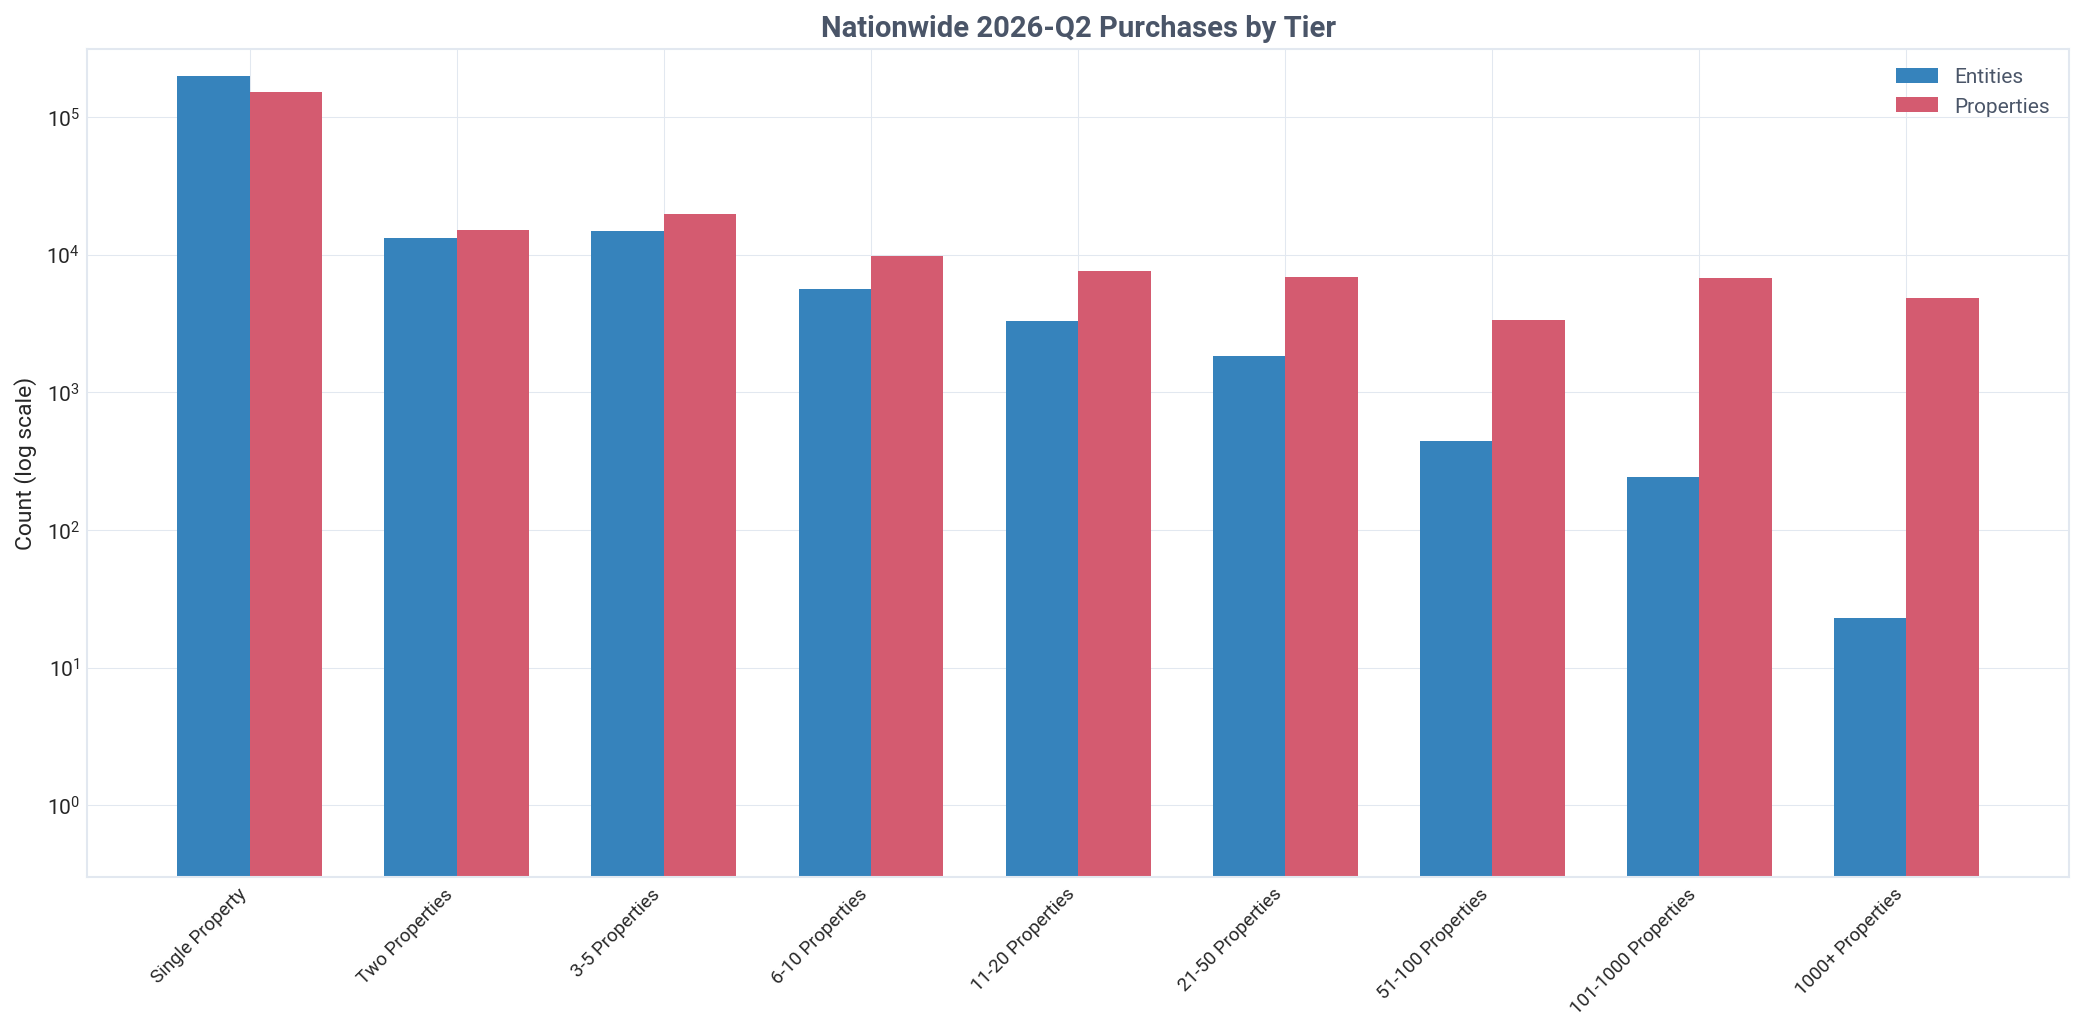
United States: purchases by tier, Q2 2026
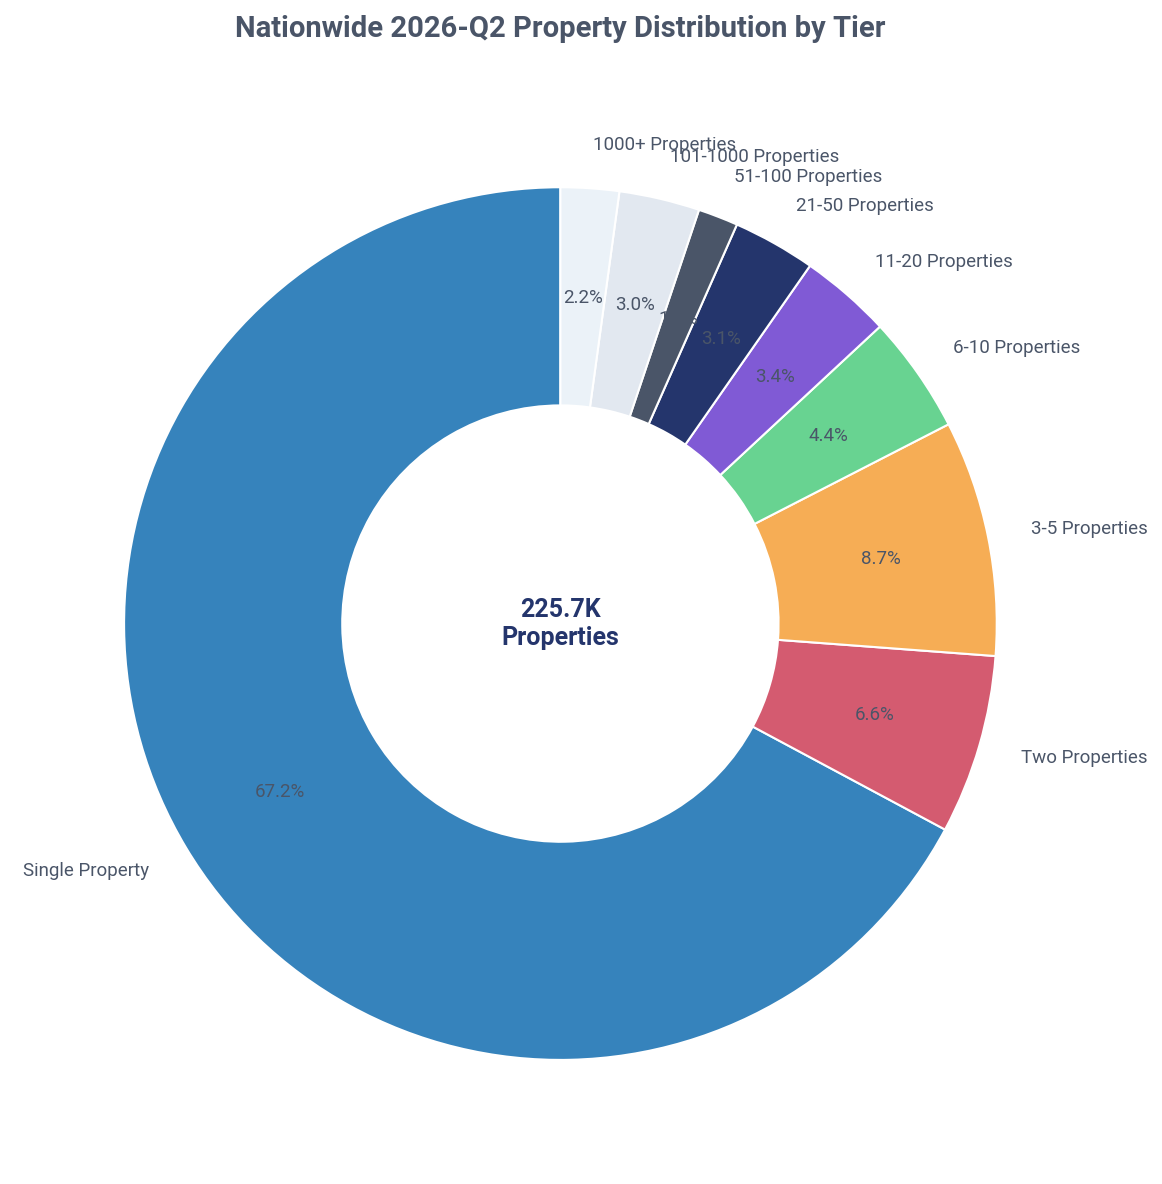
United States: purchased property share by tier, Q2 2026
Key Insight
Landlords purchased 22.7% of all single-family homes sold nationwide in Q2 2026.
Detailed Findings

Investor activity accounted for a significant portion of the housing market in Q2 2026, with landlords acquiring 220,102 of the 968,474 total SFRs sold. This 22.7% market share highlights the continued and substantial demand from investors for residential real estate.

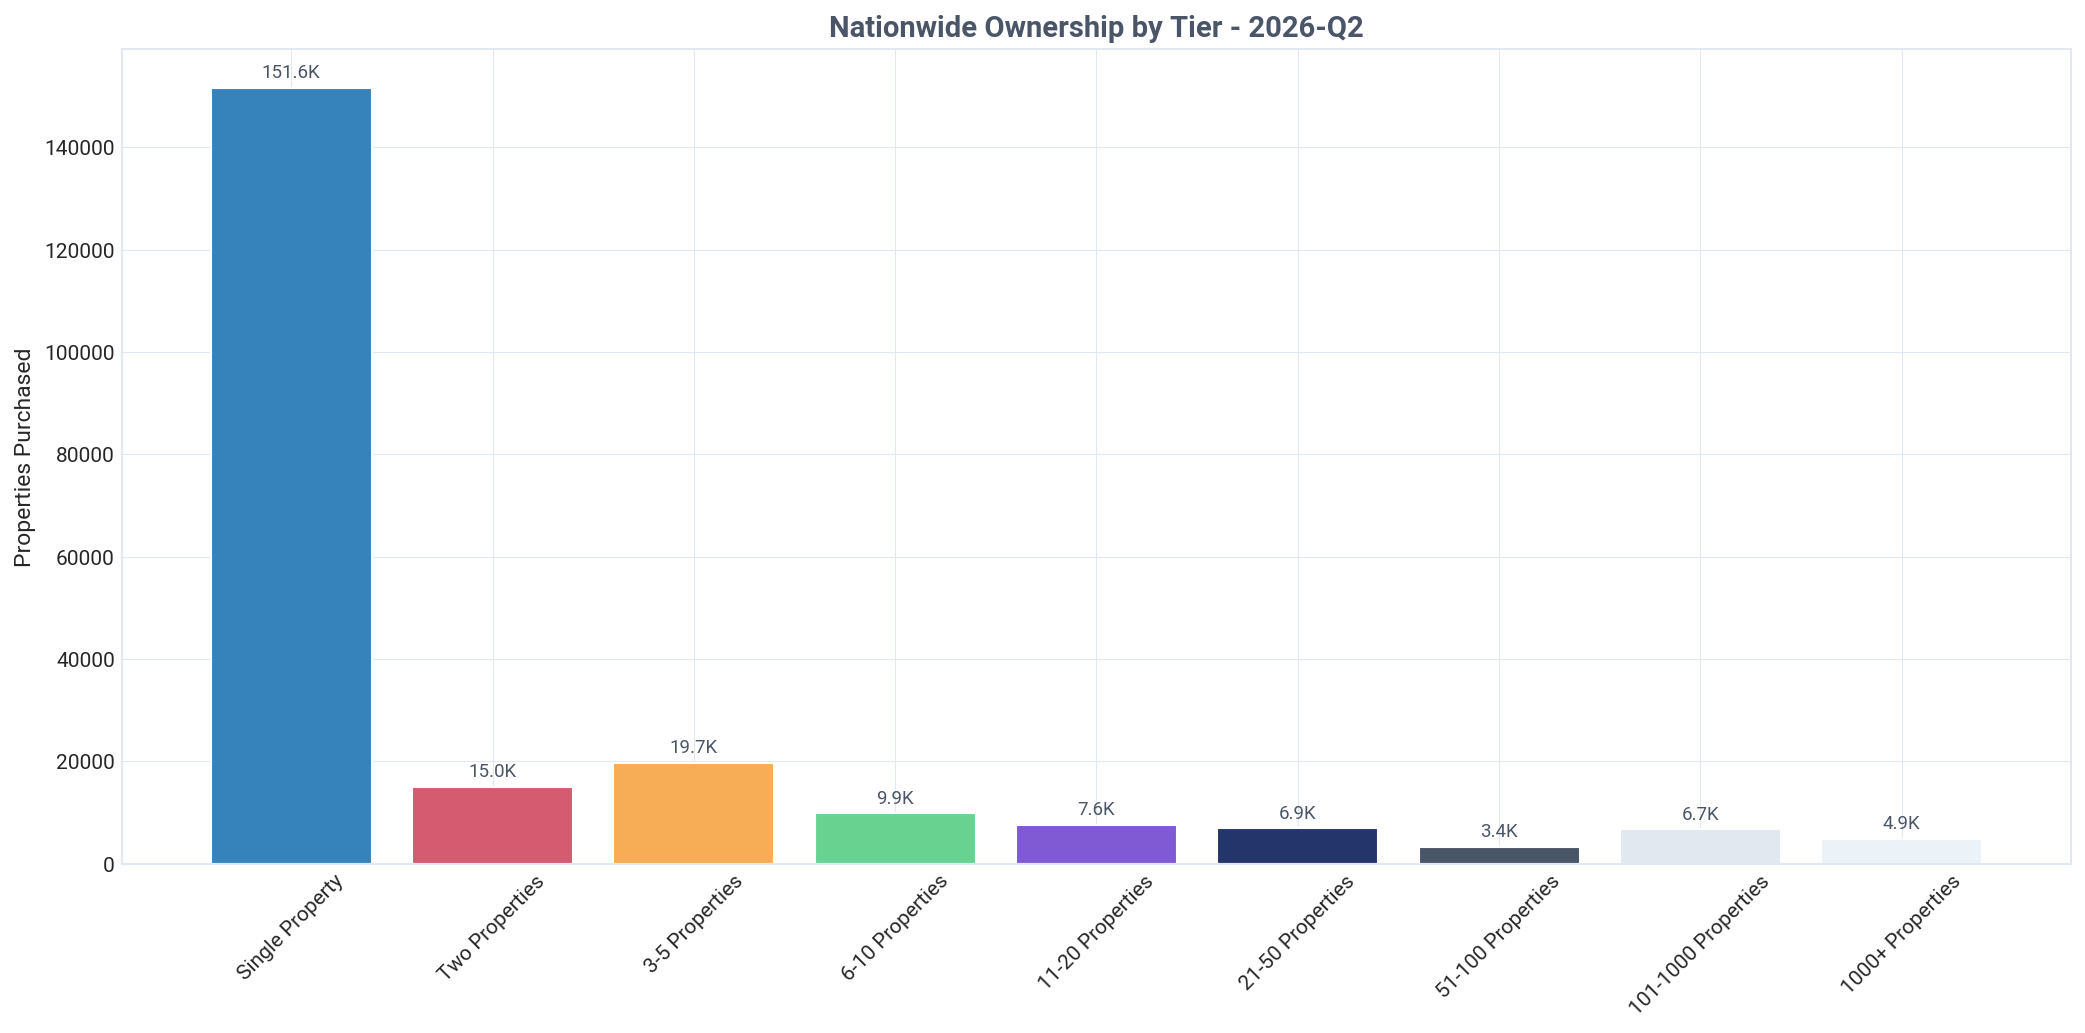
The overwhelming majority of this purchasing activity came from small-scale investors. Mom-and-pop landlords (owning 1-10 properties) collectively bought 196,162 properties, representing 86.9% of all landlord acquisitions during the quarter. This demonstrates that the market's depth is driven by smaller players, not large corporations.

New investors flooded the market, with 198,942 entities purchasing their first rental property in Q2 2026. This group alone acquired 151,602 homes, accounting for 67.2% of all properties bought by investors, signaling strong grassroots entry into real estate investment.

In stark contrast, institutional investors (1,000+ properties) had a minimal impact on acquisitions, purchasing only 4,876 properties. This represents just 2.2% of all landlord purchases, challenging the narrative that large firms are dominating the market. Many use advanced property search tools to find specific assets.

Mid-size landlords (11-1,000 properties) filled the gap, acquiring a combined 28,064 properties, or 12.8% of the investor total. While more active than institutional firms, their purchasing volume remains far below that of the mom-and-pop segment.

Ownership by Purchase Tier

Distribution of investor-owned properties across portfolio size tiers

Key Insight
Mom-and-pop landlords (1-10 properties) control 90.9% of all investor-owned SFRs nationwide.
Detailed Findings

The national ownership structure of investor-held SFRs is overwhelmingly dominated by small-scale landlords. Investors owning 1-10 properties (Tiers 01-04) collectively control 90.9% of the 15.4 million-property portfolio. This finding firmly establishes mom-and-pop investors as the backbone of the single-family rental market.

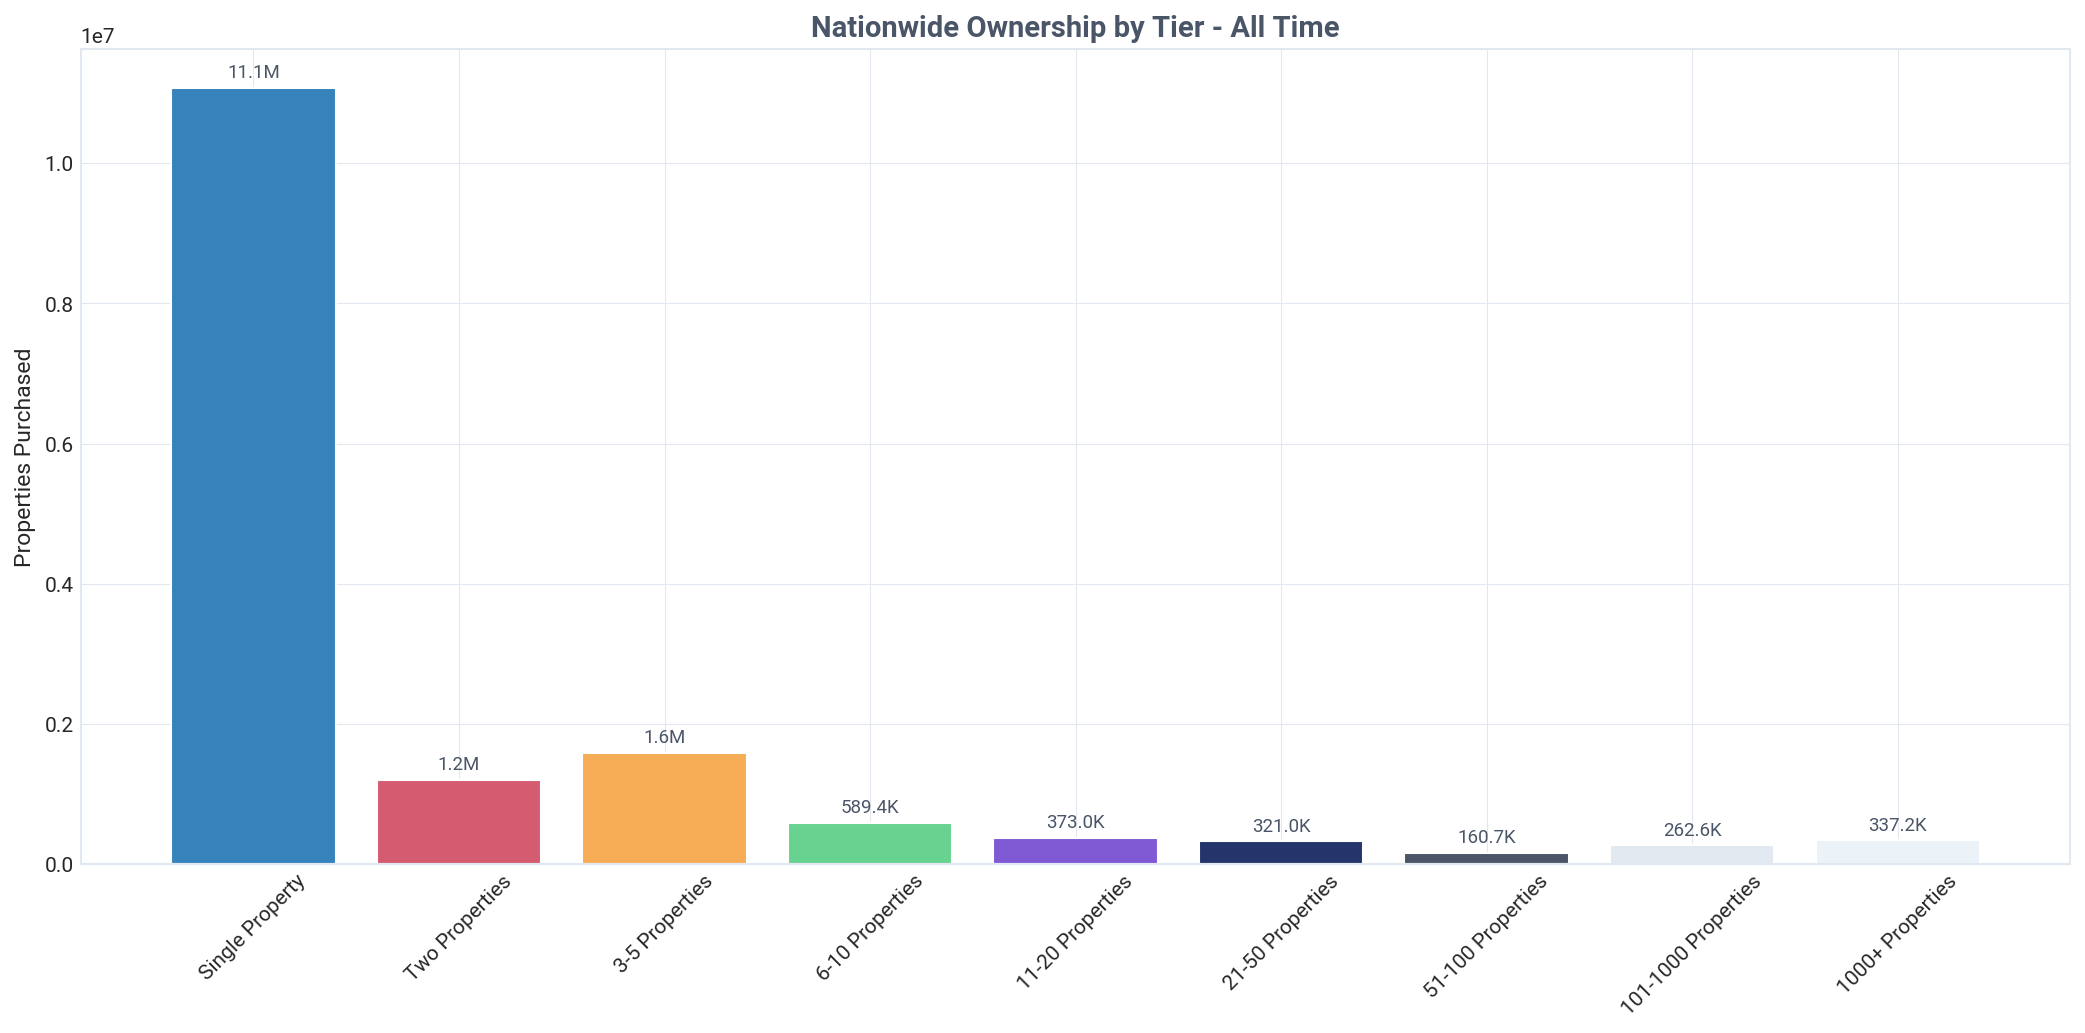
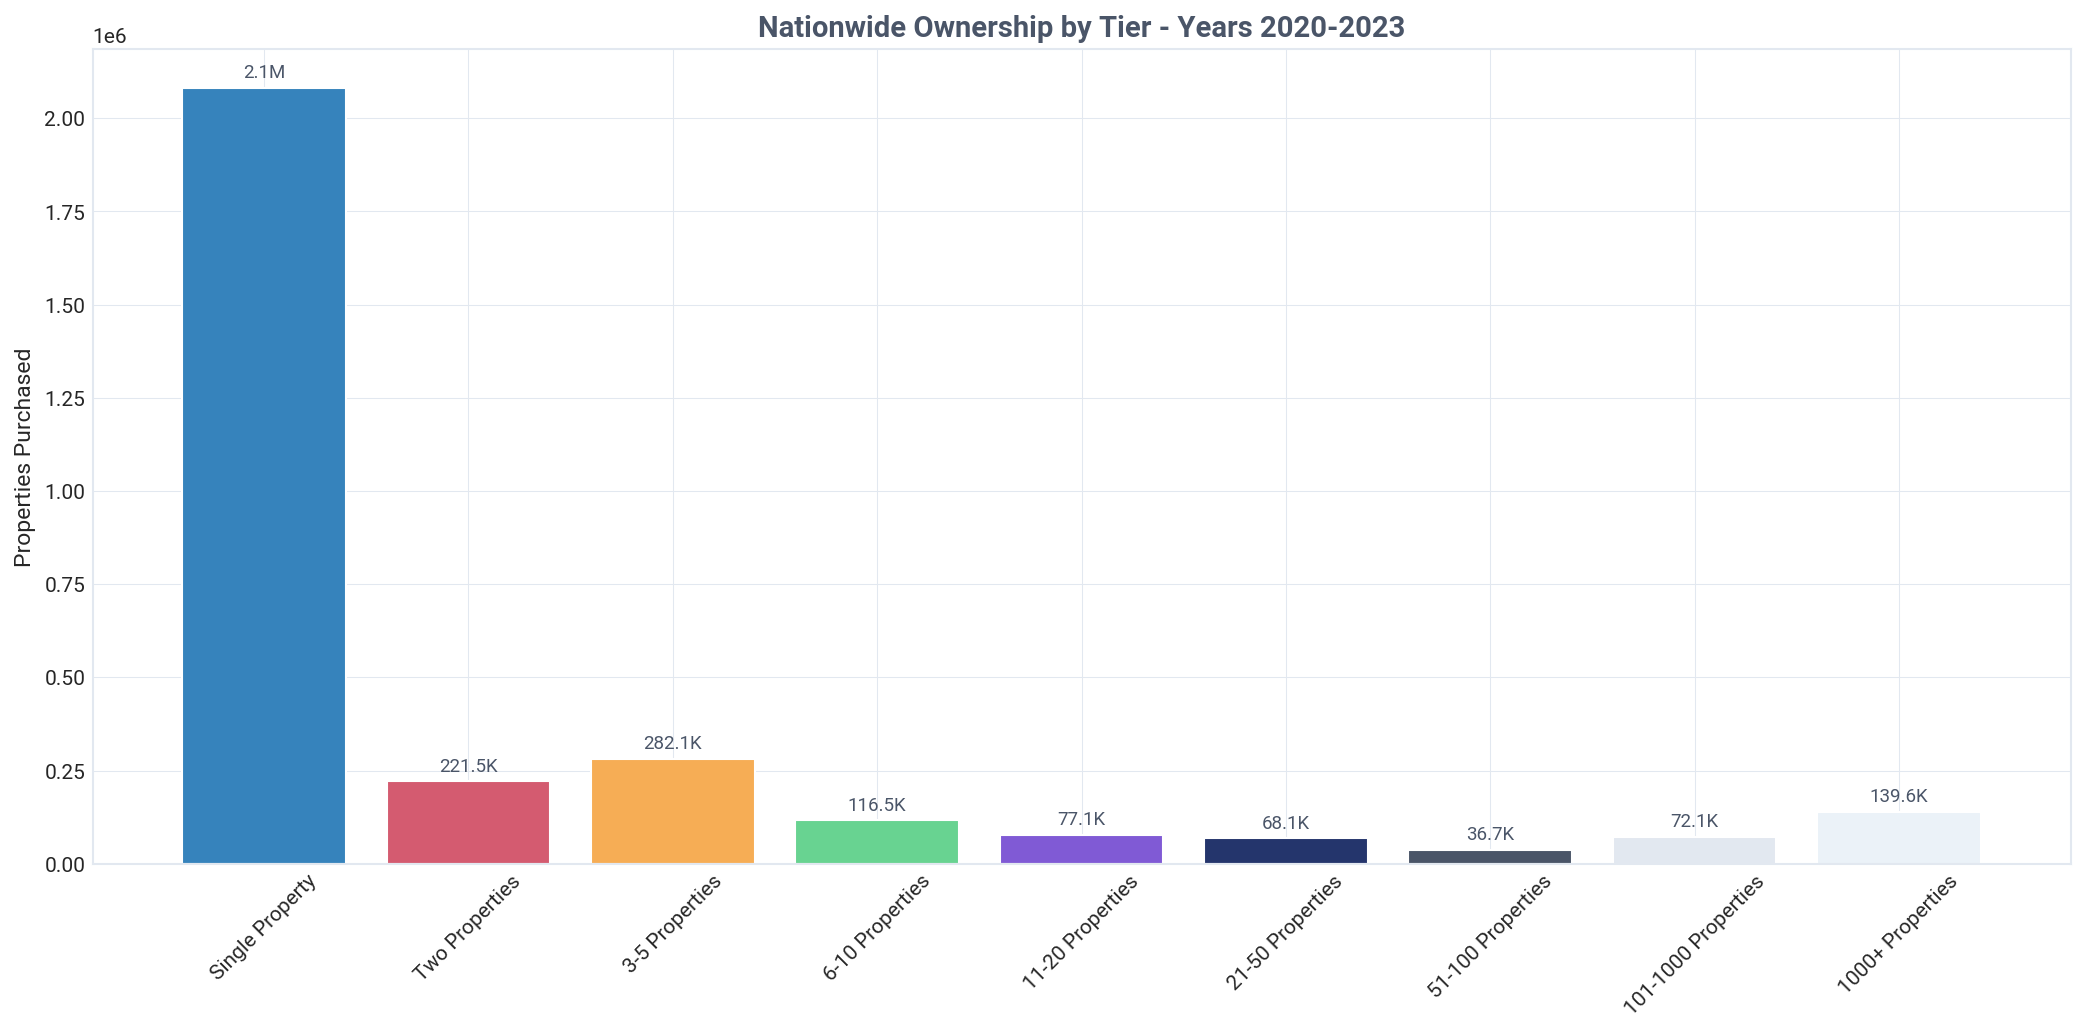
Single-property landlords (Tier 01) represent the largest single segment by a wide margin, owning 11,079,377 properties. This accounts for 69.7% of all investor-owned homes, indicating that the typical real estate investor is not a large corporation but an individual or small business with a single rental unit.

Conversely, institutional investors with portfolios of 1,000 or more properties (Tier 09) own just 337,238 homes nationwide. Their 2.1% market share is minimal compared to the vast holdings of smaller investors, a critical piece of context often missing from public discourse.

The mid-size investor segment, owning between 11 and 1,000 properties, accounts for the remaining 7.0% of the market. This group, while larger than the institutional tier, still holds only a fraction of the properties controlled by mom-and-pop landlords.

This tiered ownership distribution has remained relatively stable, confirming a long-term pattern of decentralized ownership in the SFR market. Insights from various market reports consistently show that the barrier to entry for a single property is low, fostering a wide base of small investors.

United States: current ownership by purchase tier, Q2 2026
United States: properties purchased by tier, all time, Q2 2026
United States: properties purchased by tier this quarter, Q2 2026
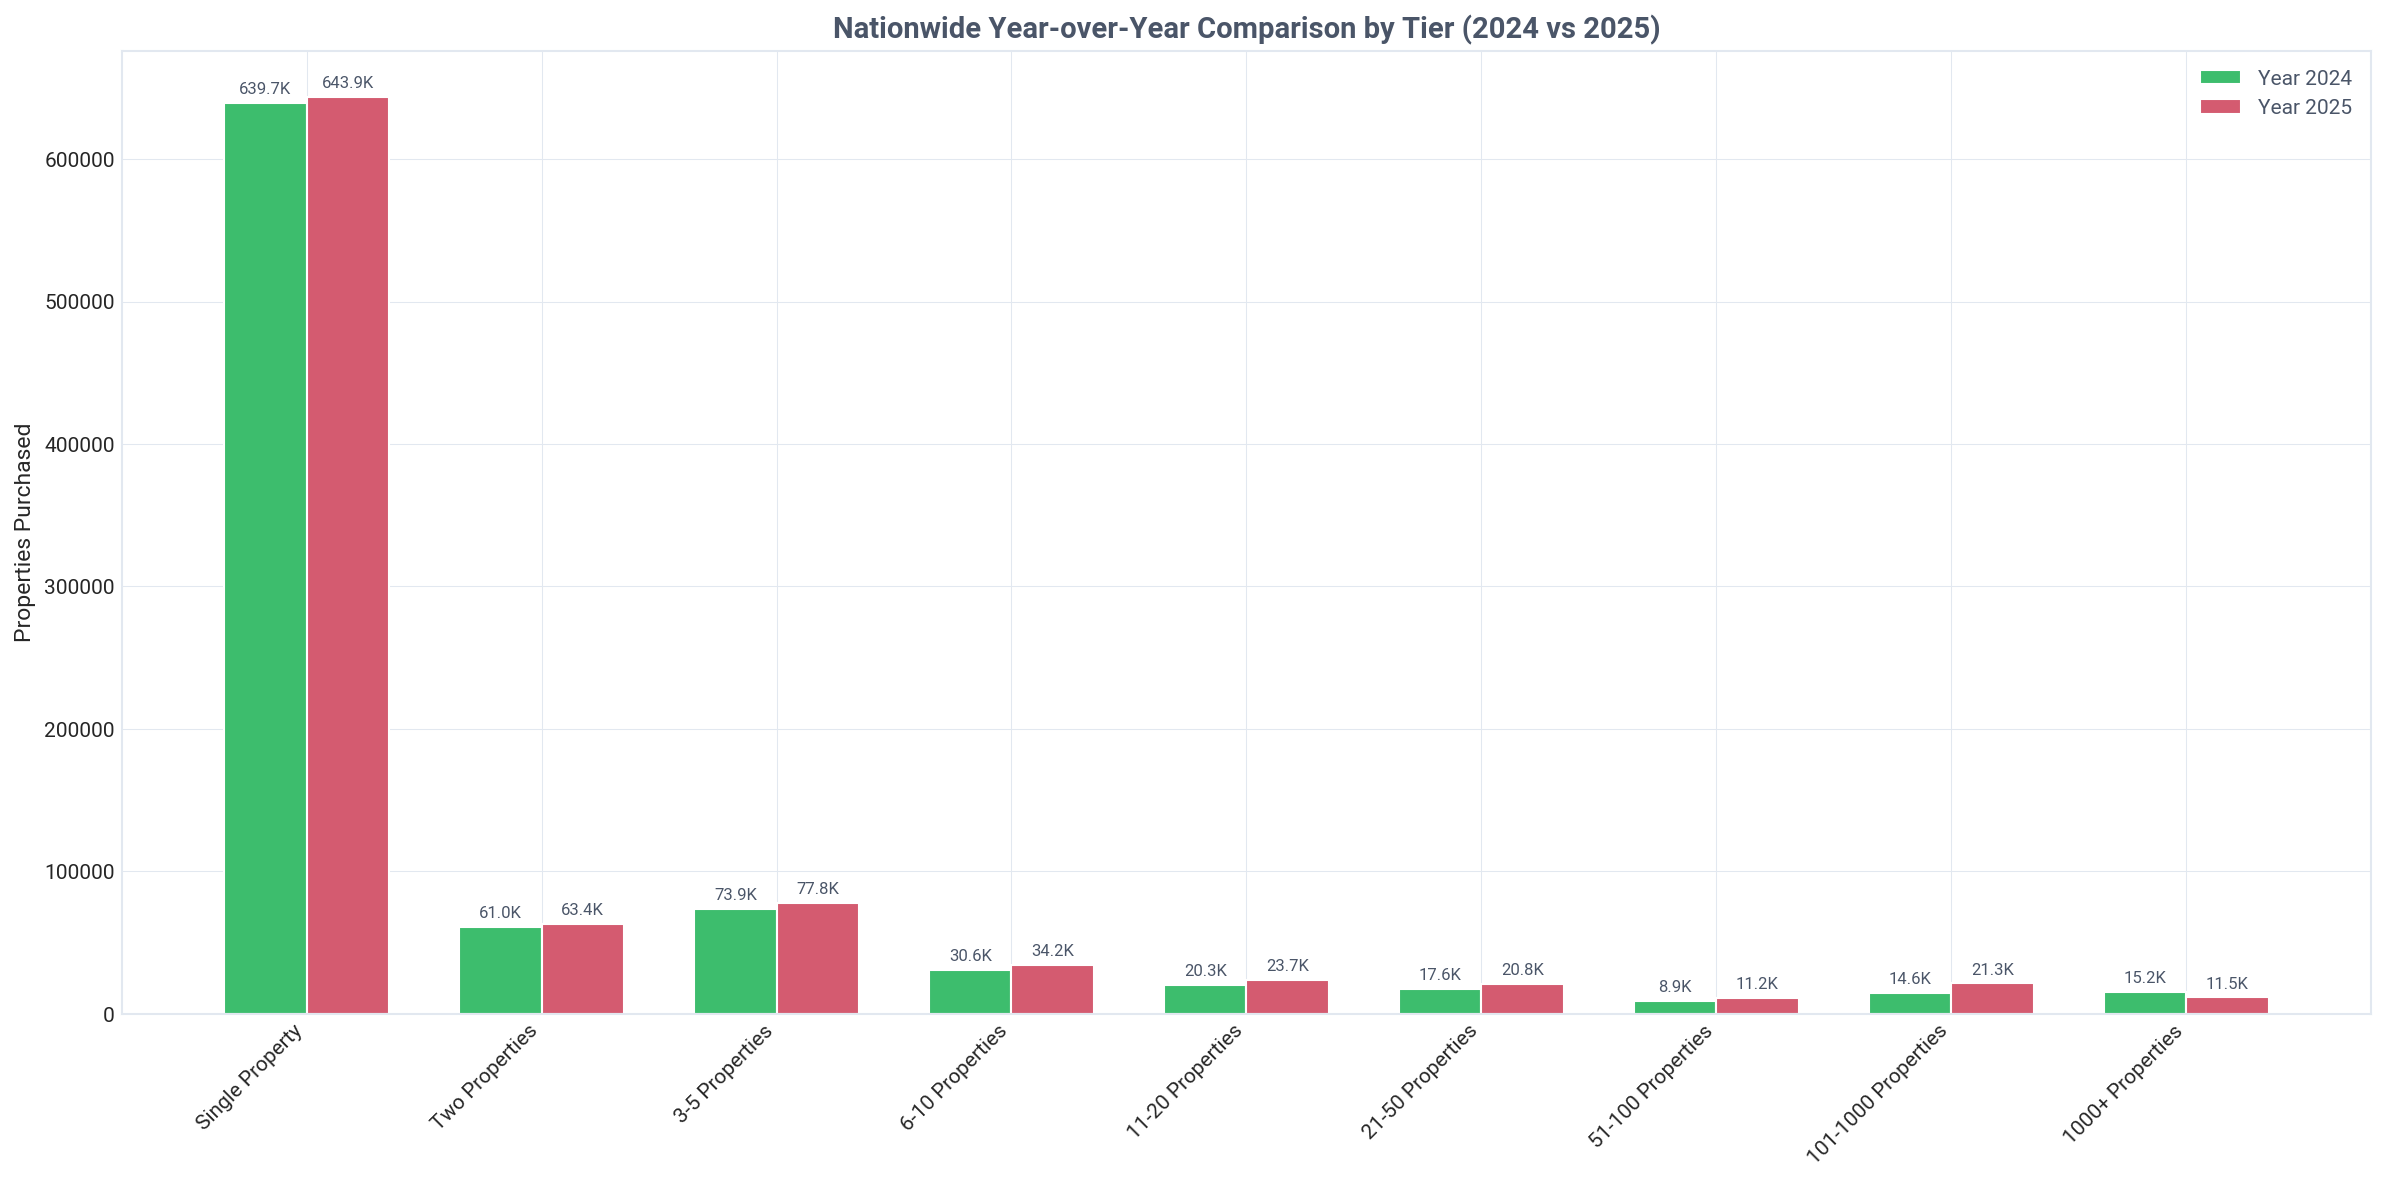
United States: properties purchased by tier year over year, Q2 2026

Need custom portfolio analysis based on these tier insights?

TALK TO AN EXPERT

Ownership by Tier & Owner Type

Breakdown of individual vs corporate ownership across portfolio tiers

United States: ownership by tier and owner type, Q2 2026
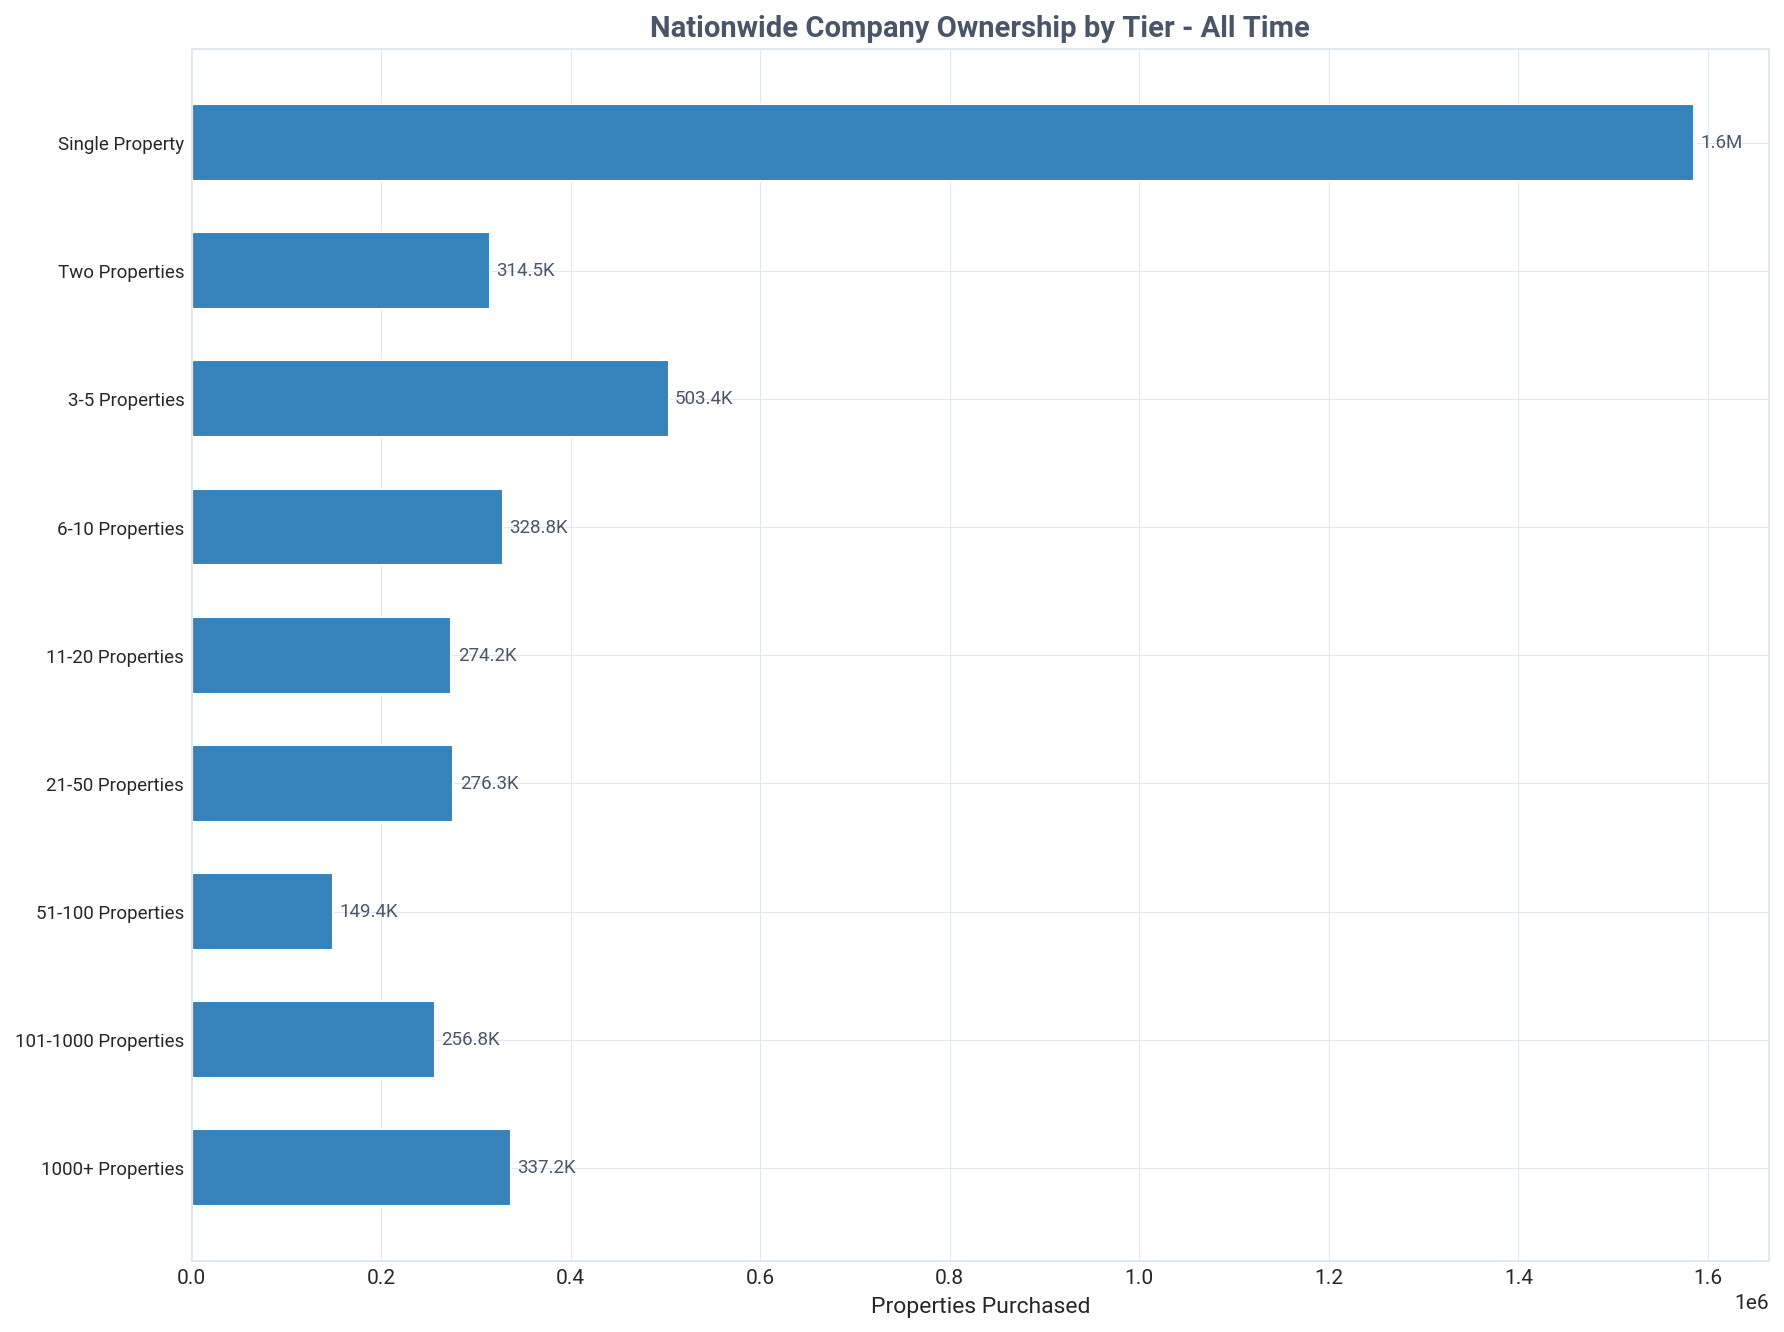
United States: company purchases by tier, all time, Q2 2026
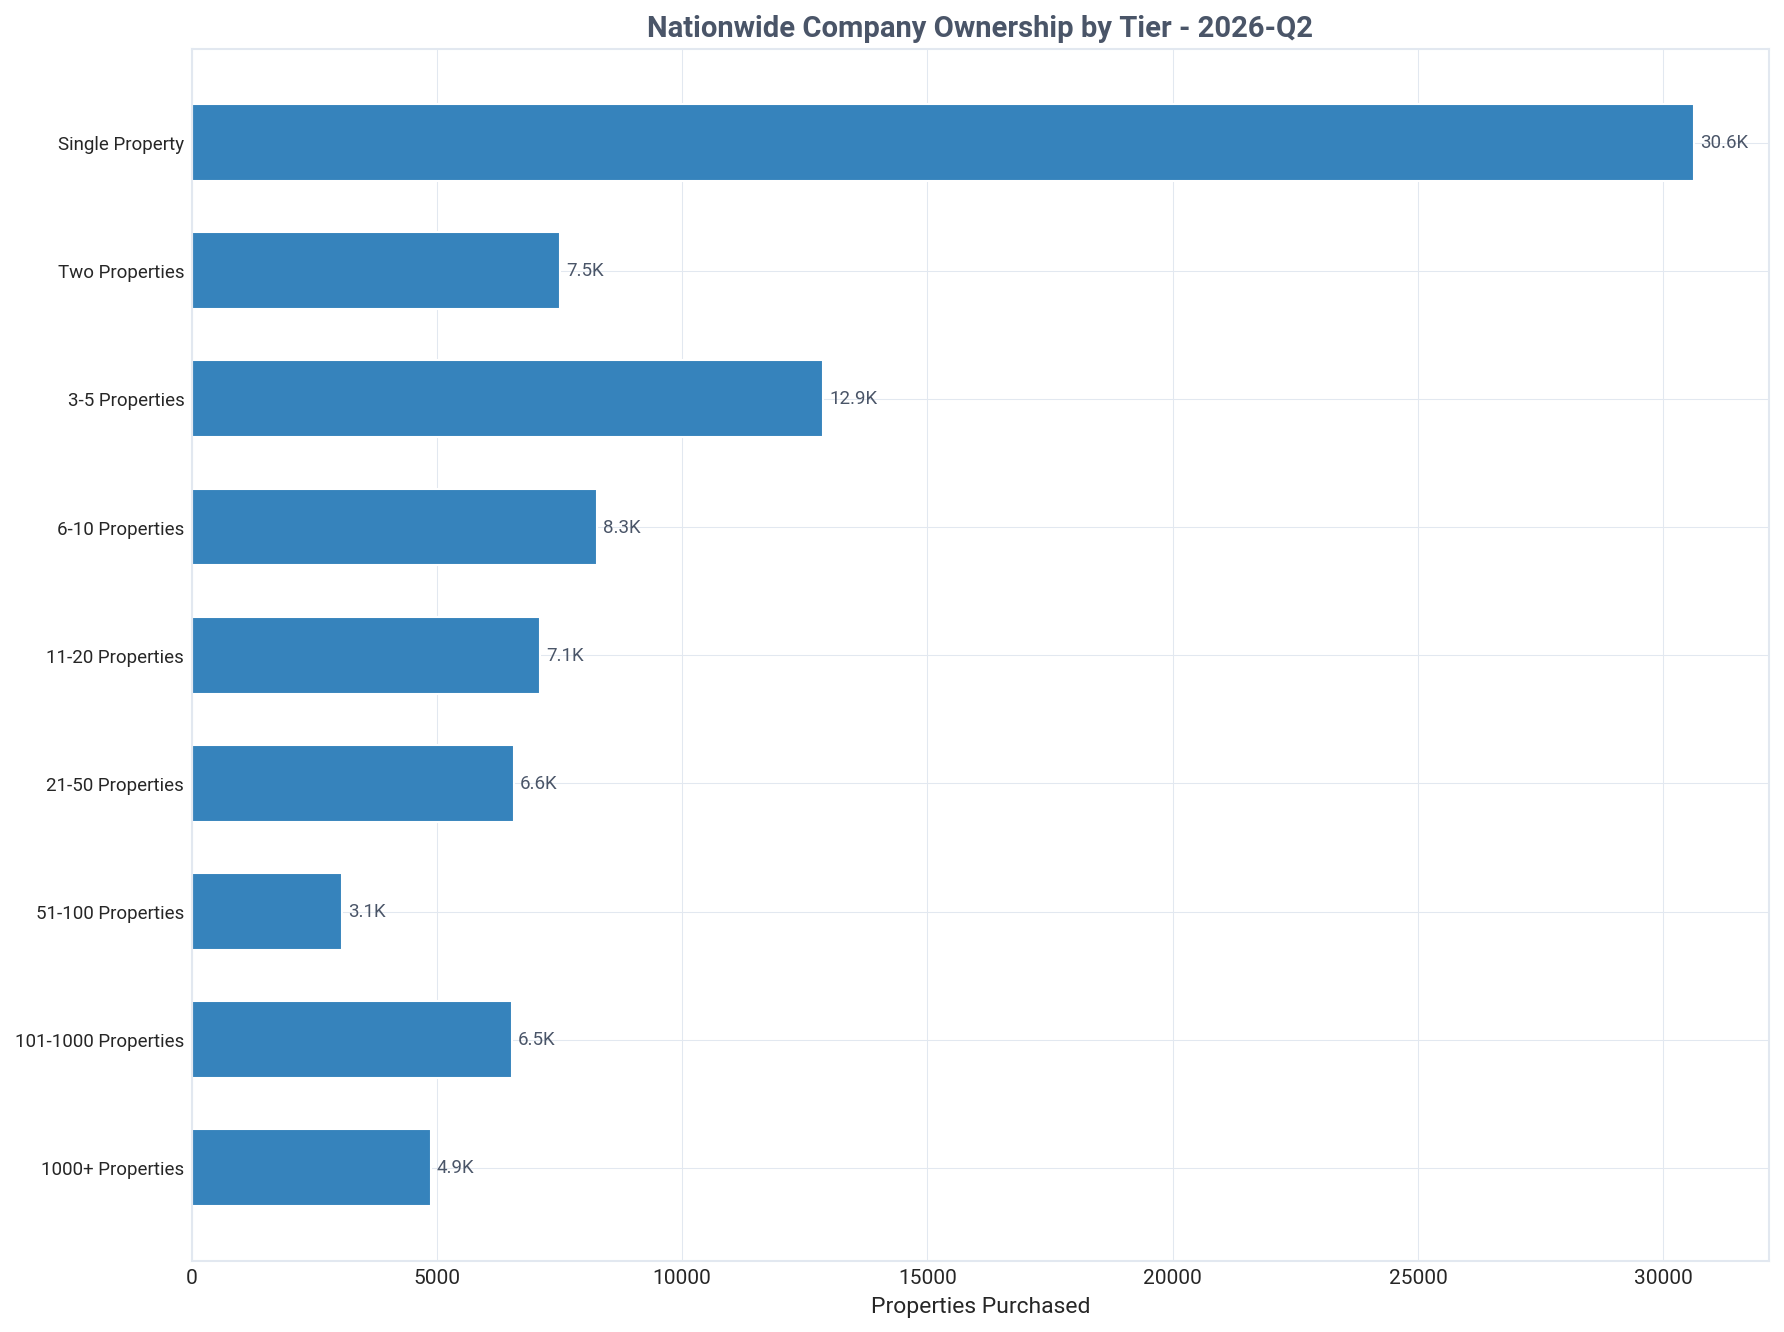
United States: company purchases by tier this quarter, Q2 2026
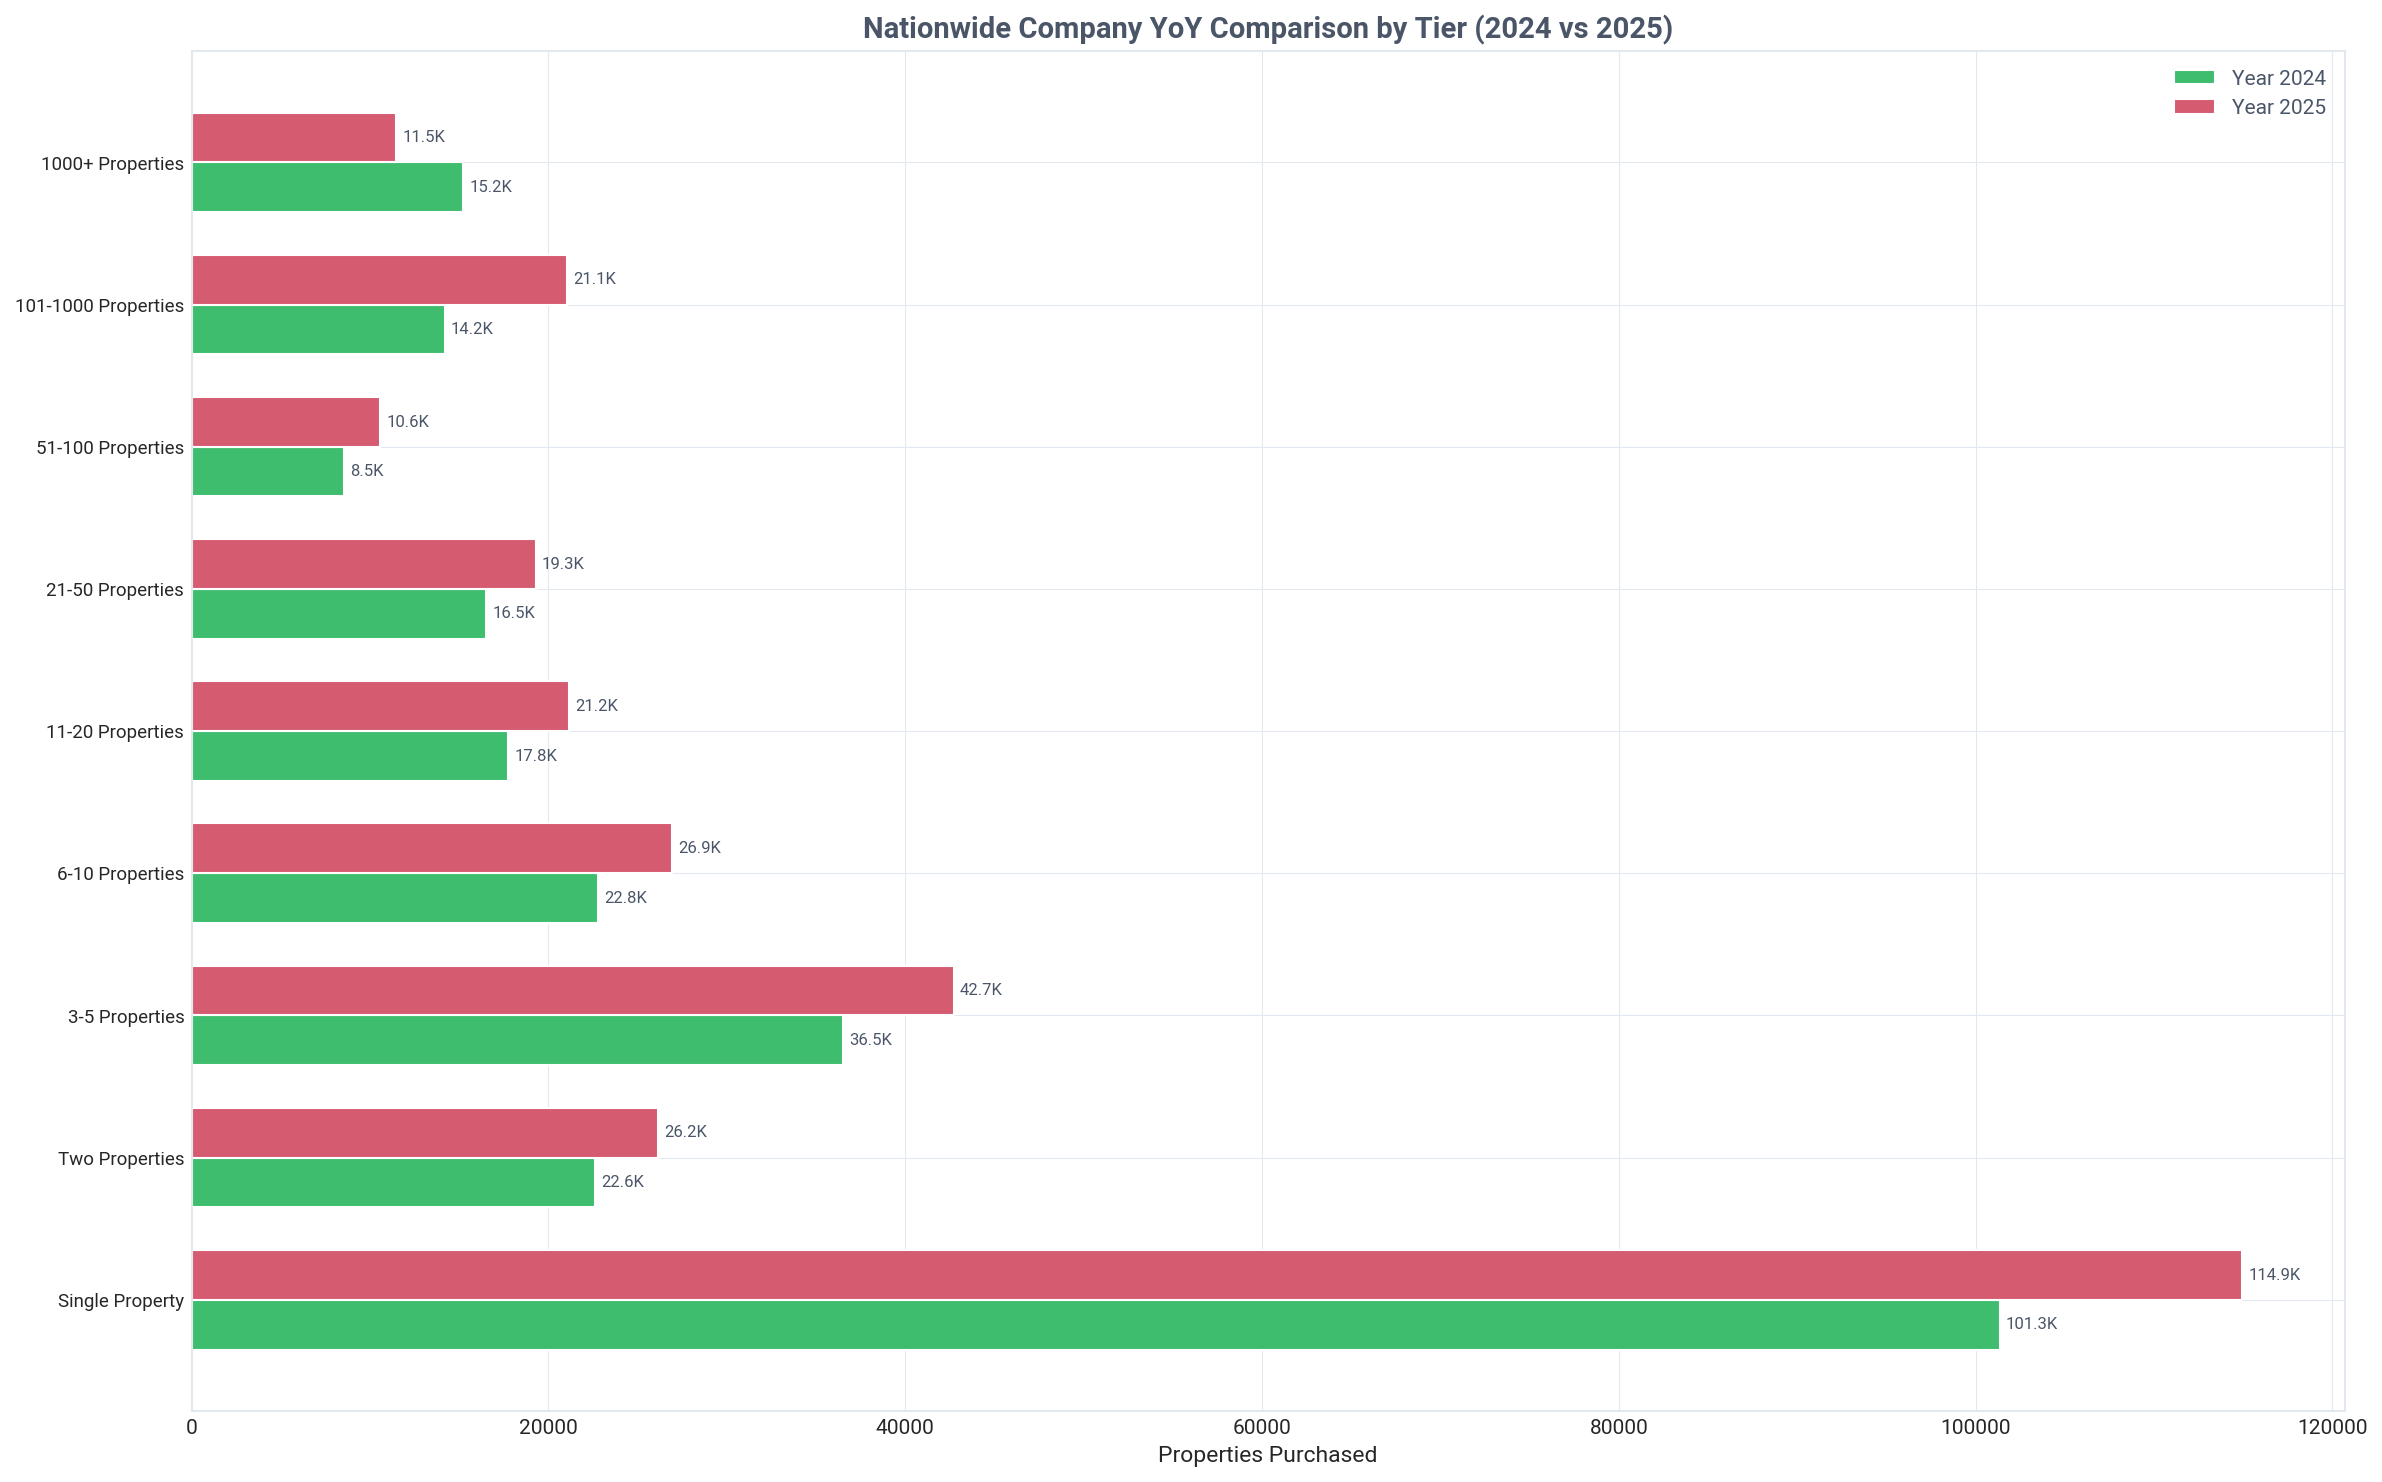
United States: company purchases by tier year over year, Q2 2026
Key Insight
The typical crossover point occurs at 6-10 properties, where companies own 55.3% of homes.
Detailed Findings

Ownership structure shifts dramatically as portfolio sizes increase, with a clear transition from individual to corporate ownership. For smaller portfolios, individuals are dominant, holding 86.0% of single-property investments and 74.1% of two-property portfolios.

The critical crossover point occurs in the 6-10 property tier (Tier 04). At this stage, companies become the majority owners for the first time, holding 328,808 properties (55.3%) compared to the 266,102 (44.7%) held by individuals. This signals a move towards professionalization and the use of legal entities for liability and tax purposes.

Beyond this crossover, company ownership becomes increasingly concentrated. In the 11-20 property tier, companies own 73.1% of homes, a figure that rises to 85.7% for the 21-50 property tier. This trend highlights how larger portfolios are almost exclusively managed through corporate structures.

At the highest end of the market, company control is nearly absolute. For large landlords in the 101-1,000 property tier, companies own 256,779 properties, or 97.6% of the total in that segment. This level of corporate consolidation is expected for professionally managed, large-scale operations which often leverage bulk data delivery to manage their assets.

Even within the large institutional tier, individuals still hold a small but notable number of properties. This suggests some high-net-worth individuals maintain very large portfolios without incorporating, though they are a distinct minority. Understanding these owner types is crucial and can be enhanced with contact enrichment services.

Geographic Distribution

Regional breakdown of investor activity and ownership patterns

Key Insight
Texas, California, and Florida are the top 3 states for investor-owned property counts.
Detailed Findings

Geographic concentration of investor-owned properties is highest in large, populous states. Texas leads the nation with 1,383,569 investor-owned SFRs, followed closely by California with 1,195,773 and Florida with 1,070,206. Together, these three states account for over 3.6 million properties, or 23.8% of the national investor portfolio.

The top five states by sheer volume are rounded out by North Carolina (790,875 properties) and Georgia (630,731 properties). These Sun Belt states are magnets for investment due to strong population growth, economic expansion, and robust rental demand, often driven by unique demographic data.

However, the states with the highest *rate* of investor ownership tell a different story. Maine tops this list, with 30.9% of its SFR housing stock owned by investors. Wyoming (30.6%), Alaska (26.7%), Montana (26.6%), and Hawaii (25.6%) follow, suggesting that markets with significant vacation rental demand or smaller overall housing stocks can have high investor penetration.

There is a notable divergence between the leaders in count versus percentage. None of the top five states for property count appear in the top five for ownership rate. This indicates different market dynamics: large-scale investment volume in major economic hubs versus high market saturation in smaller or specialized states.

North Carolina stands out for having both a high count (4th nationally) and a high ownership rate of 24.7%. This combination suggests a market with both substantial scale and deep investor penetration, making it a key battleground for SFR investment.

United States: landlord ownership map, Q2 2026
United States: top 15 areas by landlord-owned properties, Q2 2026
United States: top 15 areas by landlord ownership share, Q2 2026

Historical Transactions

Buy/sell transaction trends over time for all landlords and institutional investors

United States: landlord buy and sell transactions, Q2 2026
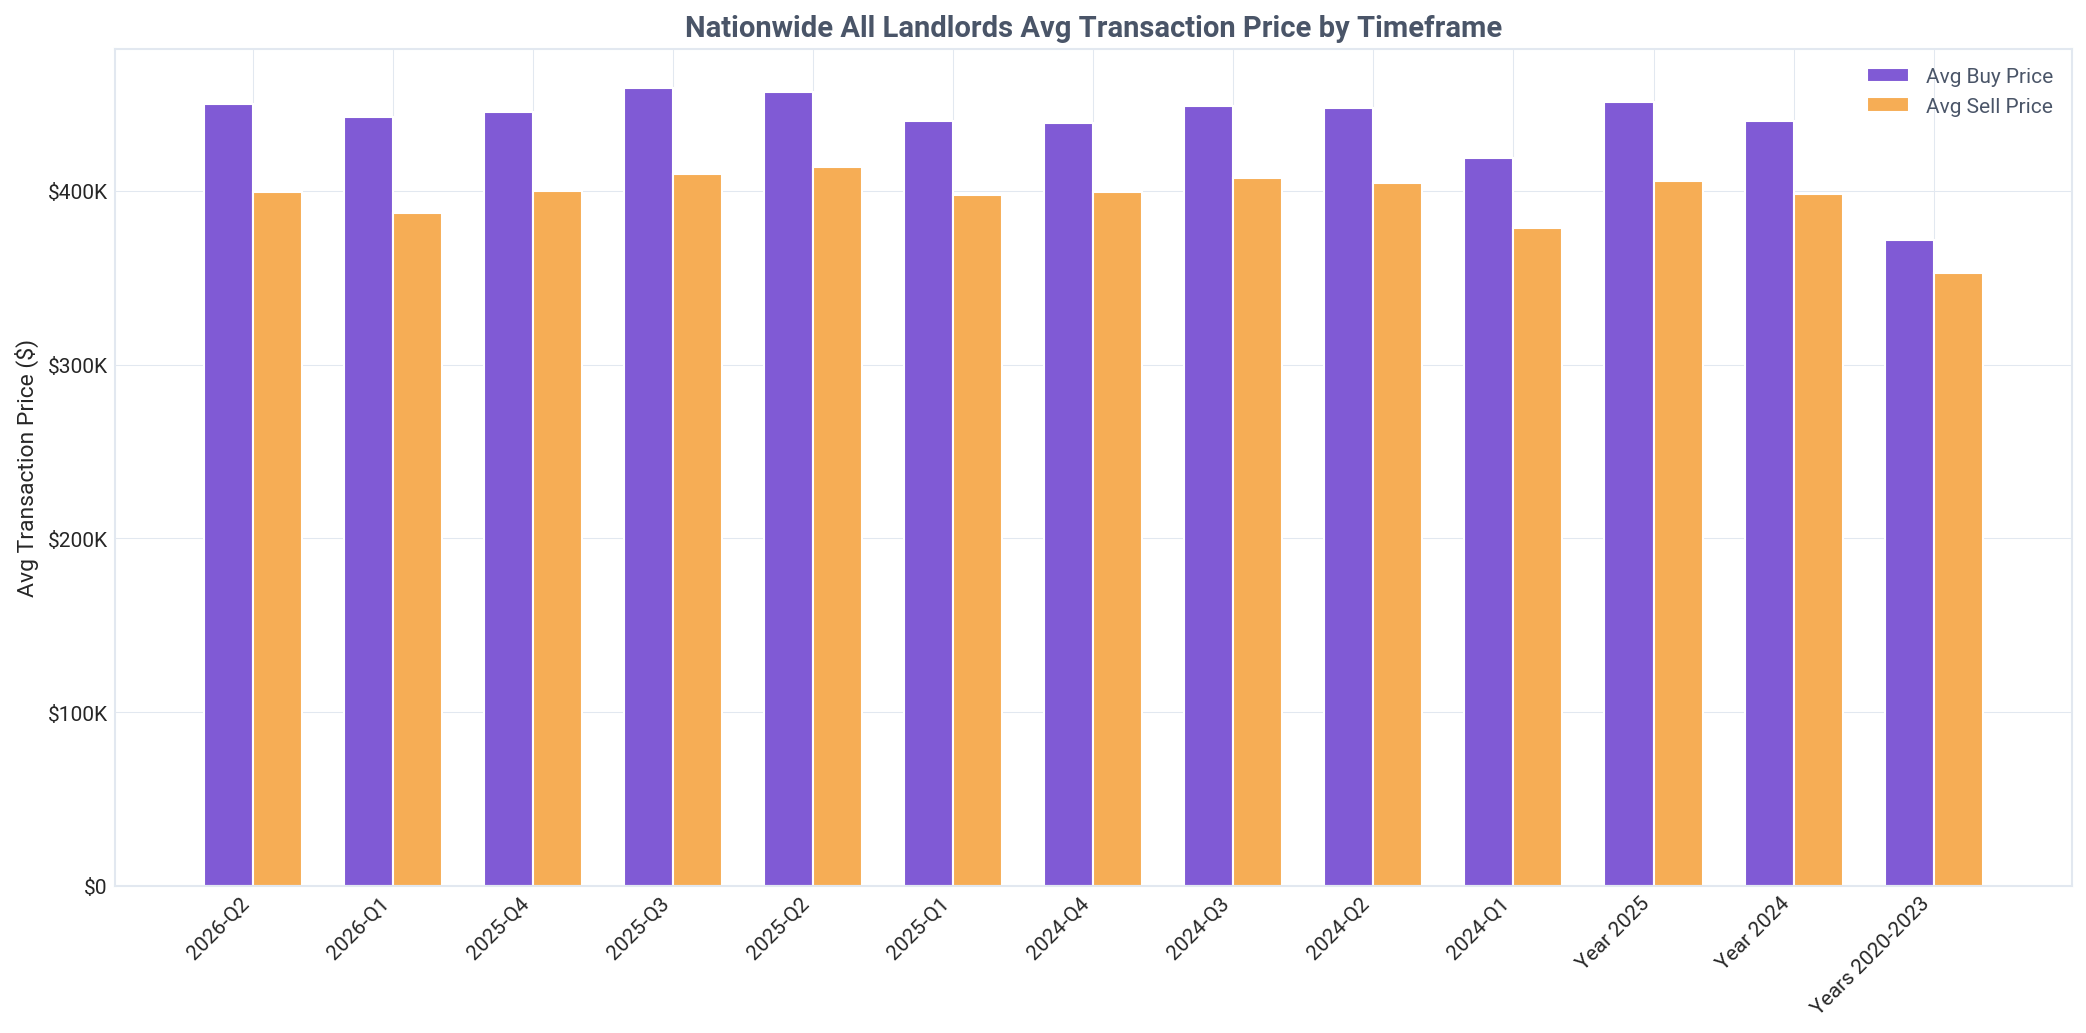
United States: landlord average buy and sell prices, Q2 2026
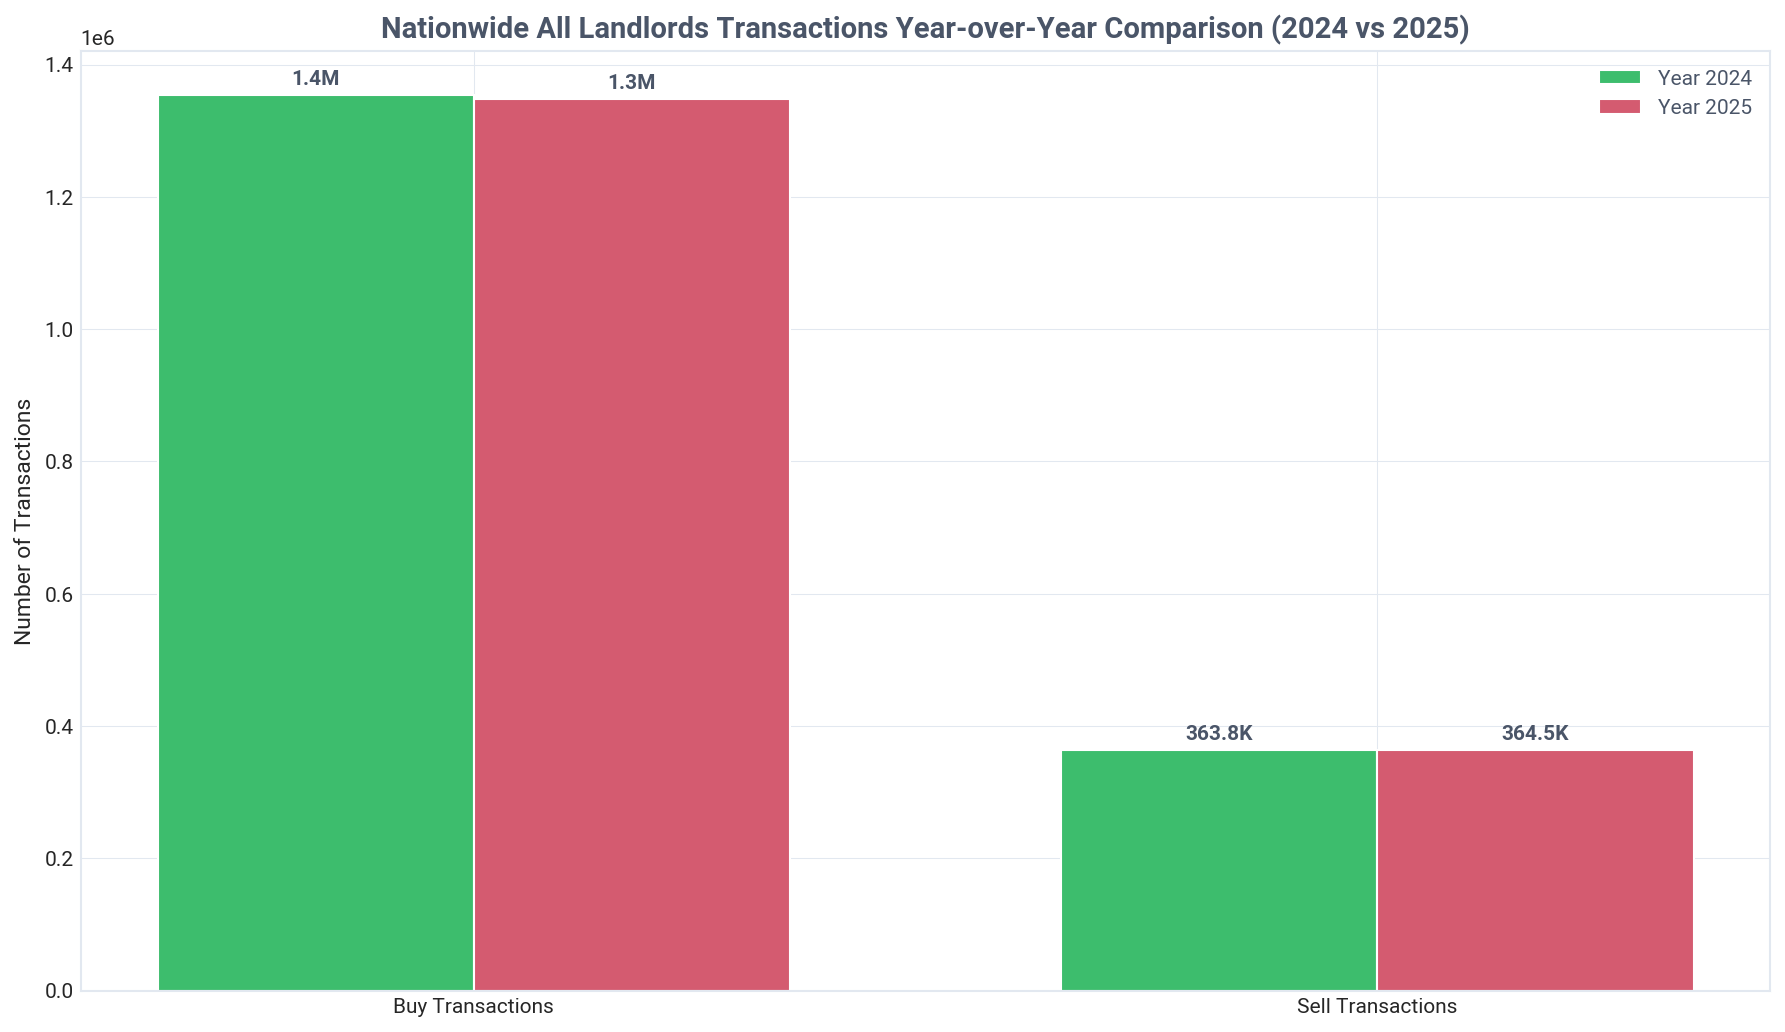
United States: landlord transactions year over year, Q2 2026
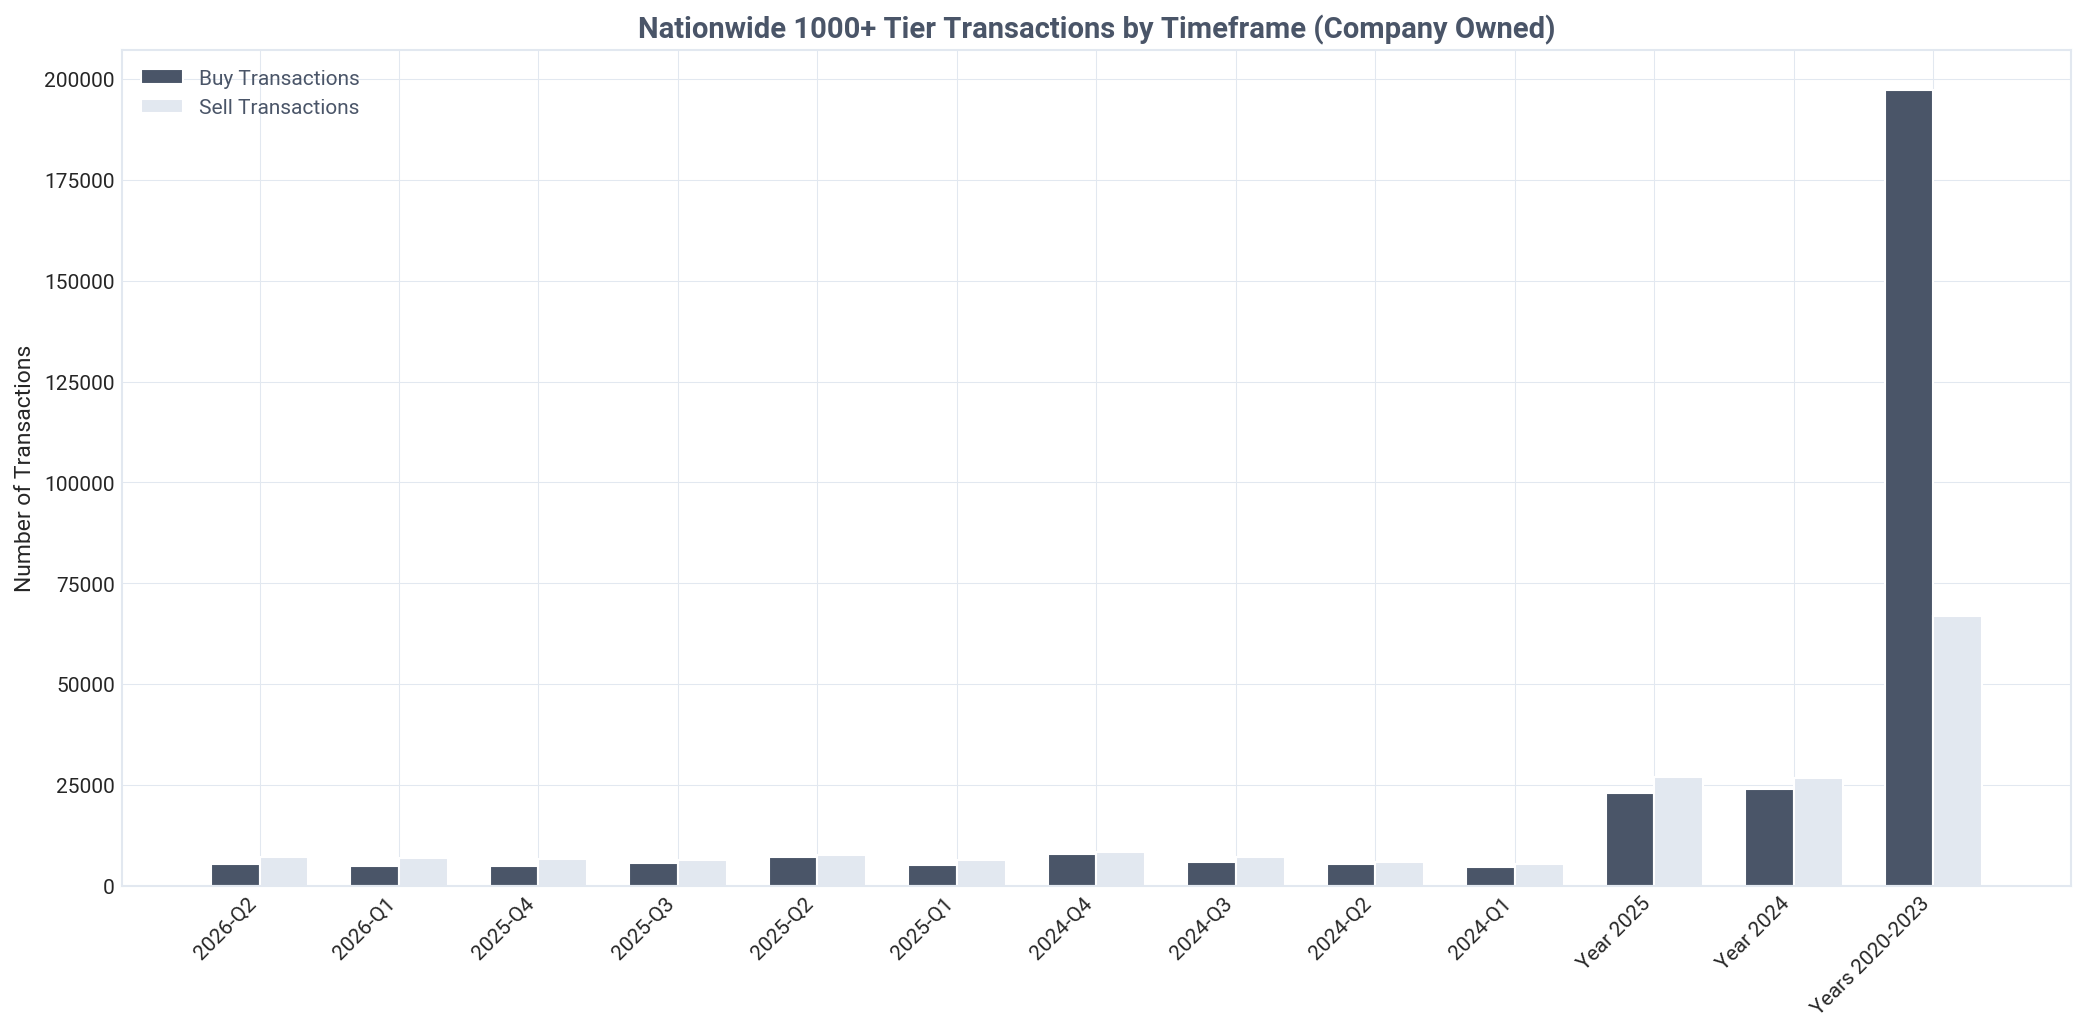
United States: 1000+ tier company transactions, Q2 2026
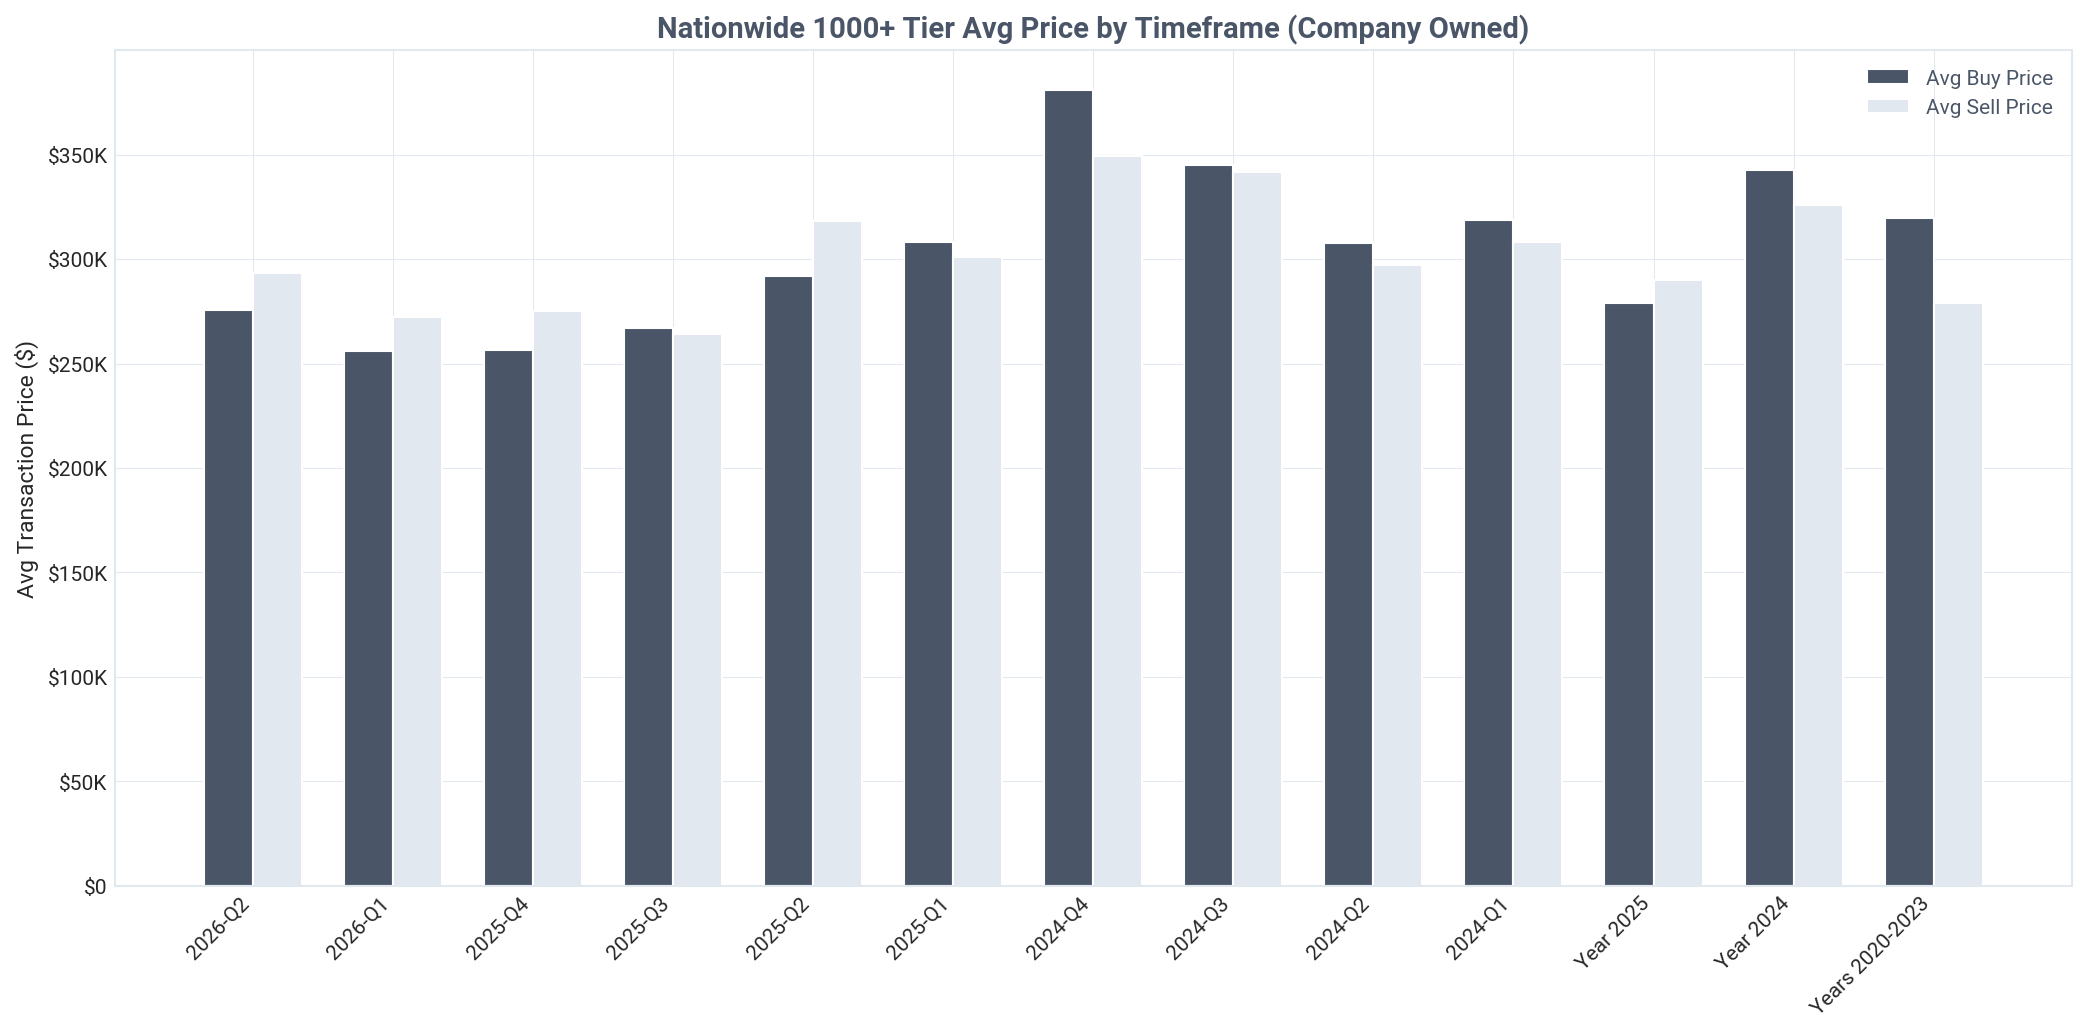
United States: 1000+ tier company average prices, Q2 2026
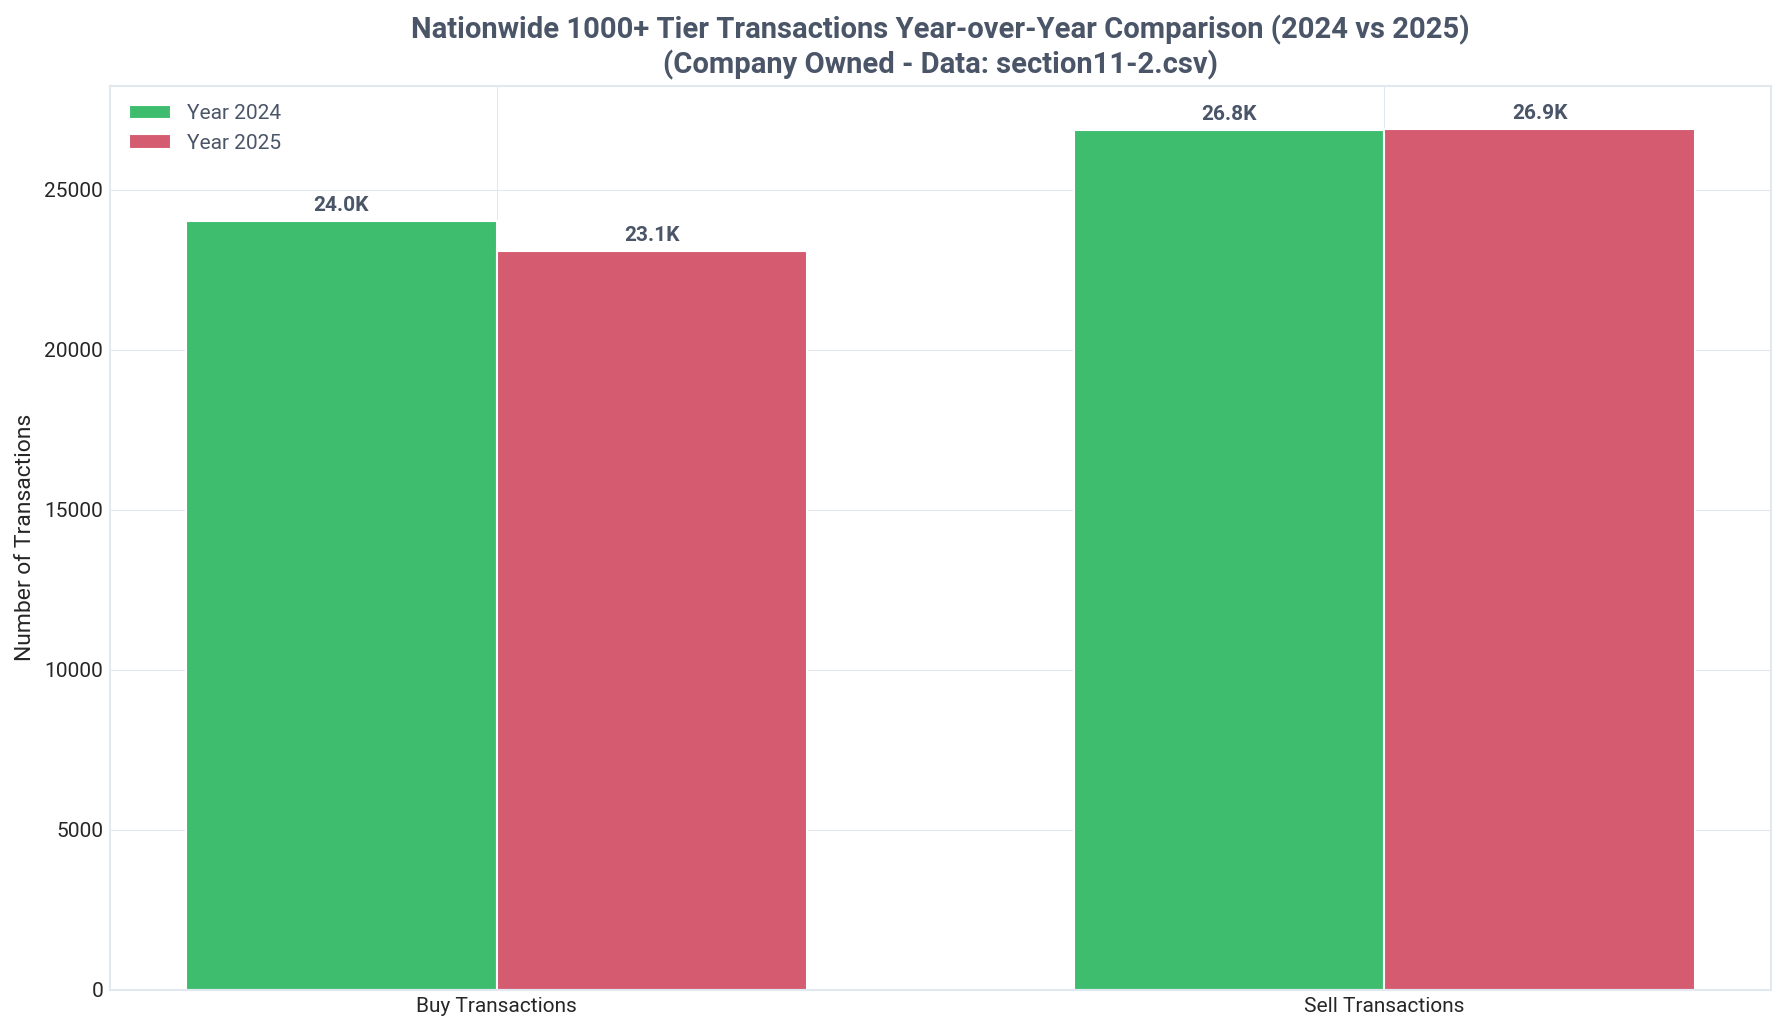
United States: 1000+ tier transactions year over year, Q2 2026
Key Insight
Landlords remain strong net buyers, but institutional investors are net sellers.
Detailed Findings

The overall investor market demonstrated strong acquisition momentum in Q2 2026, with landlords acting as decisive net buyers. They purchased 284,068 properties while selling only 78,616, resulting in a net portfolio expansion of 205,452 homes. This trend has been consistent, with similar net buying activity over the past year.

However, a critical divergence emerges when analyzing institutional behavior. Investors in the 1,000+ property tier were net sellers in Q2 2026, acquiring 5,430 homes but selling 7,167. This net disposition of 1,737 properties signals a strategic retreat or portfolio rebalancing among the market's largest players.

The trend of institutional selling is not new. These large firms have been consistent net sellers for over a year, divesting a net 3,818 properties in 2025 and a net 2,829 in 2024. This sustained selling pressure from institutions runs counter to the accumulation strategy of the broader, smaller-investor market.

This split dynamic indicates that mom-and-pop landlords are absorbing housing supply, while institutional firms are providing some of that supply to the market. The growth in the SFR investor space is being driven from the bottom up, not the top down.

This pattern challenges the common perception of Wall Street's role in the housing market. While small investors continue to buy and hold, the largest players are actively trimming their portfolios, a key insight for understanding market liquidity and sentiment among different investor classes. This information is vital for proptech platforms trying to serve these distinct segments.

Current Quarter Transactions

Q2 2026 transaction analysis by tier, price, and inter-landlord activity

Key Insight
Landlords participated in 20.7% of all housing transactions in Q2 2026.
Detailed Findings

In Q2 2026, landlords were involved in 284,068 of the 1,373,991 total SFR transactions, representing a 20.7% share of all market activity. This highlights investors as a consistent and powerful source of market liquidity and demand.

A stark pricing difference exists between the smallest and largest investors. Single-property landlords paid the most, with an average purchase price of $494,715. In sharp contrast, institutional investors in the 1,000+ tier paid an average of just $275,526, securing a 44.3% discount compared to their smallest counterparts.

This price gap reveals fundamentally different acquisition strategies. New mom-and-pop investors are often buying on-market properties at near-retail prices, while institutional firms leverage scale, property data API solutions, and off-market channels to acquire assets at a deep discount. There is a clear inverse relationship: as portfolio size increases, the average purchase price decreases.

Institutional investors operate heavily within an insular, landlord-to-landlord market. In Q2 2026, 45.2% of all properties they purchased were acquired from other landlords. This is significantly higher than any other tier; for example, single-property buyers sourced only 9.1% of their acquisitions from fellow investors.

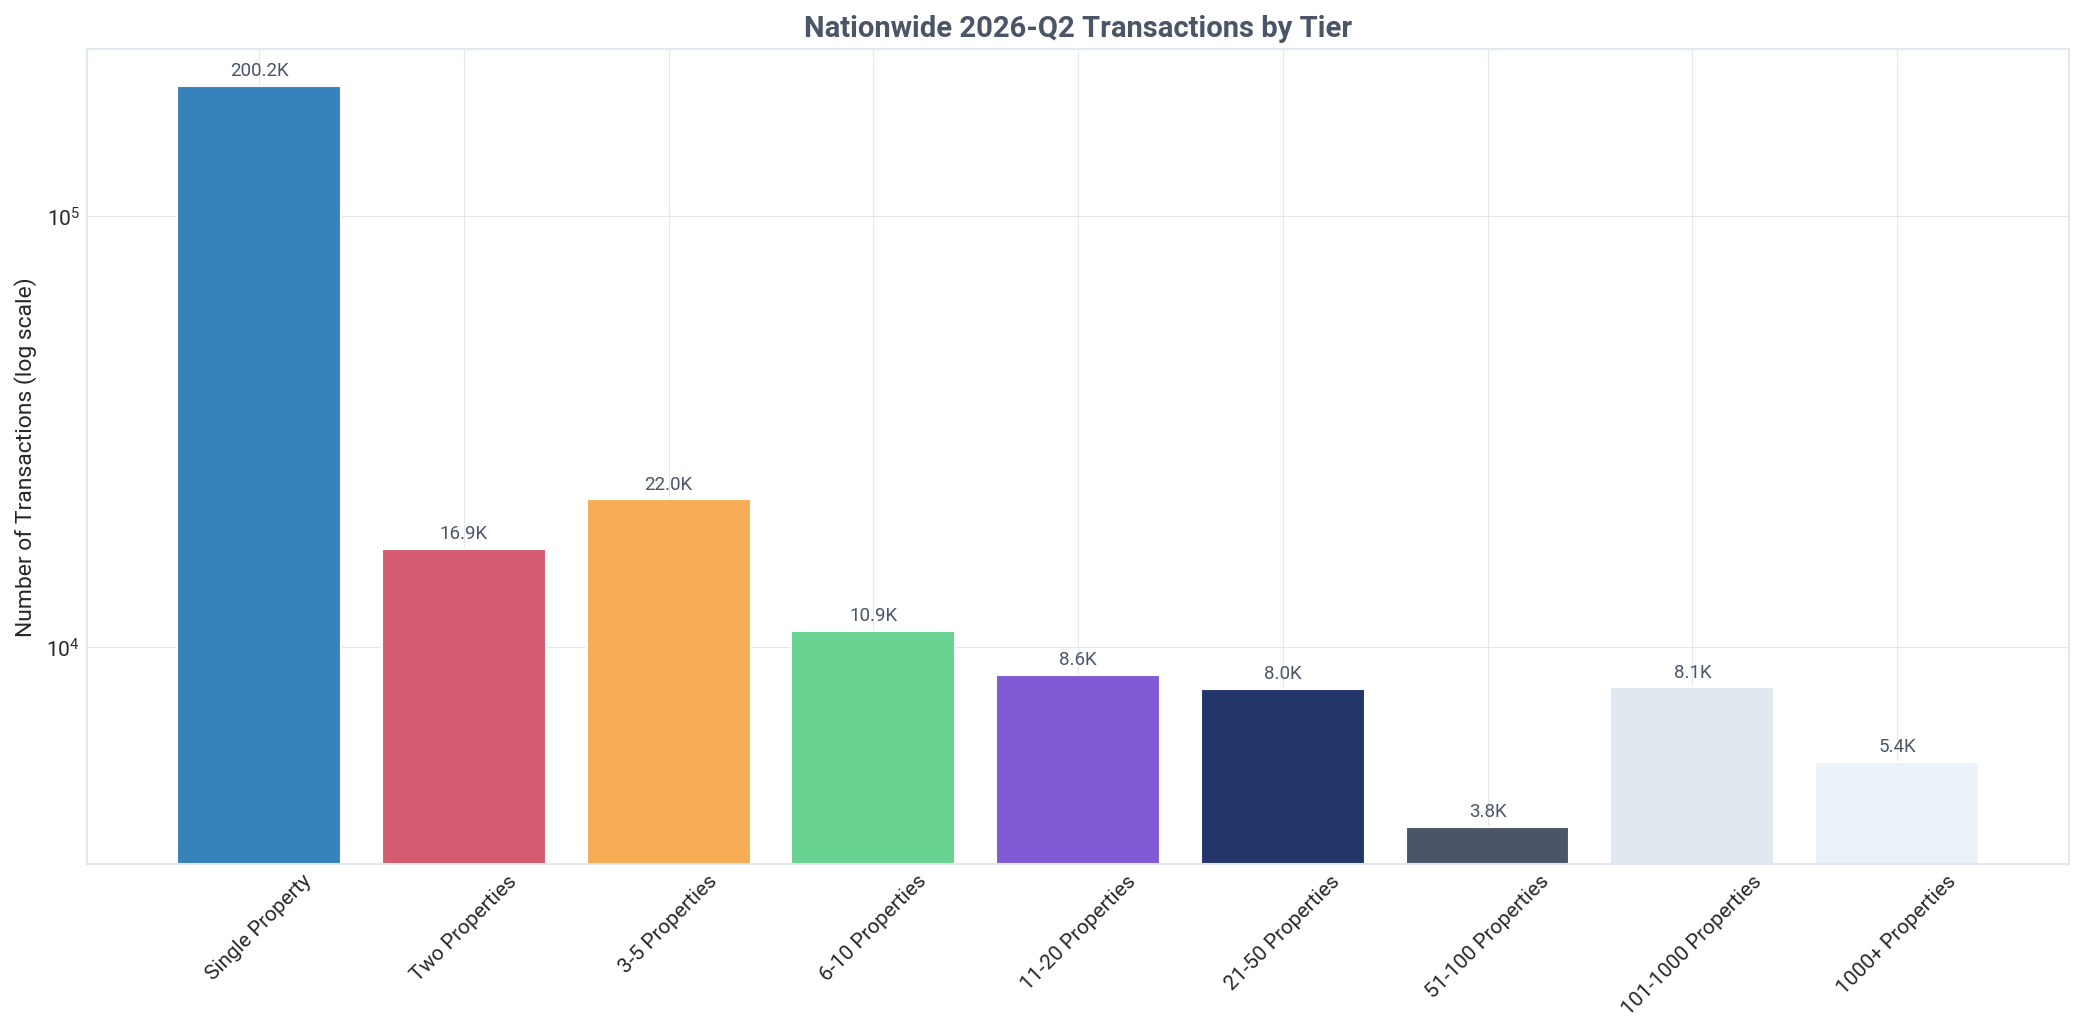
The bulk of transaction volume came from mom-and-pop investors (Tiers 01-04), who were responsible for 250,071 transactions. This is over 46 times the 5,430 transactions conducted by institutional firms, reinforcing that market activity, like ownership, is concentrated among smaller players.

United States: landlord share of transactions, Q2 2026
United States: transactions by tier this quarter, Q2 2026
United States: average purchase price by tier, Q2 2026

Ready to leverage this data for your real estate investment decisions?

TALK TO AN EXPERT

Executive Summary

Small Landlords Drive Market with 91% Ownership as Institutions Become Net Sellers
Holdings
Nationwide, landlords own 15,383,022 single-family residential properties, representing 17.7% of the total market. Individual investors are the dominant force, holding 76.7% (11,793,129 properties) of the portfolio, while companies own the remaining 25.9% (3,986,346 properties).
Pricing
In Q2 2026, landlords acquired properties for 8.2% less than traditional homeowners, an average discount of $42,215 per property ($473,673 vs. $515,888). This price advantage for investors has steadily widened from just 2.1% in Q3 2025.
Activity
Investors purchased 22.7% of all homes sold in Q2 2026, acquiring 220,102 properties. This activity was fueled by new entrants, with 198,942 new single-property landlords entering the market.
Market Share
The investor market is overwhelmingly controlled by small operators, with mom-and-pop landlords (1-10 properties) owning 90.9% of all investor-held SFRs. In contrast, institutional investors (1,000+ properties) control just 2.1% of the portfolio.
Ownership Type
Individual investors dominate smaller portfolios, but companies become the majority owners in the 6-10 property tier, where they hold a 55.3% share. This trend accelerates in larger tiers, with companies owning over 97% of portfolios with 101-1,000 properties.
Transactions
While landlords overall are strong net buyers, acquiring 3.6 properties for every one they sold in Q2 2026 (284,068 buys vs. 78,616 sells), institutional investors are actively divesting. The 1,000+ property tier was a net seller, offloading 1,737 more properties than they purchased.
Market Narrative

Across the United States, the single-family rental market is fundamentally shaped by small, independent operators, not large corporations. Investors own 15,383,022 SFR properties, comprising 17.7% of the national housing stock. The composition of this ownership decisively counters the 'Wall Street landlord' narrative; individual investors own 76.7% of these homes, and 'mom-and-pop' landlords with 1-10 properties control a staggering 90.9% of the entire investor portfolio. In contrast, institutional firms with over 1,000 properties own just 2.1%, revealing a highly decentralized market structure.

Investor behavior in Q2 2026 highlights a significant divergence in strategy between large and small players. Landlords as a whole were highly active, purchasing 22.7% of all homes sold while securing an 8.2% average price discount compared to traditional homeowners. This activity was propelled by an influx of new mom-and-pop investors. However, the market's largest institutional players moved in the opposite direction. While smaller investors were net buyers, institutional firms were net sellers, continuing a year-long trend of divesting assets. This suggests a strategic shift or profit-taking by large firms, with smaller investors absorbing the inventory and driving market expansion.

This dynamic creates a market defined by grassroots growth and institutional consolidation. The data indicates that the path to becoming a landlord remains highly accessible, but scaling into a large-scale enterprise brings different behaviors, including sourcing properties from other landlords at steep discounts. For the broader housing market, this means that while investors are a major source of demand, that demand is primarily driven by millions of small, local players, a critical distinction for policymakers and industry observers analyzing the future of housing. These findings are consistent with trends seen in our other market reports dashboard.

About This Report

Report Methodology

This report analyzes BatchData's Investor Pulse dataset, covering single-family residential (SFR) investor activity across the United States.

Data is extracted from 15 CSV files covering ownership, transactions, and pricing trends, then analyzed using AI-powered insights.

Property Counting Methodology:

Distinct Counts: All headline totals represent distinct properties. If 2+ landlords co-own the same property, it's counted only once. This provides accurate market representation.

Category Breakdowns: When analyzing by tier (01-09), owner type (Individual/Corporate), or occupancy status, properties with co-ownership across categories are counted once per category. This causes breakdowns to sum 2-4% higher than totals, and percentages may sum to 100-104%. This is expected and reflects co-ownership patterns.

Tier Properties Category
01-041-10Mom-and-Pop
05-0711-100Mid-Size
08101-1000Large
091000+Institutional
About BatchData

BatchData provides comprehensive real estate data and analytics, offering insights into property ownership, investor activity, and market trends across the United States.

The Investor Pulse dataset tracks single-family residential (SFR) investor behavior at national, state, county, and MSA levels.

For more information, visit batchdata.io or explore our API documentation.

Data Freshness
Report Generated October 28, 2026 at 11:10 PM
Data Period Q2 2026
Geography Level National
Geography United States
×
Chart Section2 Coverage
United States: SFR vs other property coverage, Q2 2026
×
Chart Section3 Ownership Donut
United States: SFR ownership share, company vs individual, Q2 2026
×
Chart Section3 Ownership Bar
United States: SFR properties by owner type, Q2 2026
×
Chart Section4 Distribution
United States: company vs individual landlords, Q2 2026
×
Chart Section5 Holdings
United States: landlord SFR holdings by type, Q2 2026
×
Chart Section6 Prices
United States: properties purchased by timeframe, Q2 2026
×
Chart Section6 Prices Alt
United States: average acquisition price by timeframe, Q2 2026
×
Chart Section6 Yoy Comparison
United States: average acquisition price year over year, Q2 2026
×
Chart Section6 Trends
United States: average acquisition price by buyer type, Q2 2026
×
Chart Section7 Purchases
United States: purchases by tier, Q2 2026
×
Chart Section7 Tiers
United States: purchased property share by tier, Q2 2026
×
Chart Section8 Distribution
United States: current ownership by purchase tier, Q2 2026
×
Chart Section8 Prices
United States: properties purchased by tier, all time, Q2 2026
×
Chart Section8 Prices Q4
United States: properties purchased by tier this quarter, Q2 2026
×
Chart Section8 Prices 2020
United States: properties purchased by tier, historical, Q2 2026
×
Chart Section8 Yoy Comparison
United States: properties purchased by tier year over year, Q2 2026
×
Chart Section9 Ownership
United States: ownership by tier and owner type, Q2 2026
×
Chart Section9 Growth
United States: company purchases by tier, all time, Q2 2026
×
Chart Section9 Growth Q4
United States: company purchases by tier this quarter, Q2 2026
×
Chart Section9 Yoy Comparison
United States: company purchases by tier year over year, Q2 2026
×
Chart Section10 Top Regions
United States: top 15 areas by landlord-owned properties, Q2 2026
×
Chart Section10 Top Pct
United States: top 15 areas by landlord ownership share, Q2 2026
×
Chart Section10 Map
United States: landlord ownership map, Q2 2026
×
Chart Section11 Buysell
United States: landlord buy and sell transactions, Q2 2026
×
Chart Section11 Buysell Price
United States: landlord average buy and sell prices, Q2 2026
×
Chart Section11 Yoy All Landlords
United States: landlord transactions year over year, Q2 2026
×
Chart Section11 Institutional
United States: 1000+ tier company transactions, Q2 2026
×
Chart Section11 Institutional Price
United States: 1000+ tier company average prices, Q2 2026
×
Chart Section11 Yoy Institutional
United States: 1000+ tier transactions year over year, Q2 2026
×
Chart Section12 Transactions
United States: landlord share of transactions, Q2 2026
×
Chart Section12 Prices
United States: transactions by tier this quarter, Q2 2026
×
Chart Section12 Prices Detail
United States: average purchase price by tier, Q2 2026

Licensing & Usage Rights

This report, data, and all visual analyses are the property of BatchData © 2026 BatchService, Inc. and are licensed under Creative Commons Attribution-NonCommercial-NoDerivatives 4.0 International (CC BY-NC-ND 4.0).

You MAY: Download, share, or excerpt this content for personal or non-commercial purposes, provided you give clear attribution to BatchData with a link back to this original page.

You MAY NOT: Use this data commercially, resell or redistribute it as your own, or publish modified versions.

For commercial licensing: batchdata.io/contact-sales

Creative Commons BY-NC-ND 4.0 - creativecommons.org/licenses/by-nc-nd/4.0/

How to cite this report

BatchData. (2026). Q2 2026 National Report. BatchService, Inc. Retrieved from https://reports.batchdata.io/investorpulse-reports/2026-q2-national/. Licensed under CC BY-NC-ND 4.0.