Rhode Island Investor Pulse Report (2026-Q2)

Real Estate comprehensive investment analysis of investor activity in the Rhode Island single-family residential housing market. Discover ownership trends, transaction patterns, and market insights.

Market Overview

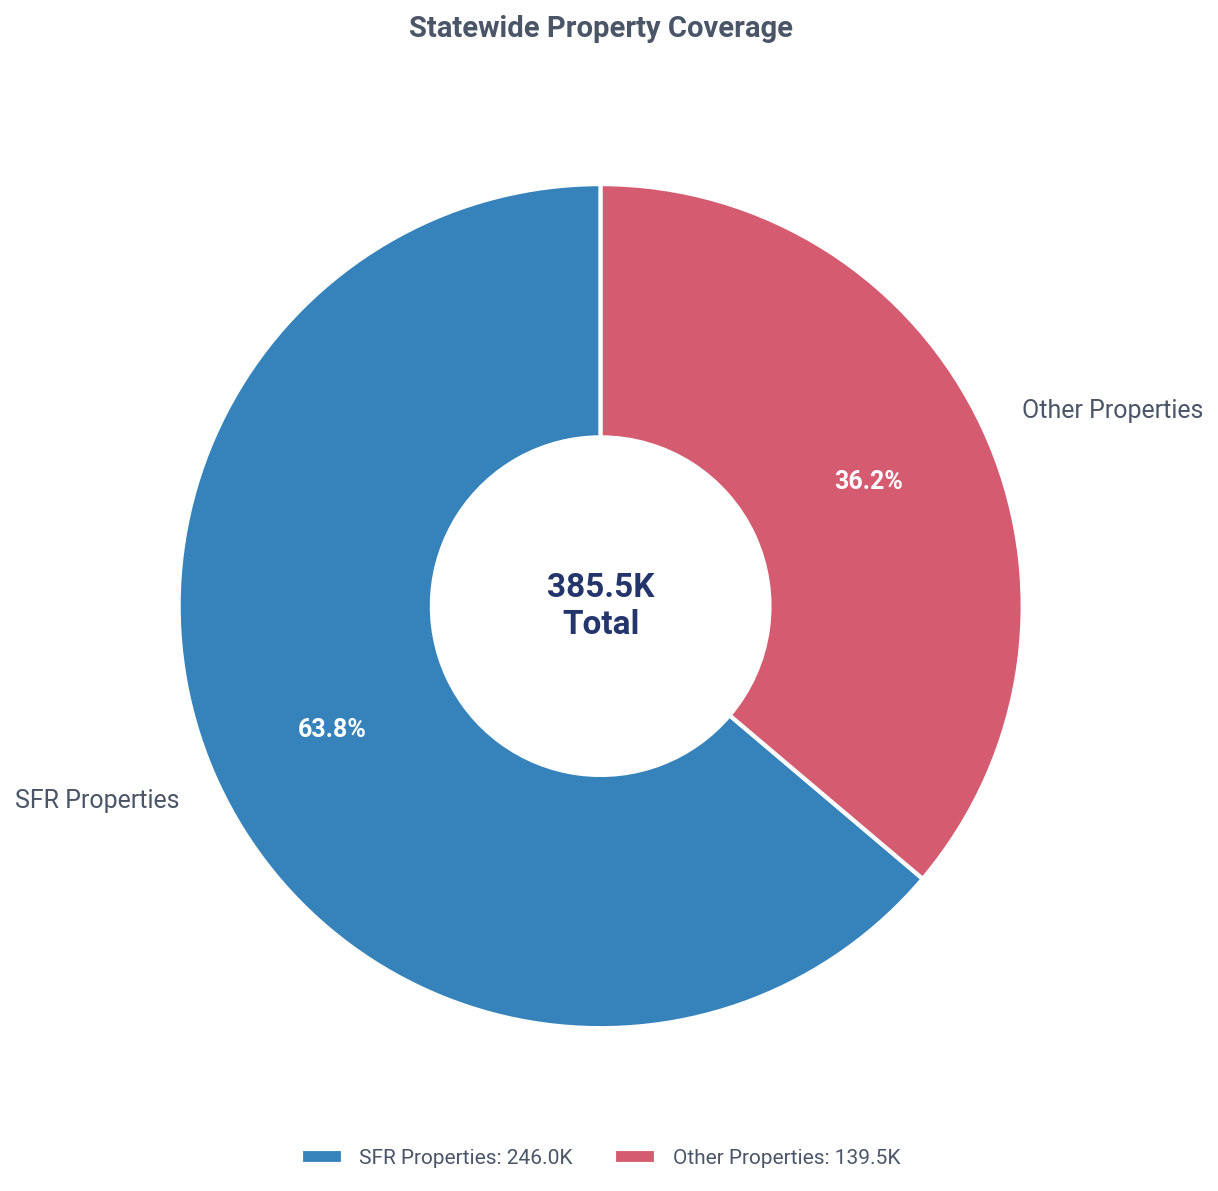
Total SFR Properties in Rhode Island
246,049
Total Investors in Rhode Island
40,386
Investor Owned SFR in Rhode Island
29,043(11.8%)
Individual Landlords
Landlords
36,559
SFR Owned
25,407
Corporate Landlords
Landlords
3,827
SFR Owned
4,299
Understanding Property Counts

Distinct Count Methodology: The total 29,043 represents distinct properties - if 2+ landlords co-own the same property, it's counted only once. This provides the most accurate representation of investor-owned SFR properties.

Why totals don't sum: When broken down by Individual vs Corporate ownership (or by tier), properties with co-ownership across categories are counted once per category. For example, if a property is co-owned by an individual AND a corporate landlord, it appears in both counts. This is why Individual + Corporate totals may exceed the distinct total by 2-4%, and percentages may sum to 100-104%.

Market Visualization

Rhode Island: SFR vs other property coverage, Q2 2026
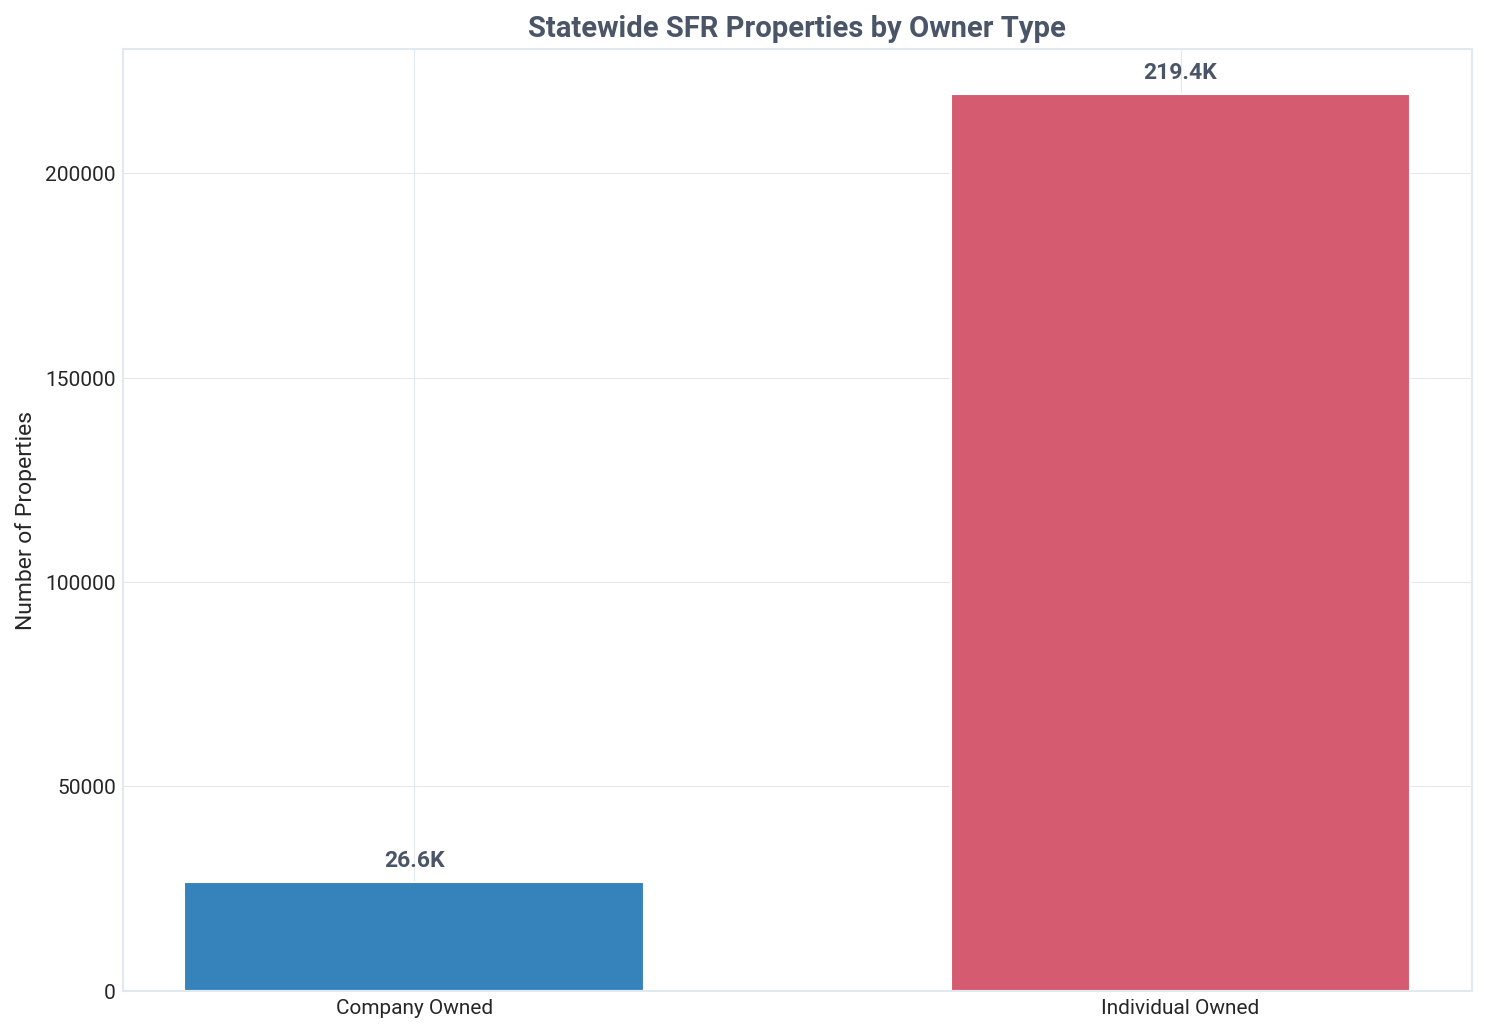
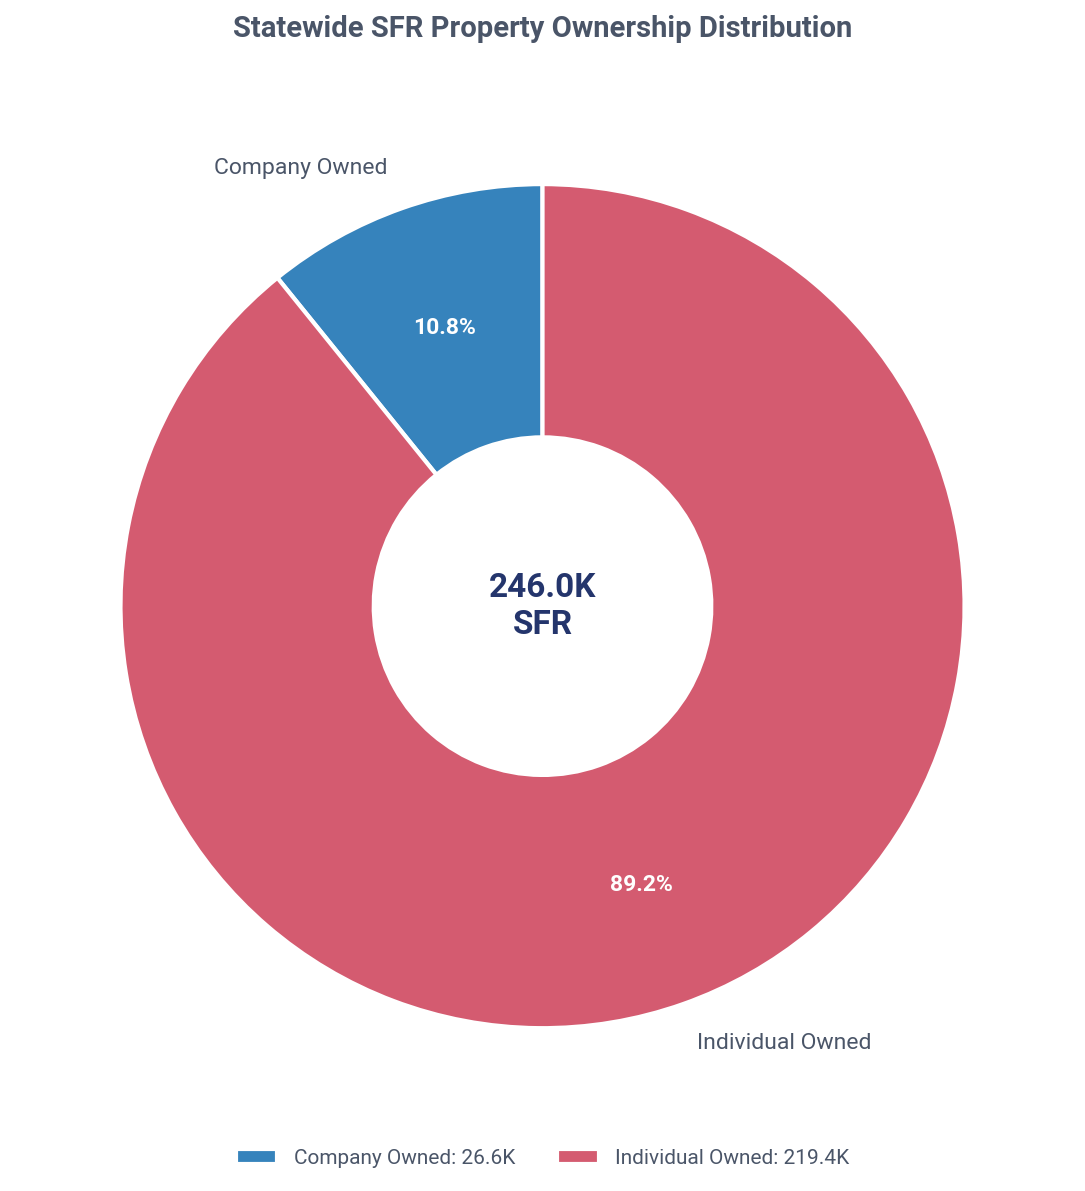
Rhode Island: SFR ownership share, company vs individual, Q2 2026
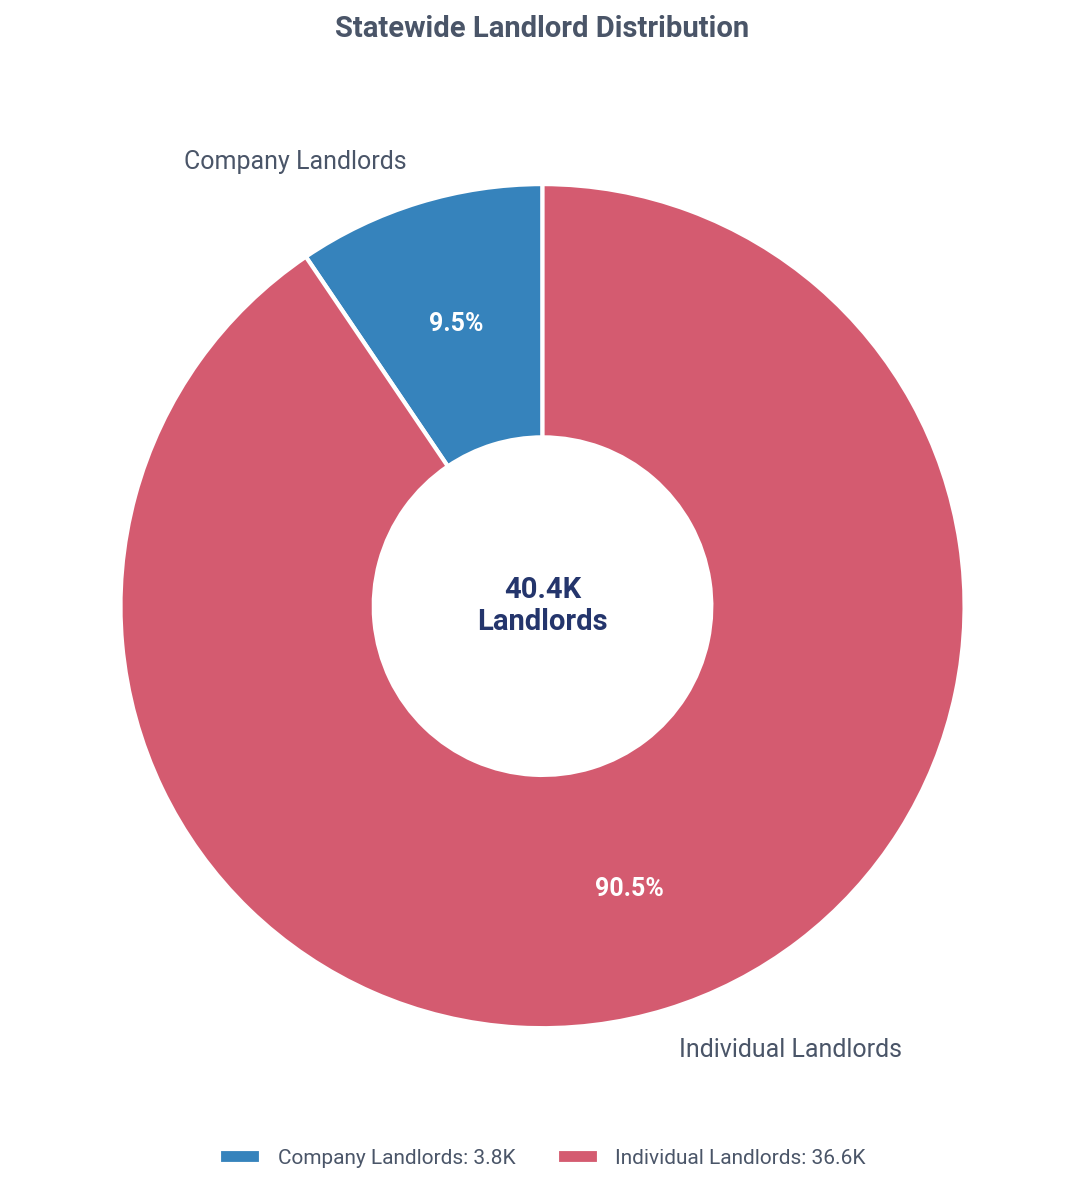
Rhode Island: company vs individual landlords, Q2 2026

Key Market Insights

Mom-and-Pop Investors Dominate Rhode Island's SFR Market, Controlling 99.3% of Properties Amidst Aggressive Buying
Investors own 11.8% of Rhode Island's SFRs, with mom-and-pop landlords (1-10 properties) accounting for a staggering 99.3% of that portfolio, while institutional ownership is virtually non-existent. In Q2 2026, landlords were aggressive net buyers, acquiring 23.0% of all homes sold at a 14.2% discount compared to traditional homeowners.
Landlord Owned Current Holdings
Investors own 29,043 SFR properties in Rhode Island, with individuals controlling 87.5% of them.
Over half (54.1%) of these properties are owned free-and-clear (cash), while 45.9% are financed. The portfolio is heavily rental-focused, with 98.7% of properties being non-owner-occupied.
Landlord vs Traditional Homeowners
In Q2 2026, Rhode Island landlords paid 14.2% less than homeowners, a $91,423 discount per property.
This discount has widened significantly from just 0.7% in Q4 2025 and reverses a trend from Q3 2025 where landlords paid a 10.2% premium. Overall, landlord acquisition prices in Q2 2026 ($554,430) are 1.6% lower than the 2020-2023 average ($563,485).
Current Quarter Purchases
Landlords acquired 23.0% of all Rhode Island SFRs sold in Q2 2026, totaling 416 properties.
Mom-and-pop landlords (1-10 properties) drove this activity, accounting for 98.8% of all investor purchases. Institutional investors (1000+) made zero acquisitions, while 453 new single-property landlords entered the market.
Ownership by Tier
Mom-and-pop landlords (1-10 properties) control an overwhelming 99.3% of investor-owned SFRs in Rhode Island.
Institutional investors (1000+) hold a negligible 0.0% share, owning just 3 properties. In Q2 2026, the smallest single-property landlords paid the highest average price ($549,973), significantly more than mid-size landlords.
Ownership by Tier & Type
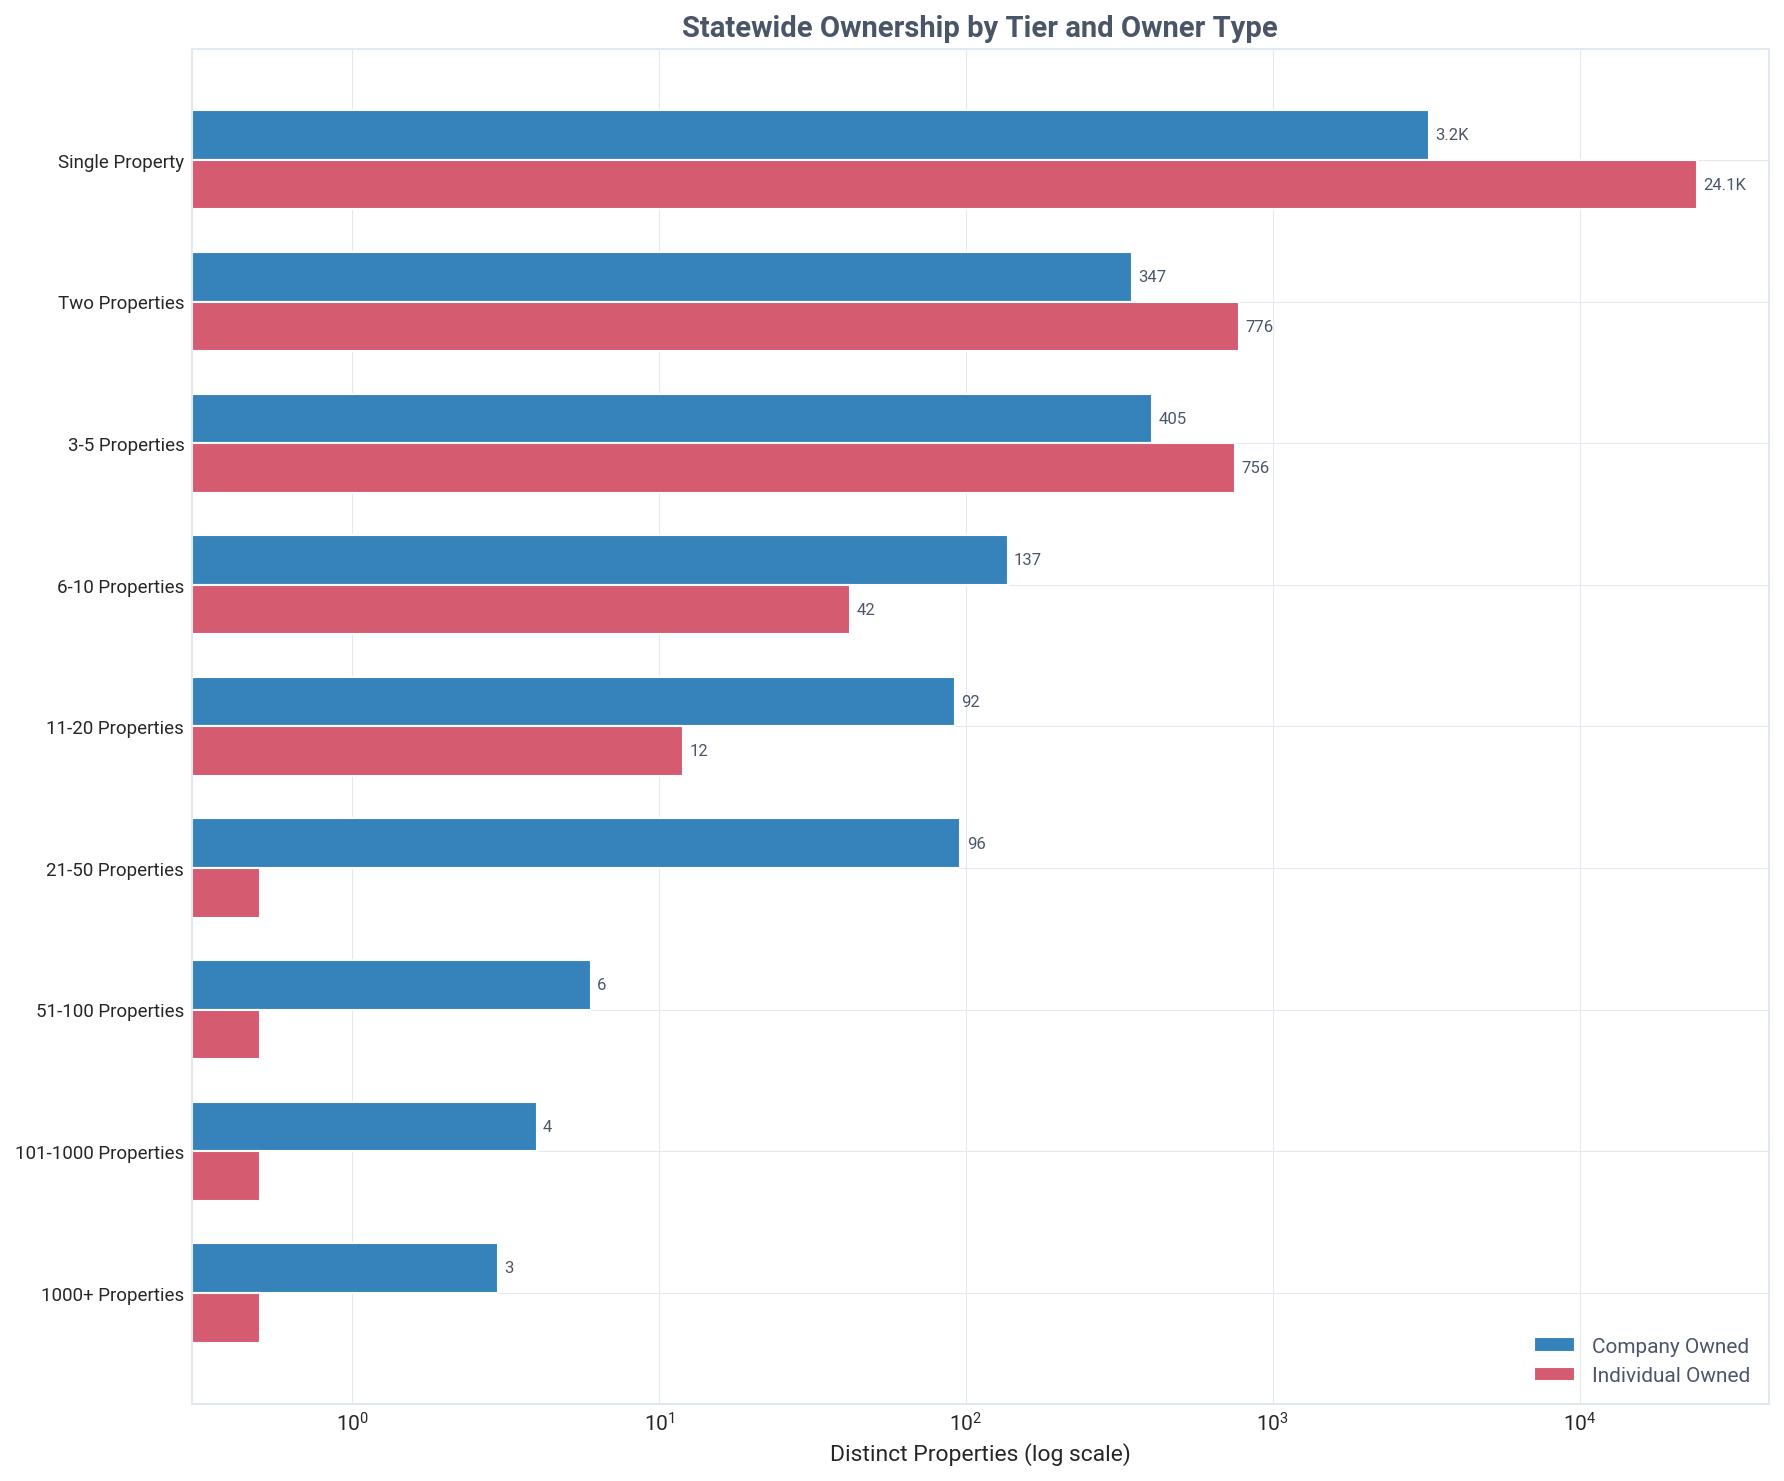
Individuals dominate small portfolios, but companies become the majority owner (76.5%) at the 6-10 property tier.
Single-property portfolios are 88.2% owned by individuals. In contrast, portfolios of 11-20 properties are 88.5% company-owned, showing a clear shift to corporate structures with scale.
Geographic Distribution
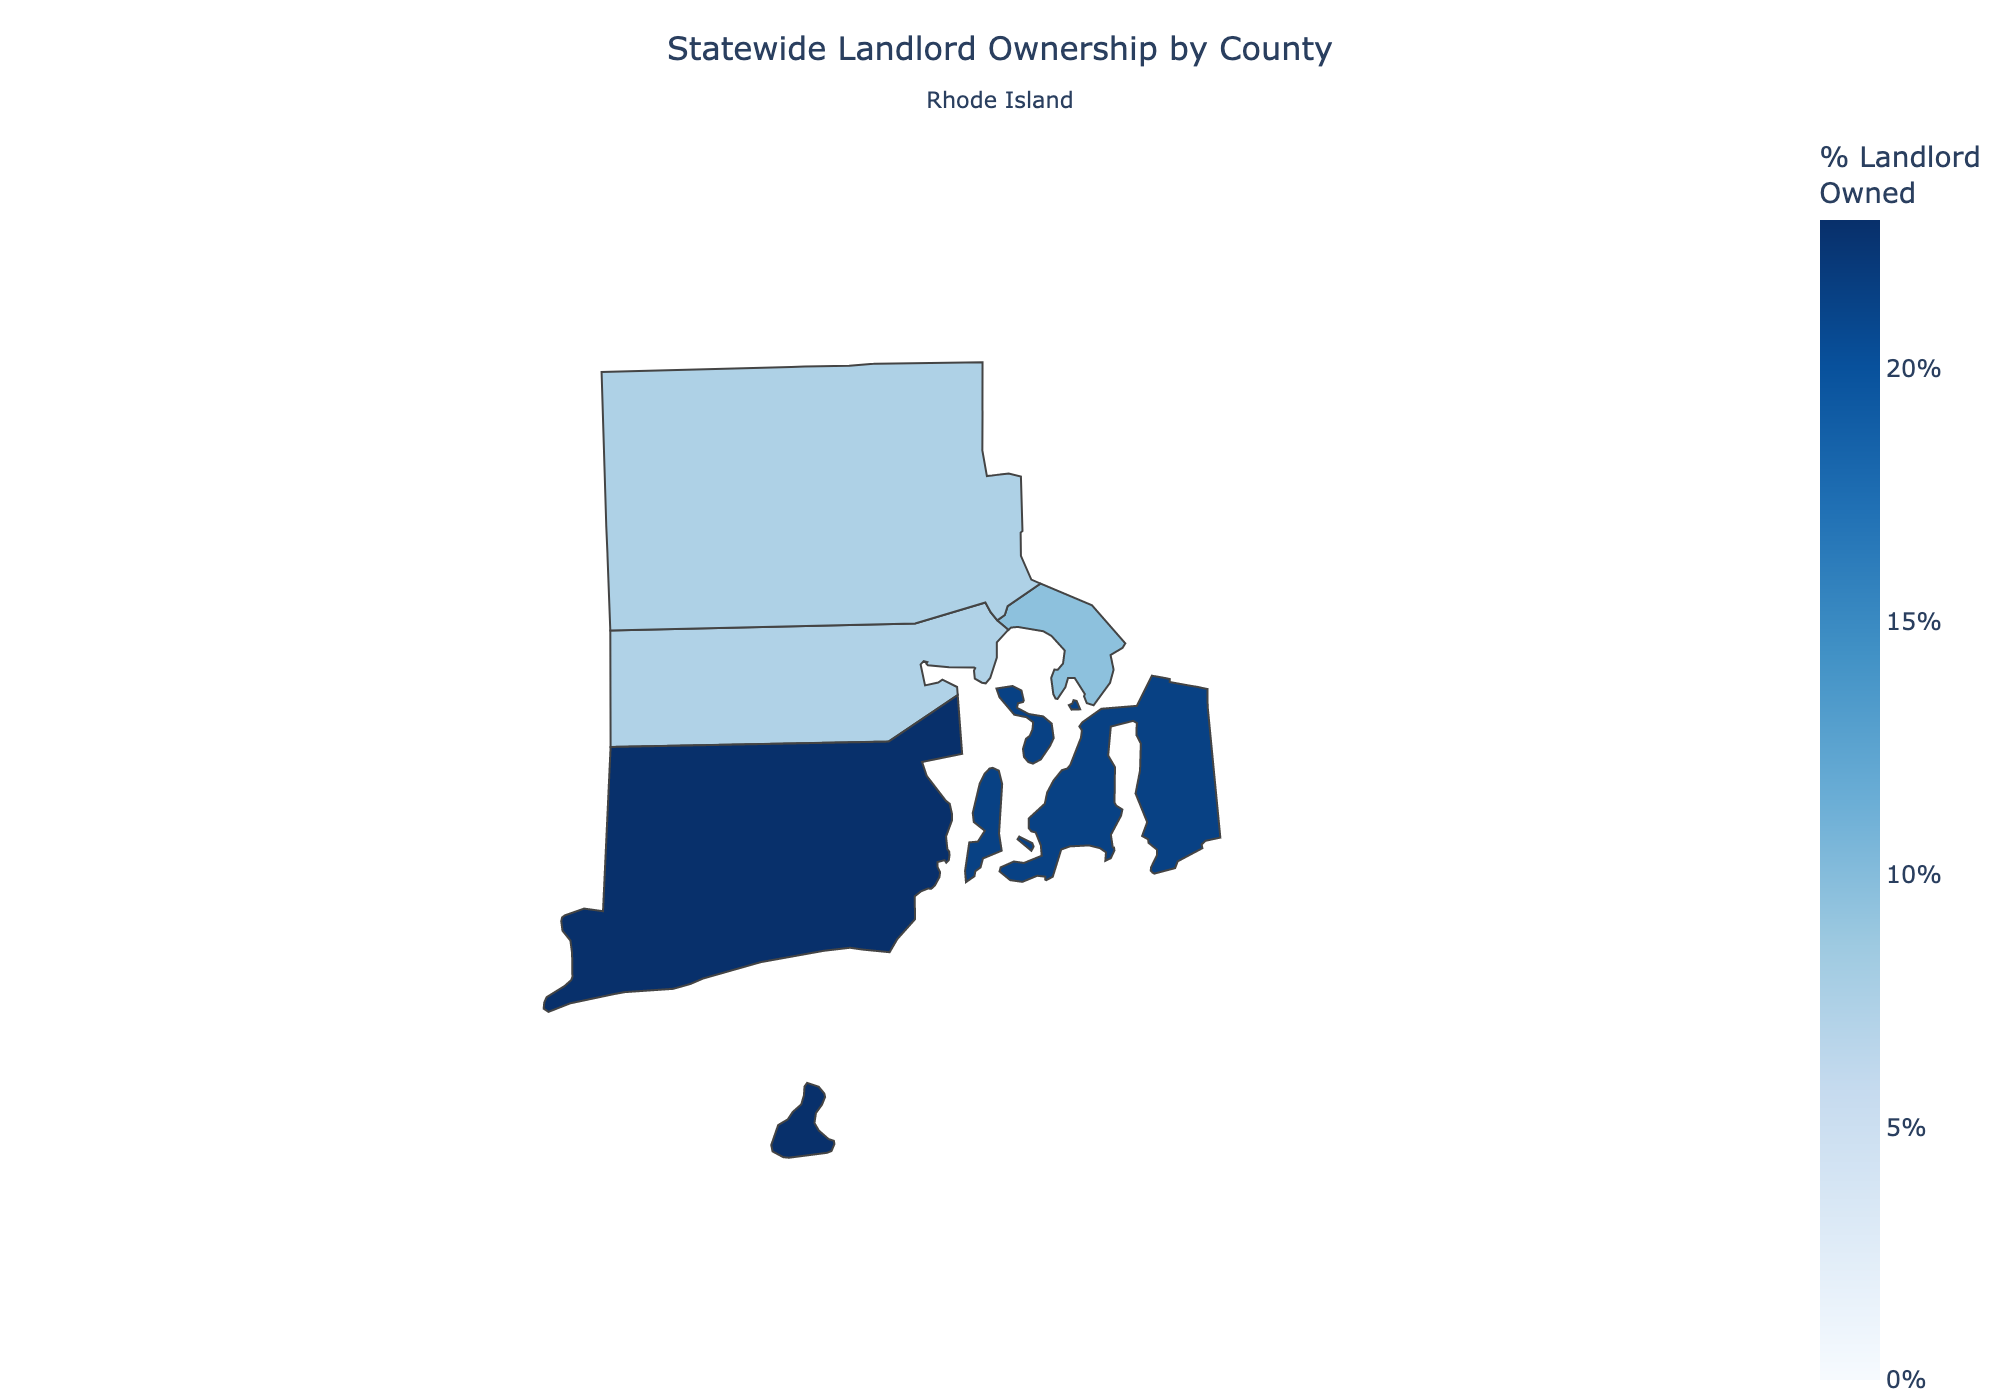
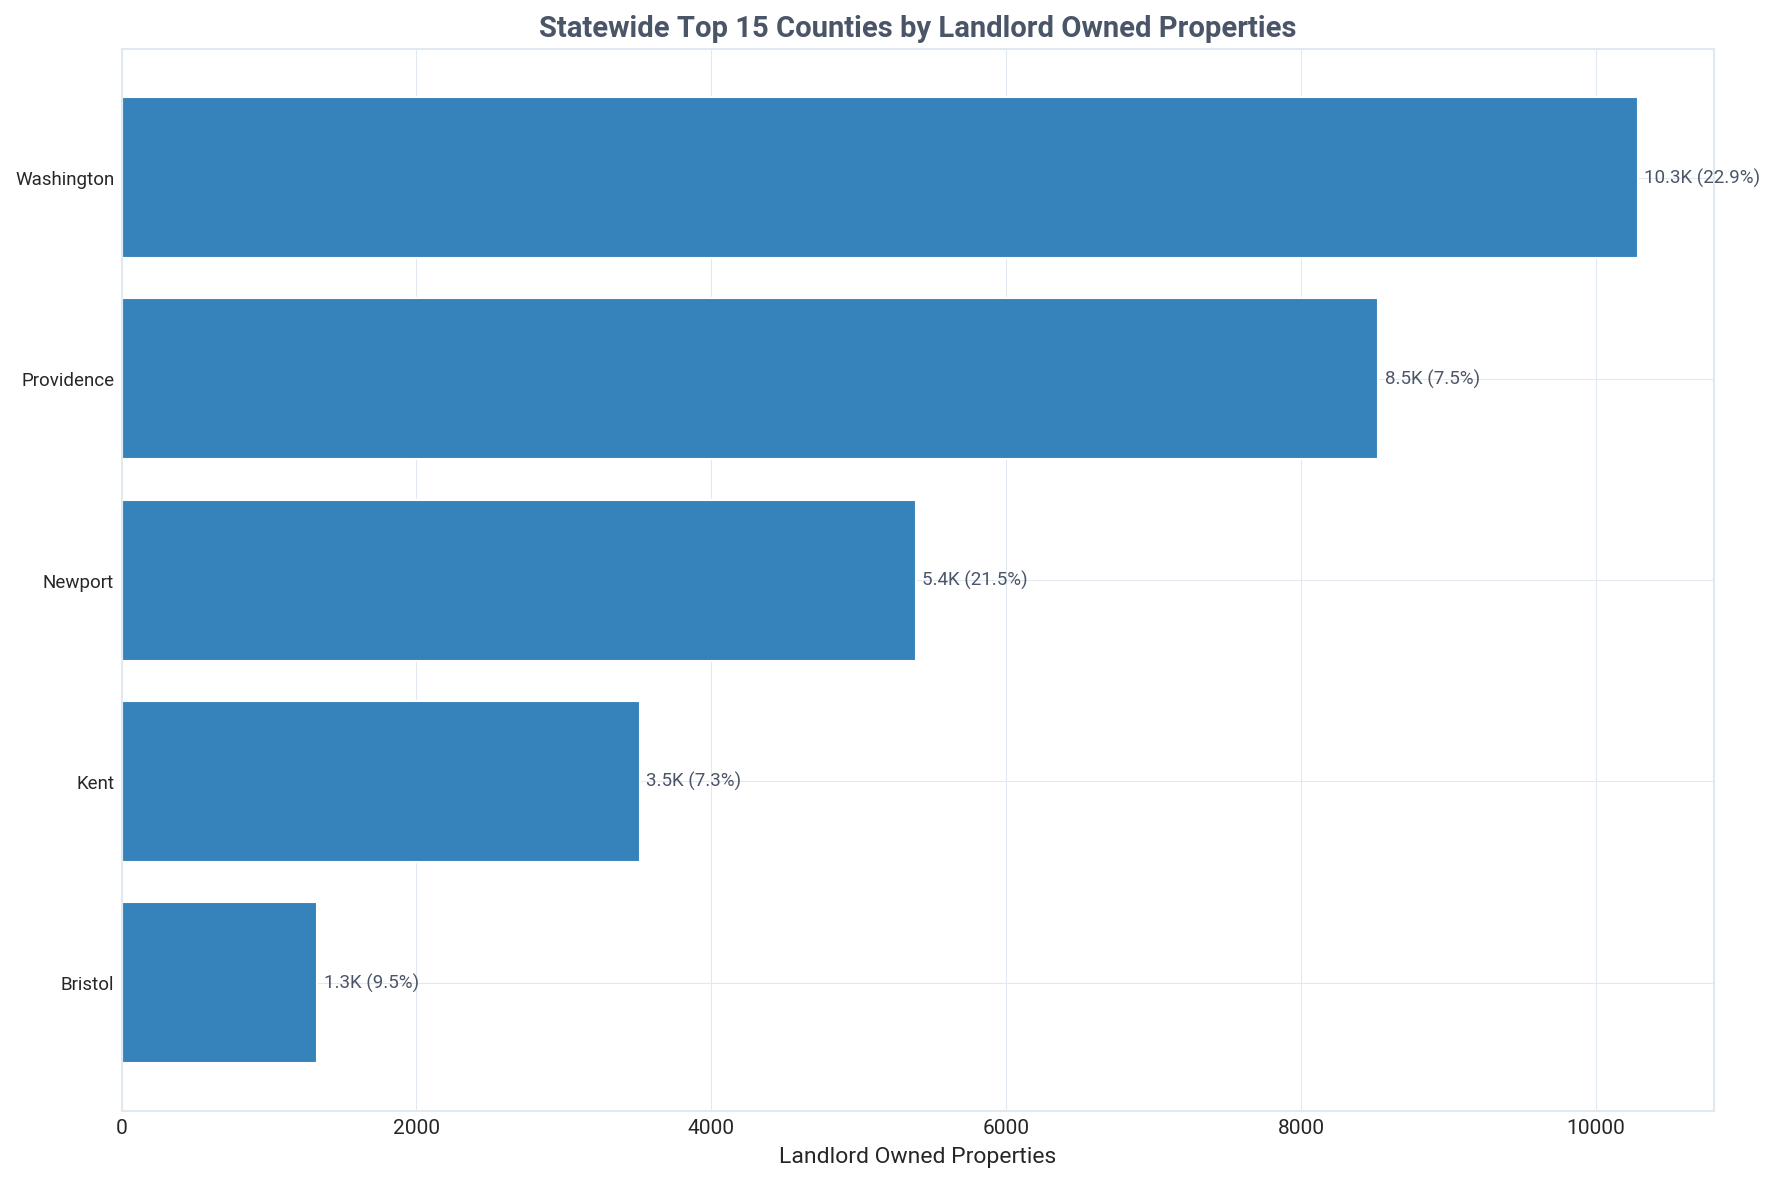
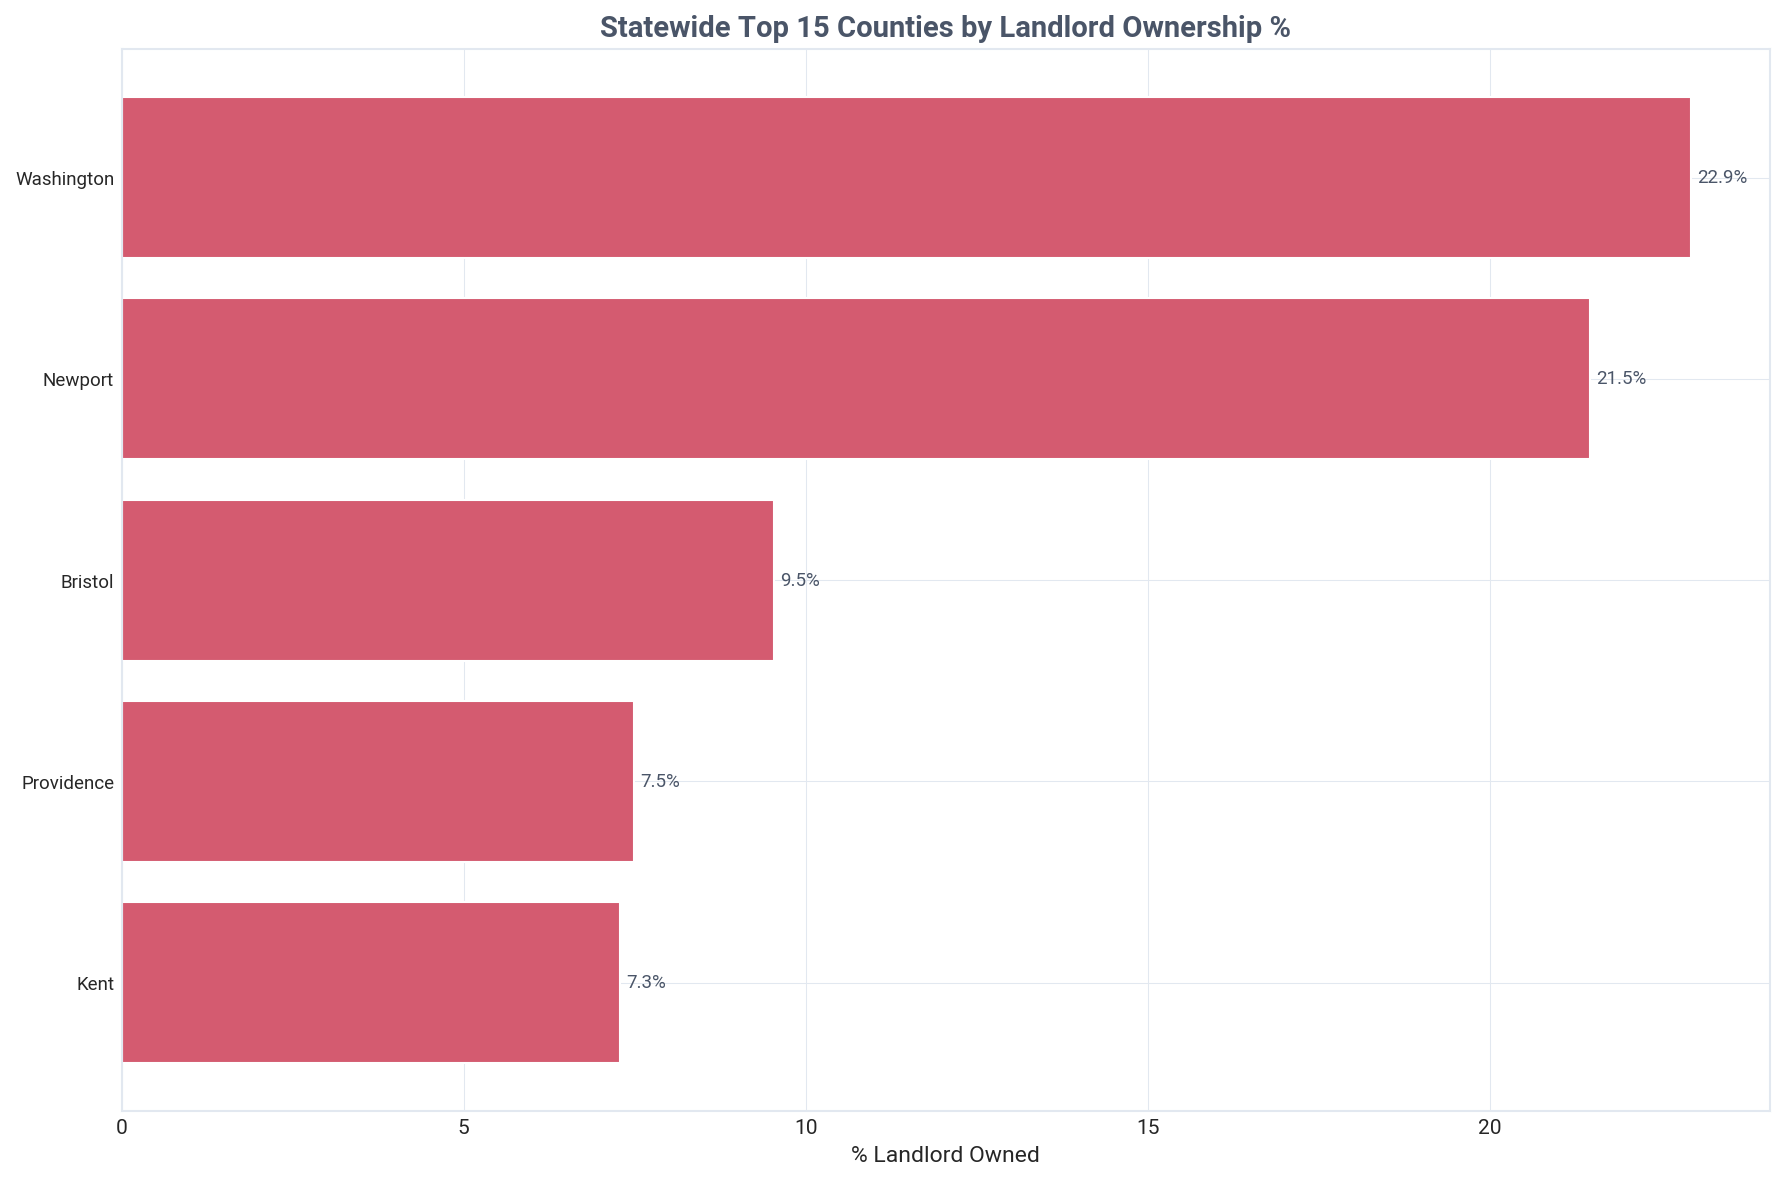
Investor activity is concentrated in Washington County, with 10,285 properties and a 22.9% ownership rate.
Newport County follows closely with a high 21.5% investor ownership rate. In contrast, Providence County has the second-highest count of investor properties (8,524) but a much lower penetration rate of just 7.5%.
Historical Transactions
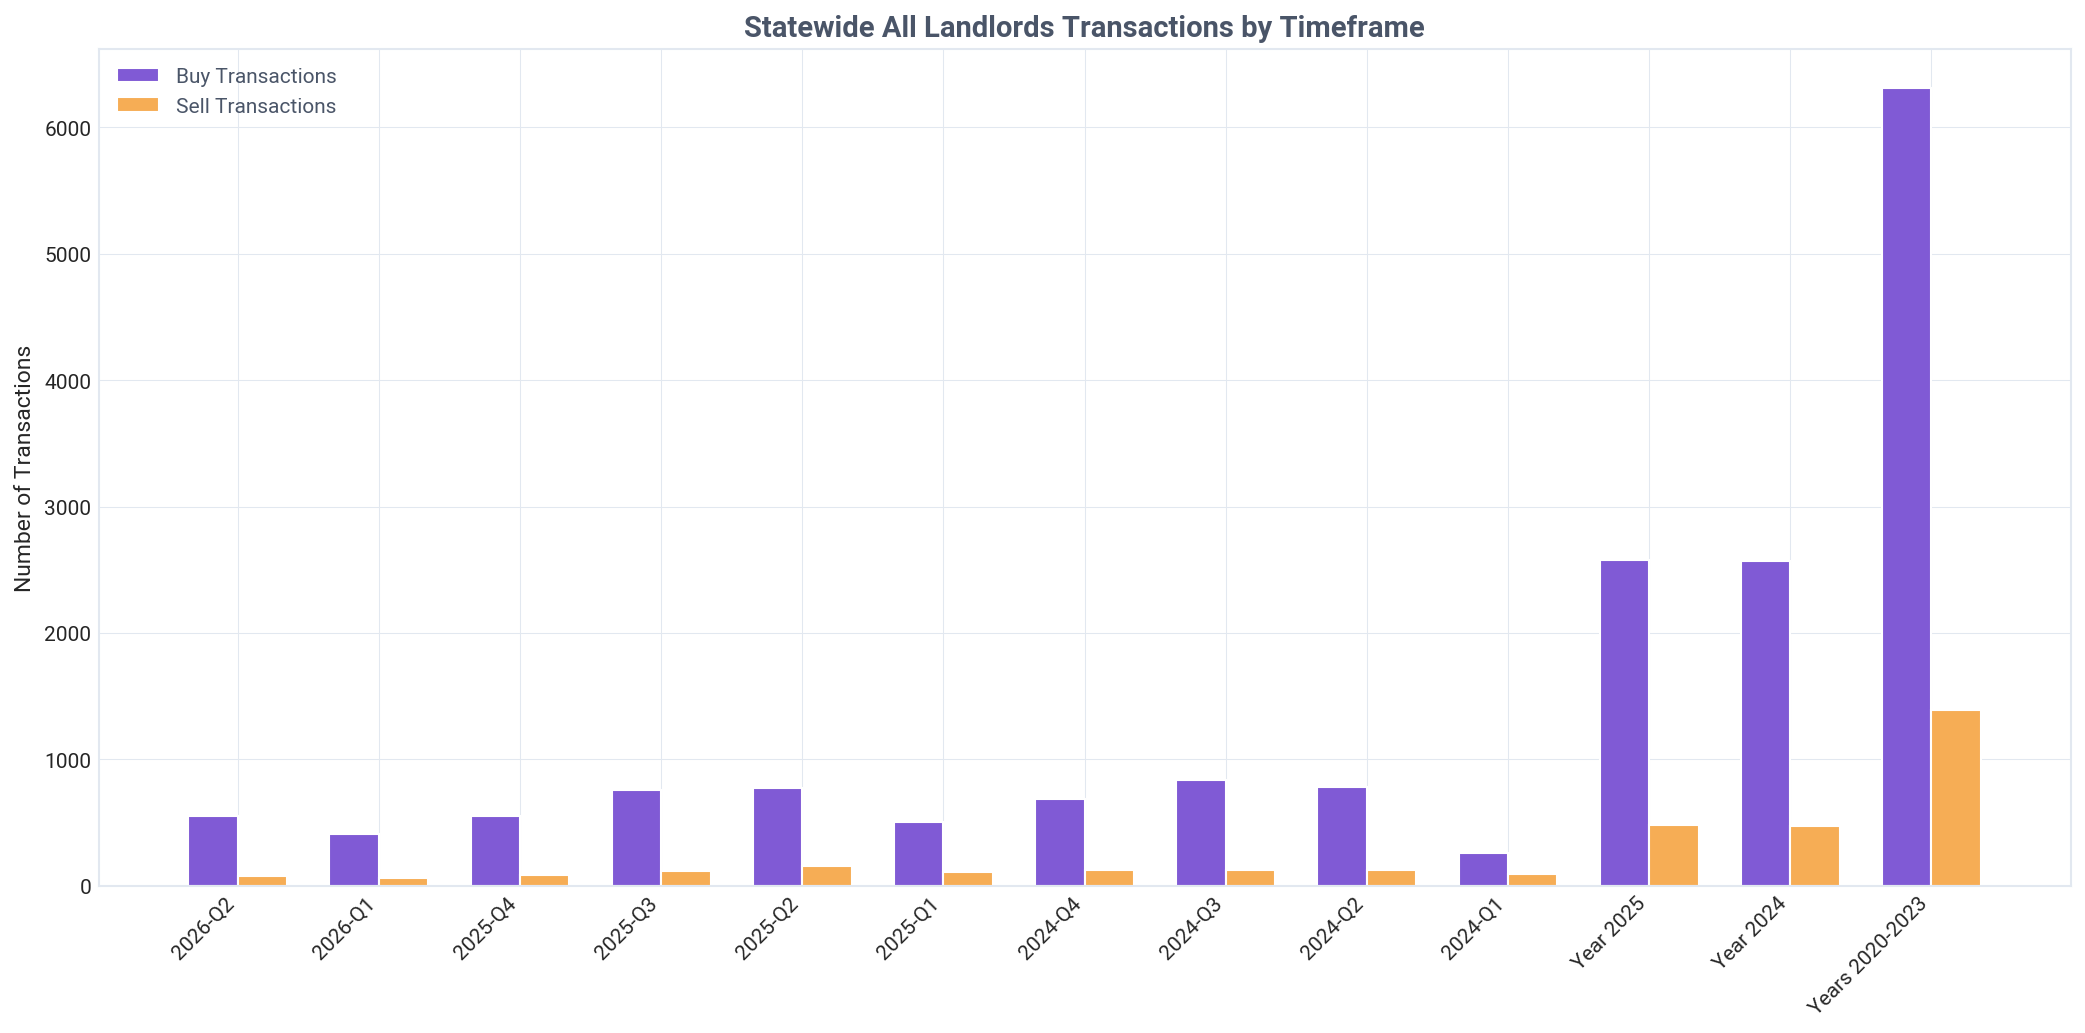
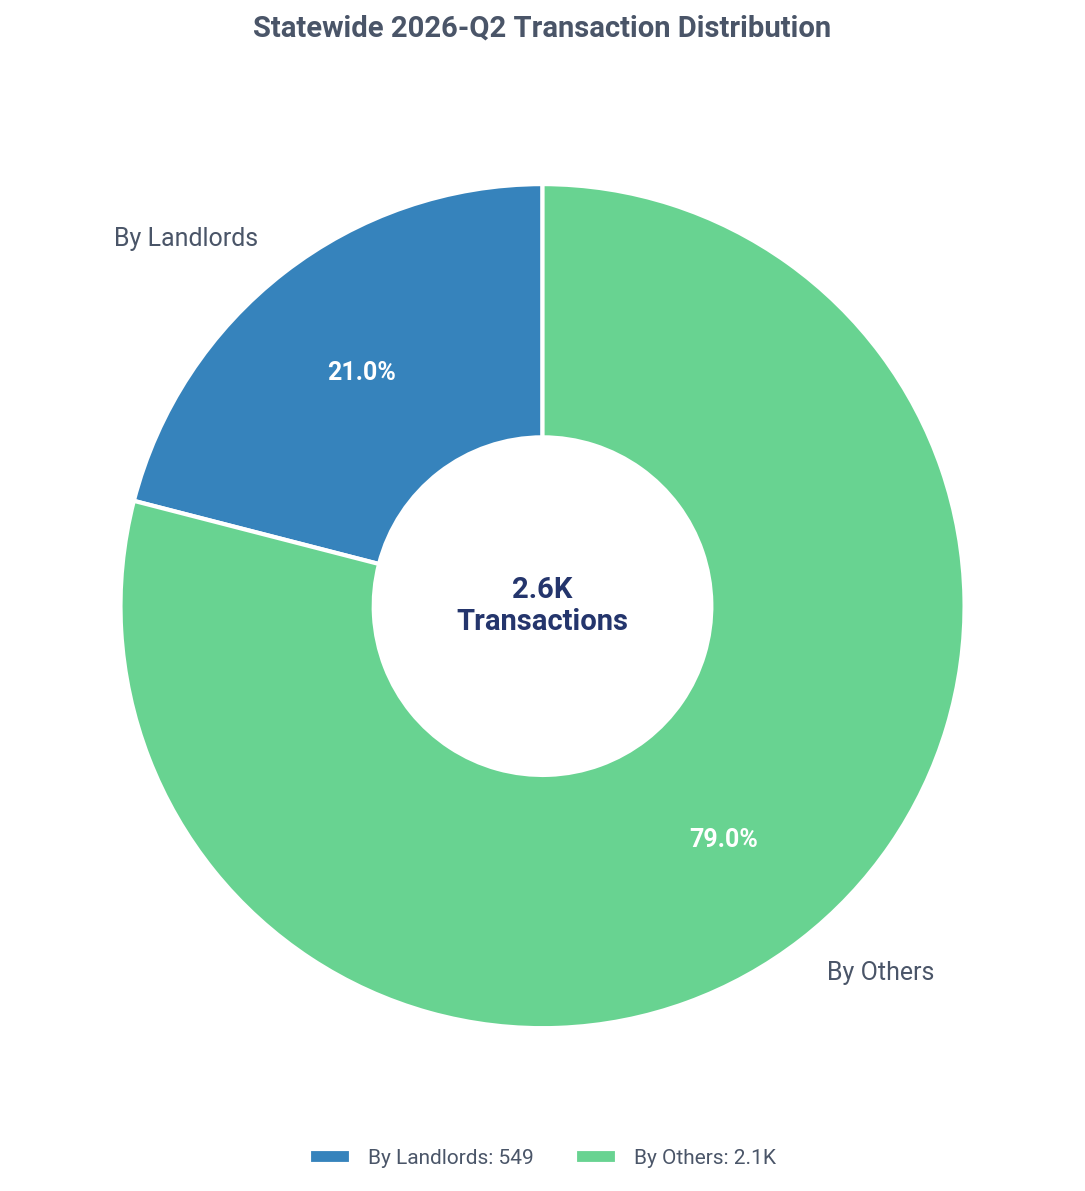
Landlords are strong net buyers, acquiring 549 properties and selling only 79 in Q2 2026.
This represents a buy-to-sell ratio of nearly 7-to-1, a pattern of aggressive accumulation that has been consistent over the past two years. There is no significant institutional transaction activity to report.
Current Quarter Transactions
Landlords were involved in 21.0% of all SFR transactions in Q2 2026, totaling 549 transactions.
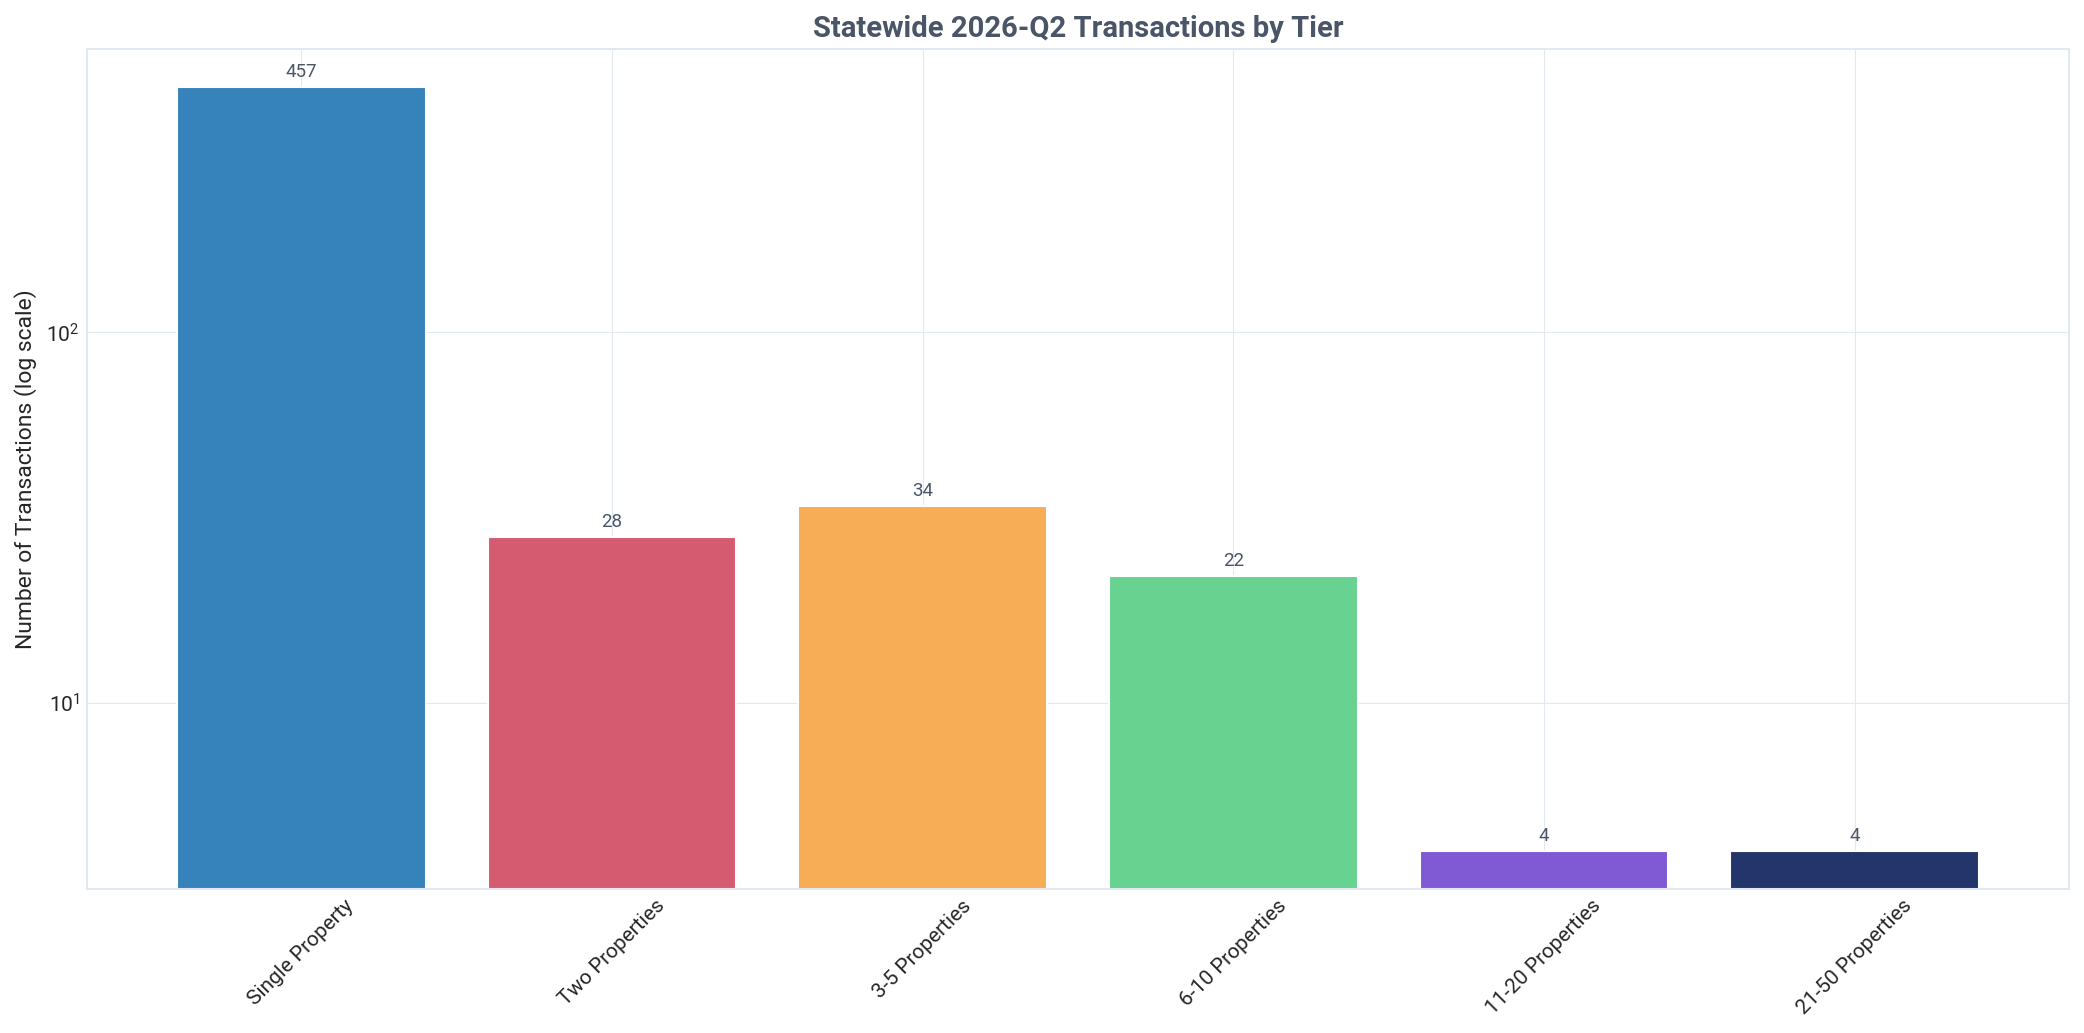
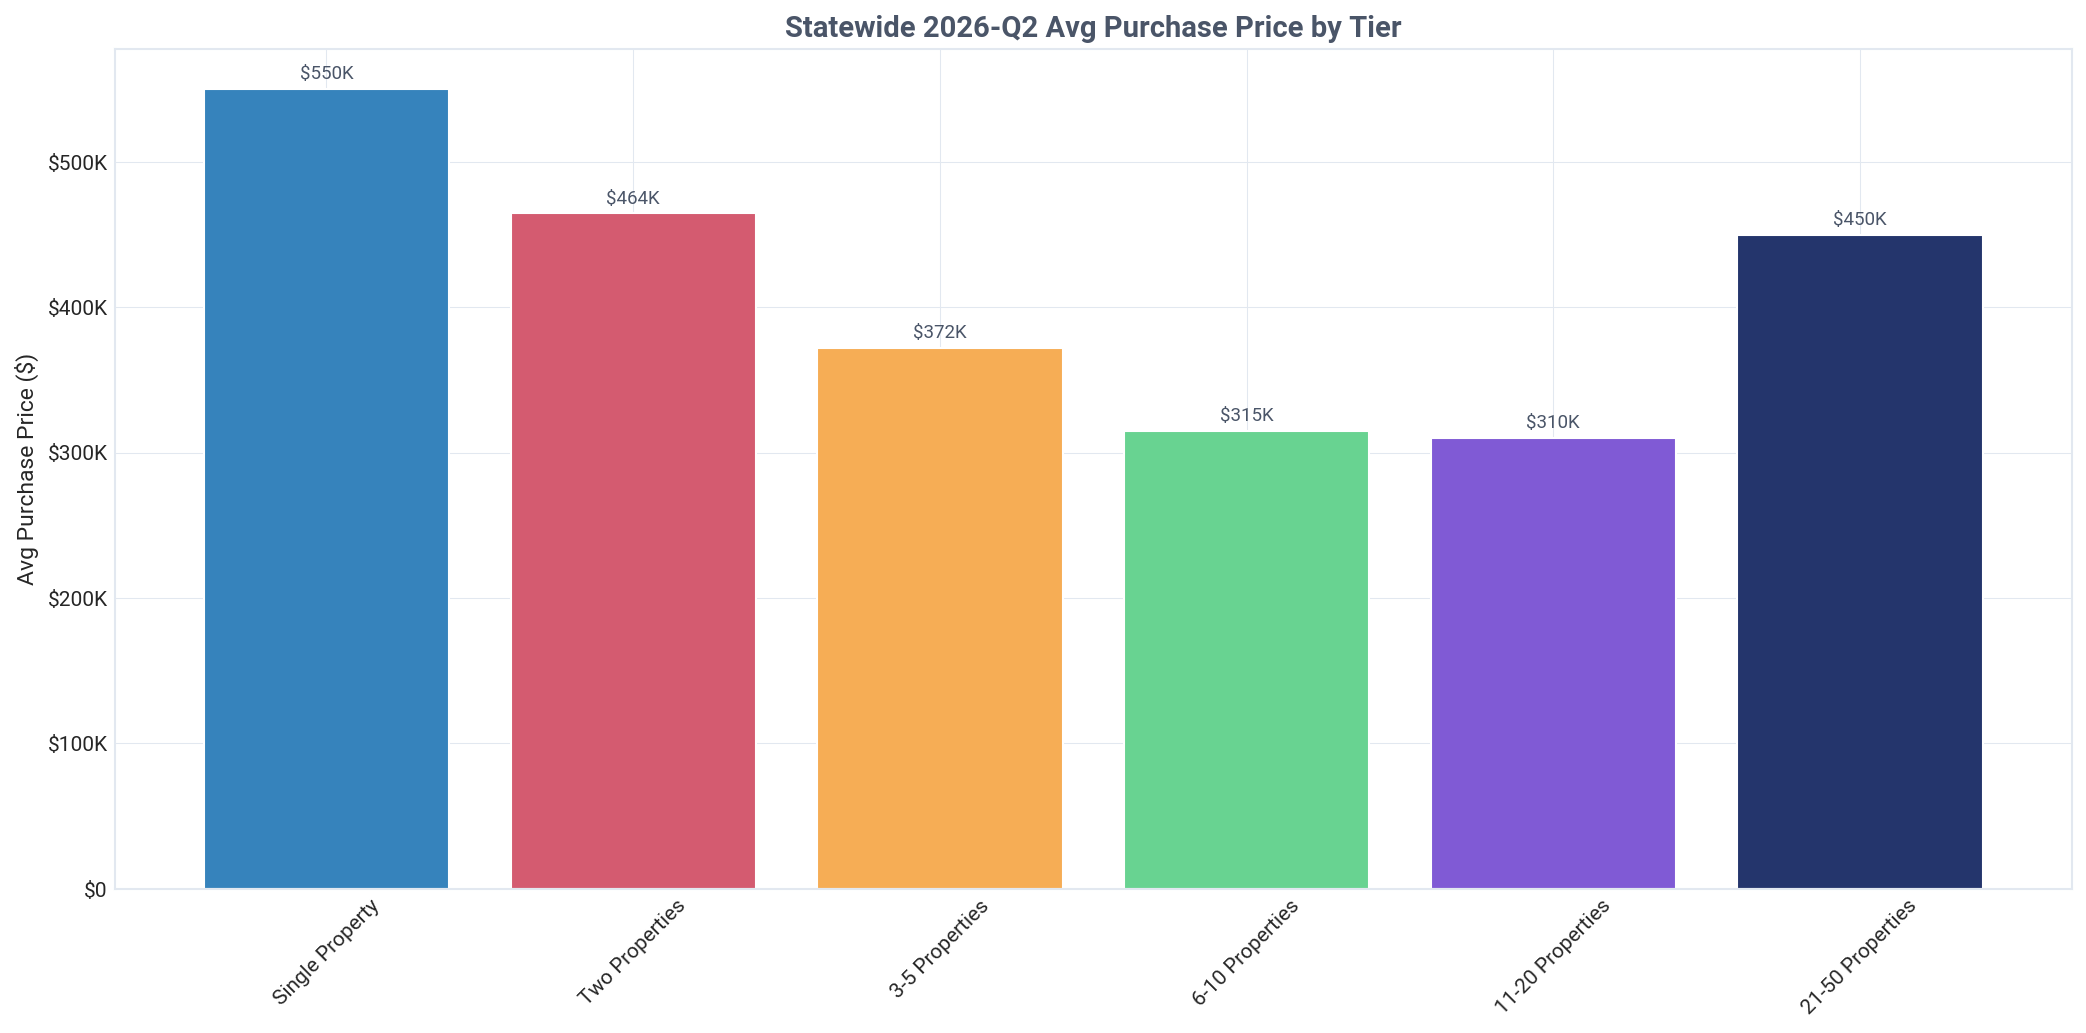
Single-property investors paid the highest average price at $549,973, which is $234,869 more than landlords in the 6-10 property tier. Only 7.2% of single-property landlord purchases came from other landlords, indicating they are primarily buying from homeowners.

Want deeper insights tailored to your investment strategy?

TALK TO AN EXPERT

Current Holdings Portfolio

Analysis of landlord property holdings by type, financing method, and owner category

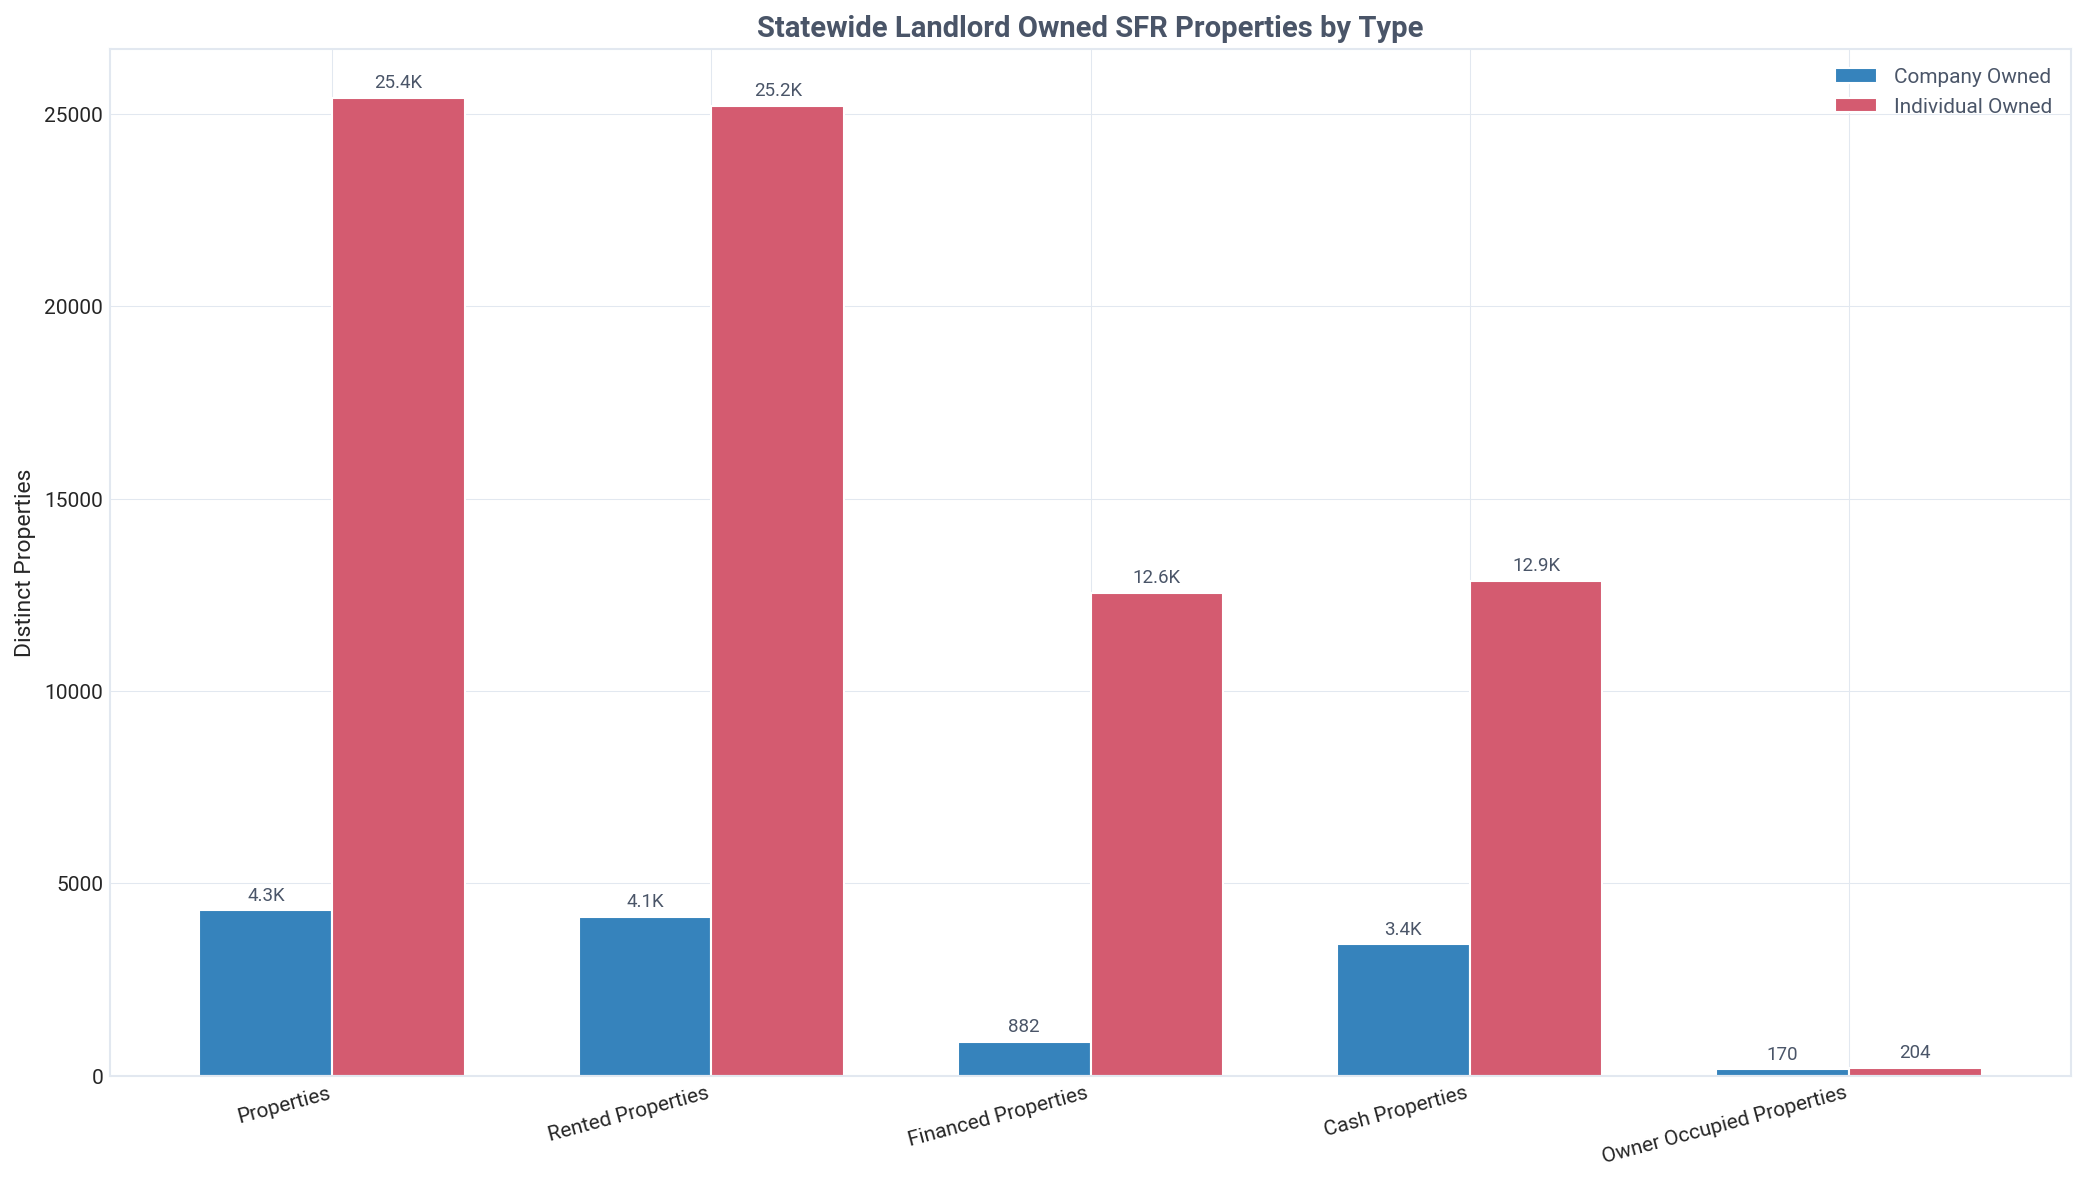
Rhode Island: landlord SFR holdings by type, Q2 2026
Key Insight
Investors own 29,043 SFR properties in Rhode Island, with individuals controlling 87.5% of them.
Detailed Findings

In Rhode Island, investors hold 29,043 single-family residential properties, making up 11.8% of the total SFR market. This demonstrates a significant, yet not dominant, presence in the state's housing landscape. The composition of this ownership heavily skews towards private individuals over corporate entities.

Individual investors are the backbone of the state's rental market, owning 25,407 properties, which constitutes 87.5% of the entire investor-owned portfolio. In contrast, companies own just 4,299 properties (14.8%), underscoring a market driven by smaller-scale real estate investing rather than large corporate landlords.

The financial structure of these holdings reveals a market with deep capital, as 54.1% of properties (15,716) were acquired with cash and are owned free-and-clear. The remaining 45.9% (13,327 properties) are financed, suggesting that while many investors leverage mortgage transaction data, a slight majority operate without debt on their assets.

The primary use of these properties is clear: 28,671 properties, or 98.7% of the investor portfolio, are rented out or otherwise non-owner-occupied. This extremely high rate confirms that the vast majority of these assets are actively serving as rental housing for the community.

A comparison of entity counts further highlights the dominance of small investors. There are 36,559 individual landlords compared to just 3,827 company landlords. This near 10-to-1 ratio of individual-to-company entities, combined with the property ownership split, paints a picture of a granular market composed of many small players.
Acquisition Timing & Pricing

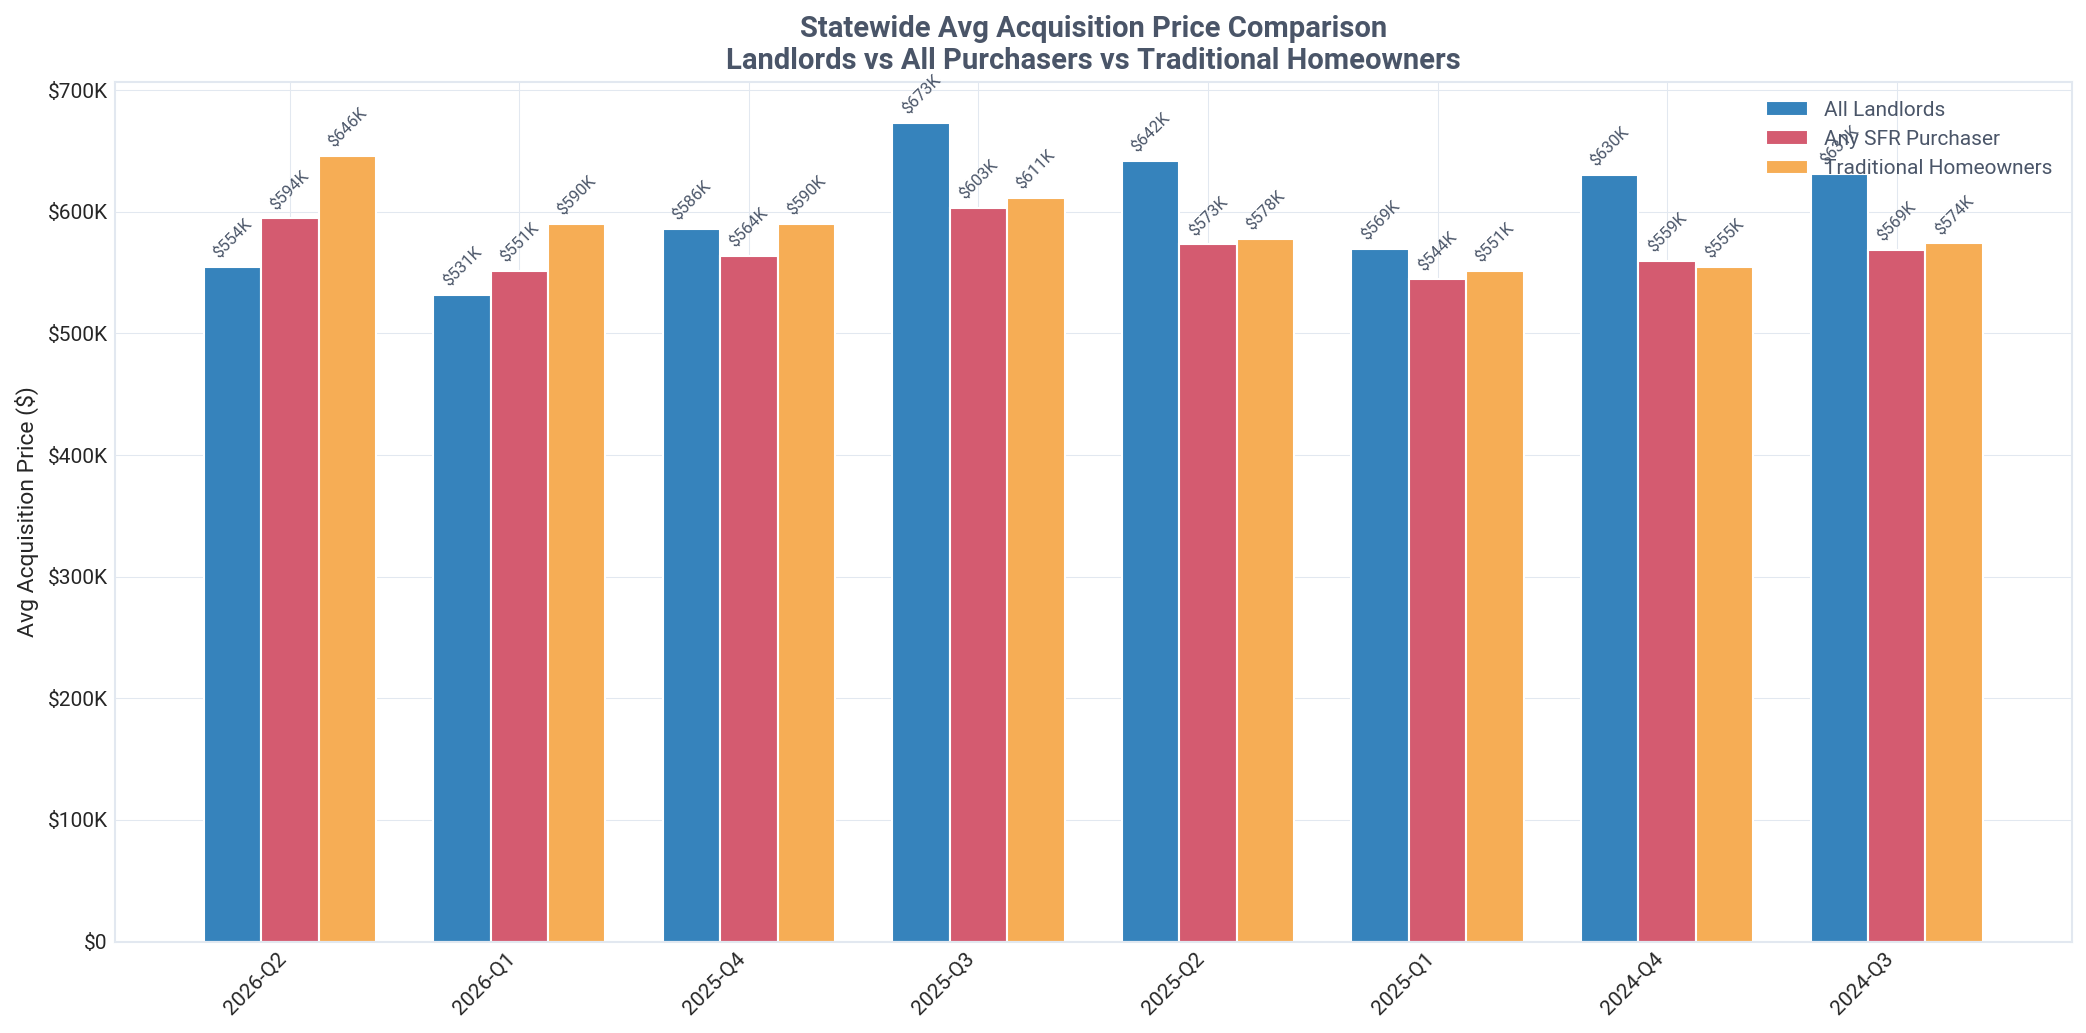
Comparison of acquisition prices between landlords and traditional homeowners

Key Insight
In Q2 2026, Rhode Island landlords paid 14.2% less than homeowners, a $91,423 discount per property.
Detailed Findings

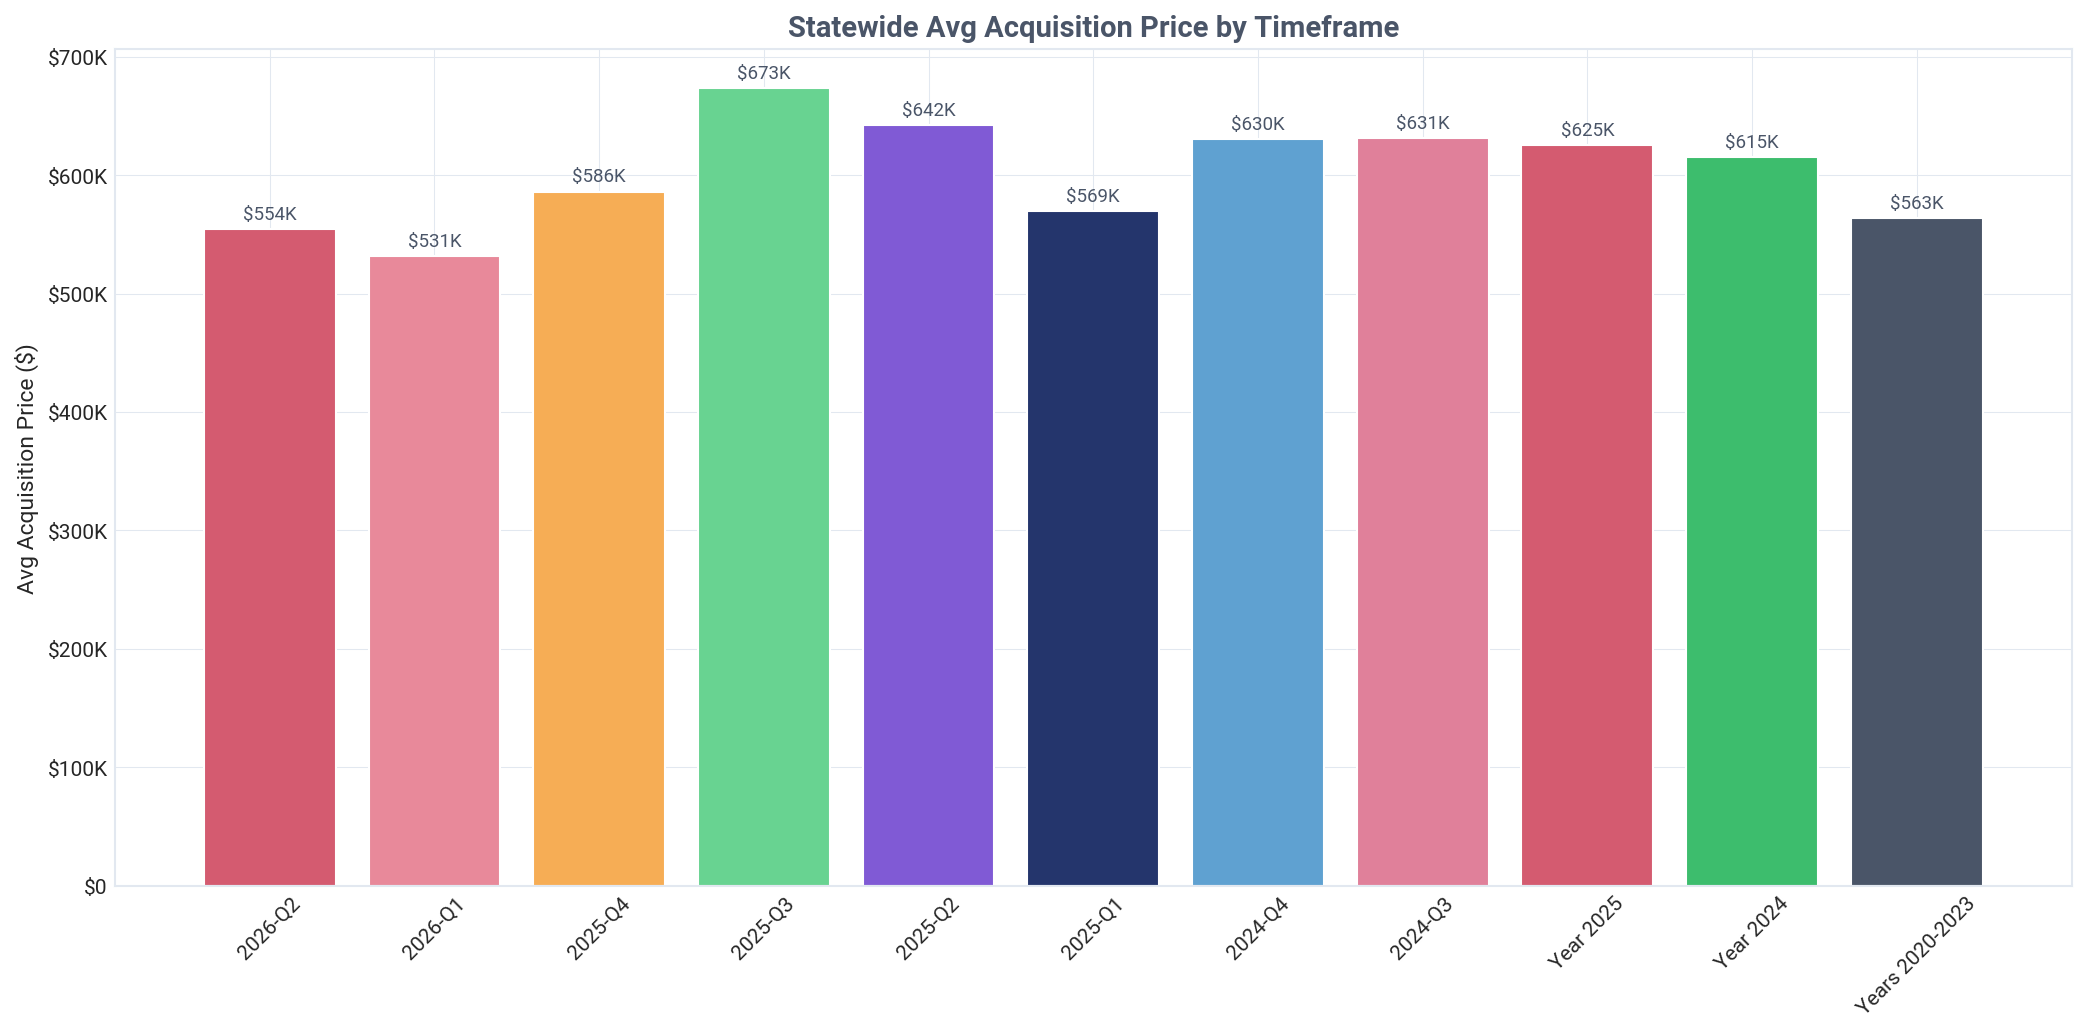
In Q2 2026, landlords in Rhode Island demonstrated a distinct pricing advantage, acquiring properties for an average of $554,430. This was a substantial 14.2% less than the $645,853 paid by traditional homeowners, translating to a cash discount of $91,423 per transaction. This suggests investors are adept at finding off-market deals or negotiating more effectively.

The price gap between landlords and homeowners has been highly volatile. The 14.2% discount in Q2 2026 is a sharp increase from the 9.9% discount in Q1 2026 and a negligible 0.7% gap in Q4 2025. This widening gap signals a potential shift in market dynamics, favoring savvy buyers.

A significant anomaly occurred in Q3 2025, when landlords paid an average of $673,140, a 10.2% premium over the homeowner price of $611,078. This brief period of overpayment contrasts sharply with the typical discount trend and may reflect a temporary surge in competition for specific asset types.

Current acquisition prices indicate a slight market cooling compared to the pandemic-era boom. The Q2 2026 average price of $554,430 is 1.6% lower than the average of $563,485 recorded between 2020 and 2023. While not a major downturn, it shows prices have stabilized from their recent highs.

Overall, the data suggests that while investors generally secure properties below market rate, their ability to do so fluctuates significantly. Tools like an effective property search platform and accurate automated valuation (AVM) are likely critical for maintaining a purchasing edge in such a dynamic environment.

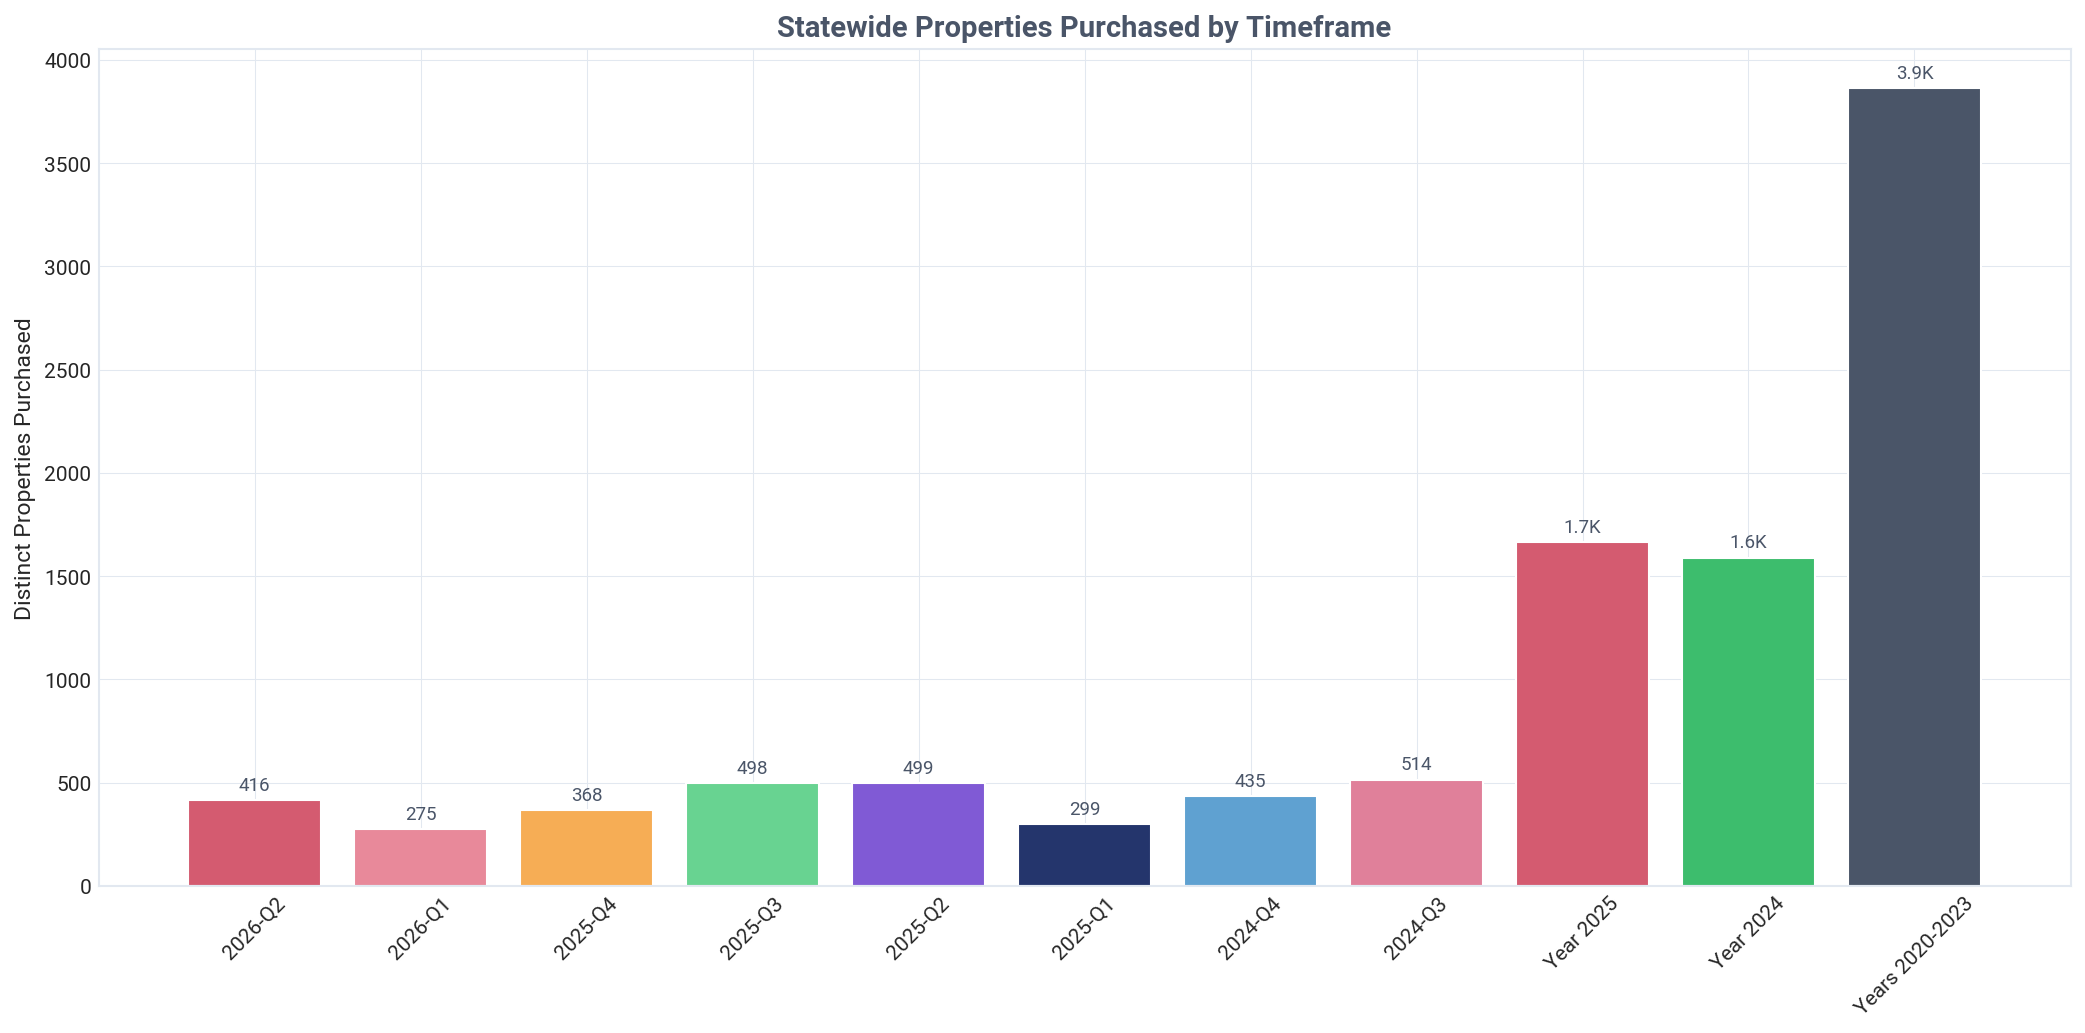
Rhode Island: properties purchased by timeframe, Q2 2026
Rhode Island: average acquisition price by timeframe, Q2 2026
Rhode Island: average acquisition price by buyer type, Q2 2026
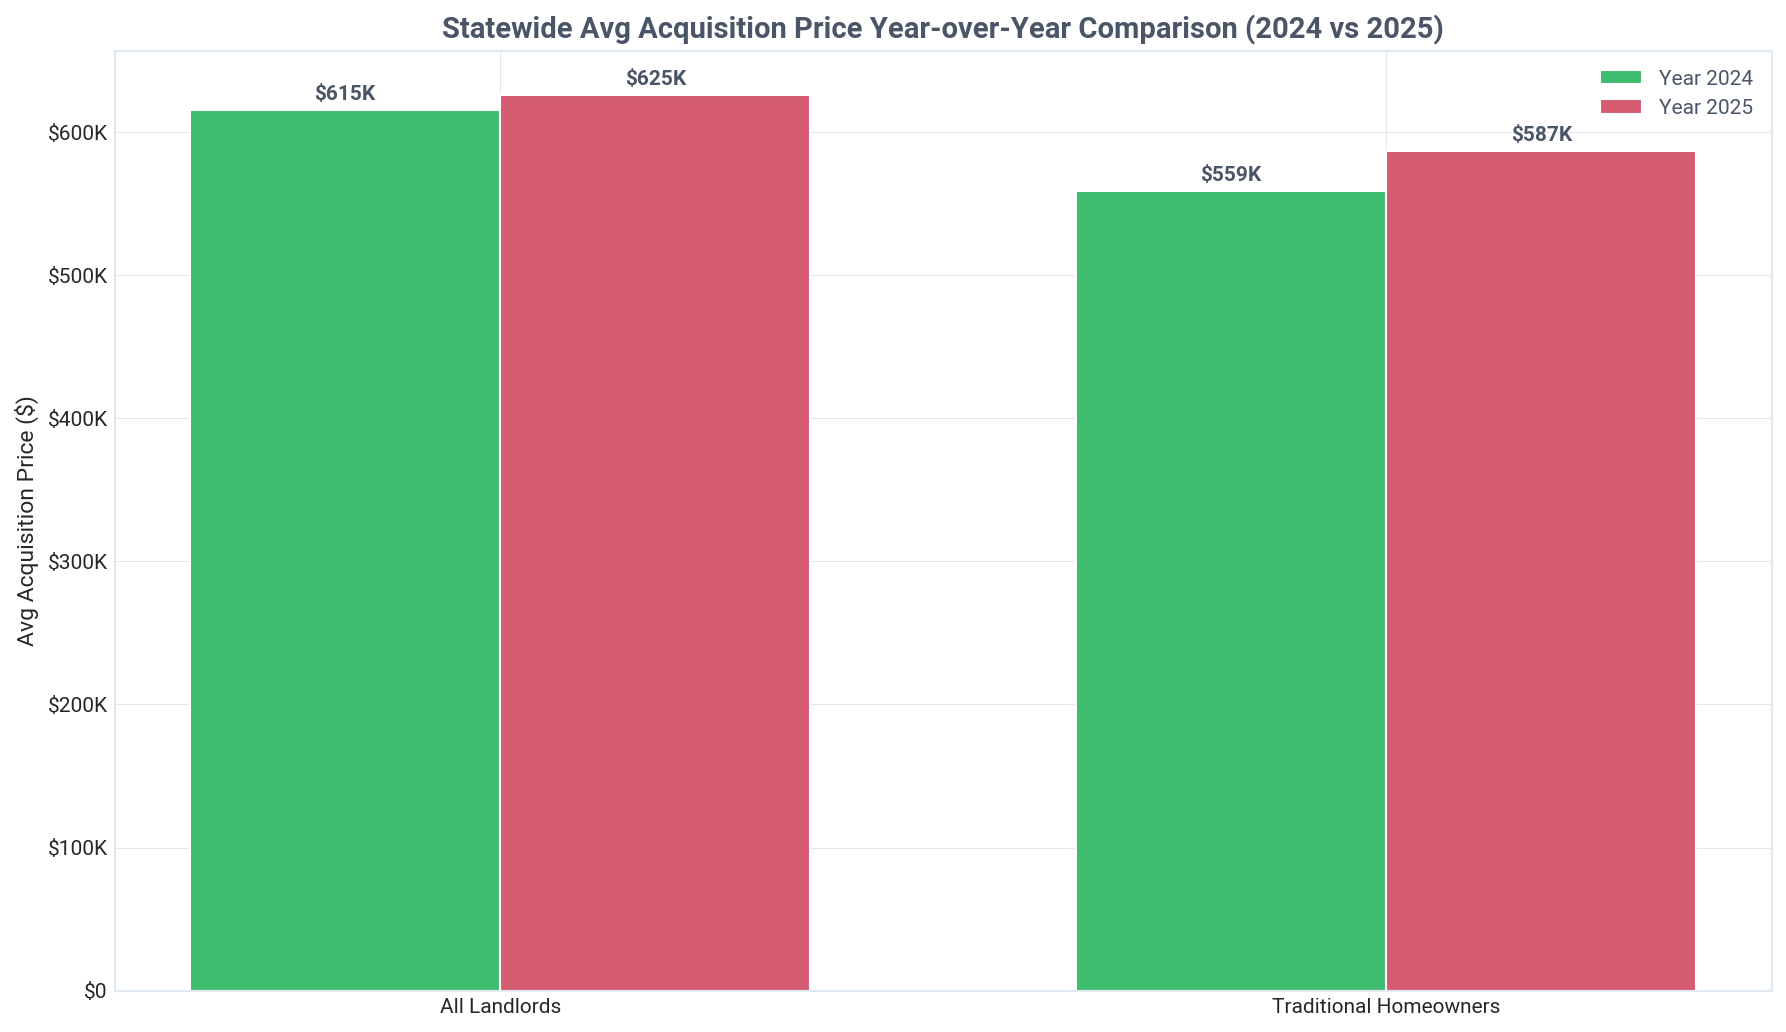
Rhode Island: average acquisition price year over year, Q2 2026

Current Quarter Purchase Summary

Analysis of Q2 2026 purchase activity by investor tier and type

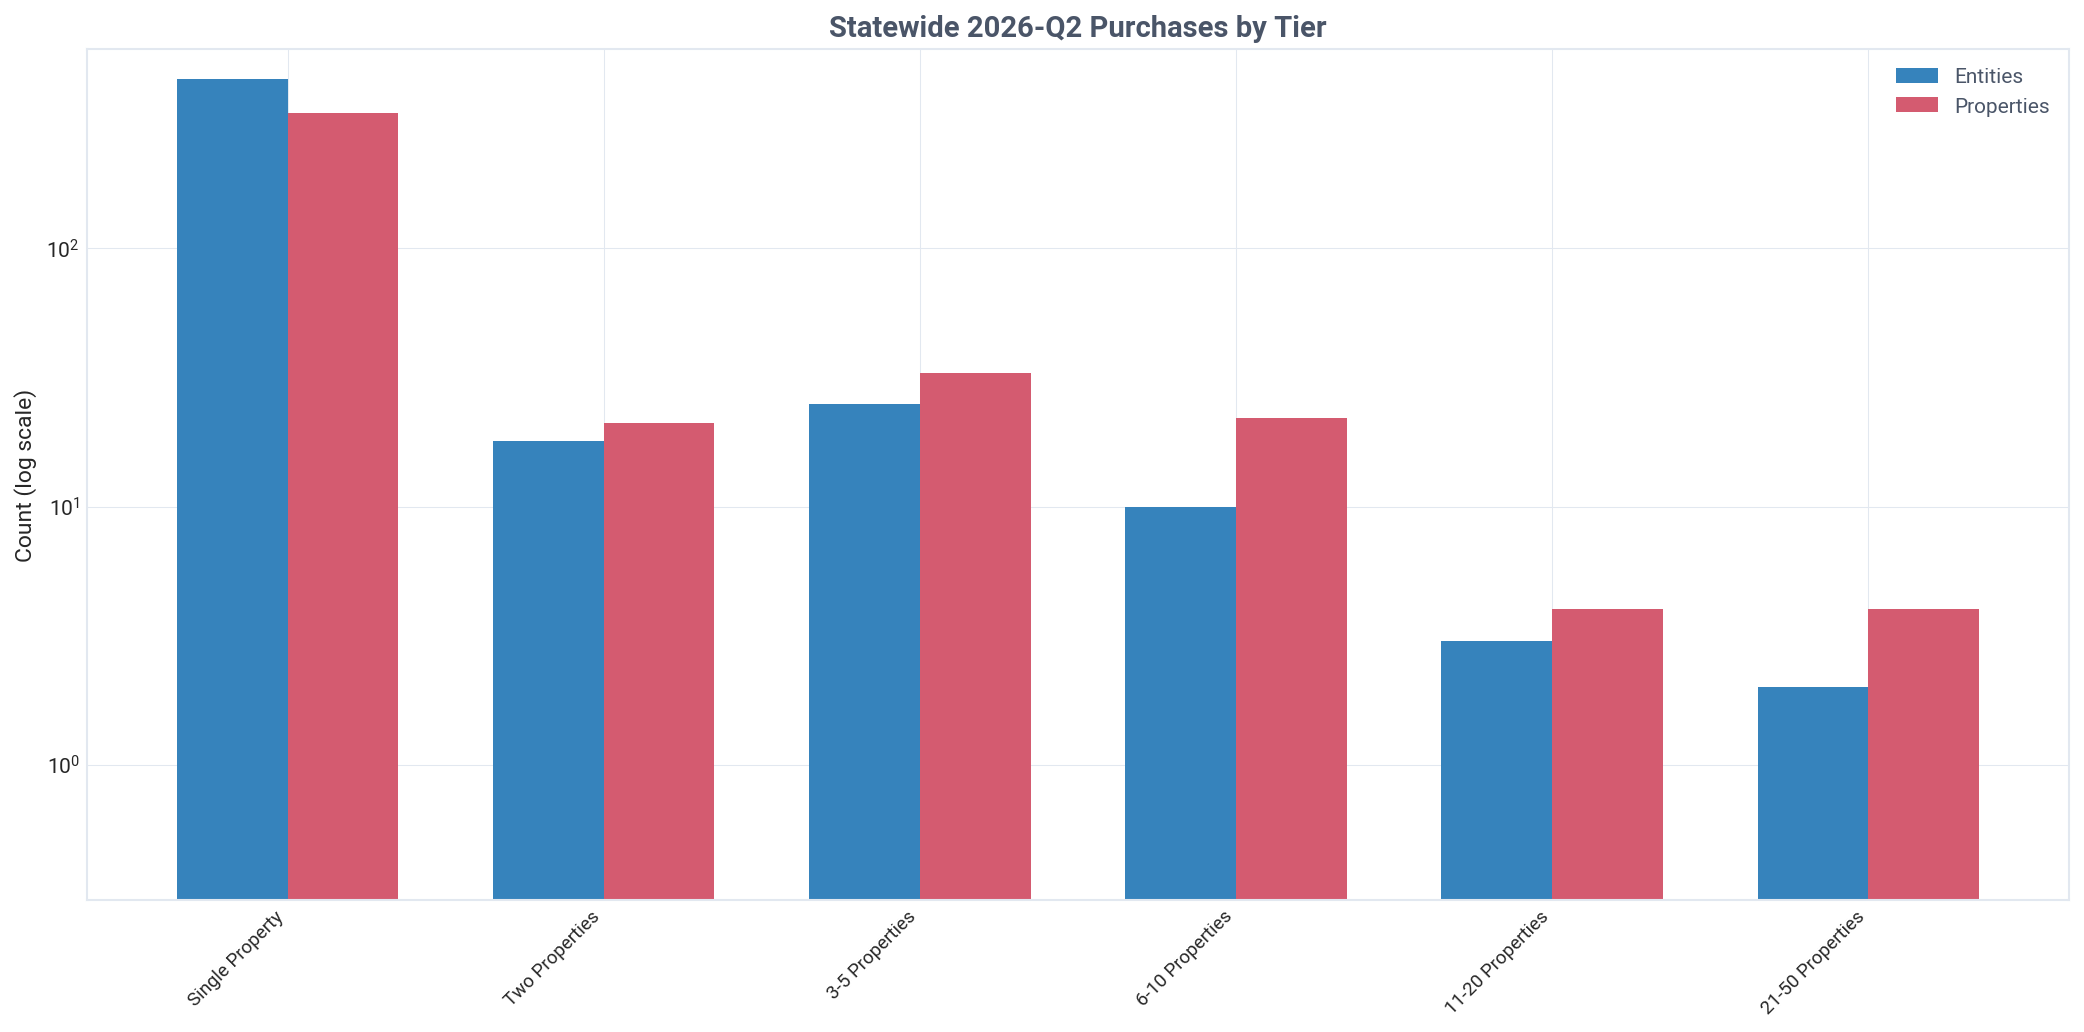
Rhode Island: purchases by tier, Q2 2026
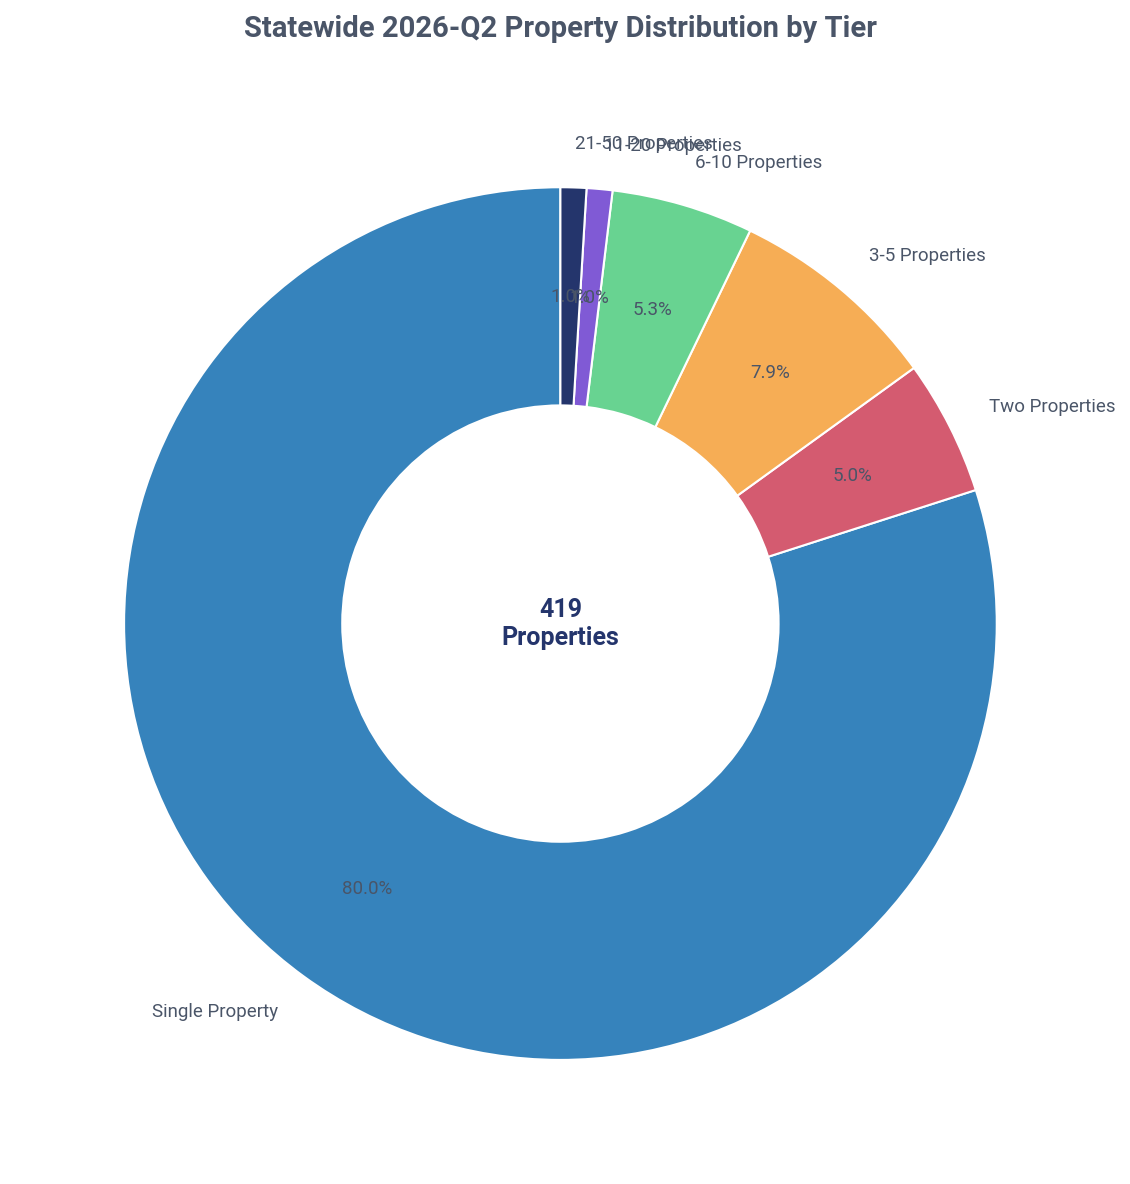
Rhode Island: purchased property share by tier, Q2 2026
Key Insight
Landlords acquired 23.0% of all Rhode Island SFRs sold in Q2 2026, totaling 416 properties.
Detailed Findings

Landlord purchasing activity was a significant driver of the Rhode Island housing market in Q2 2026. Investors bought 416 of the 1,809 SFR properties sold, capturing a 23.0% market share of all purchases during the quarter. This level of activity highlights their ongoing role in market liquidity and demand.

The purchasing activity was overwhelmingly dominated by small-scale investors. Mom-and-pop landlords, defined as those owning 1-10 properties, were responsible for 411 of the 416 investor acquisitions, making up 98.8% of the total. This reinforces the grassroots nature of real estate investment in the state.

In stark contrast to the activity at the small end of the market, institutional investors (1,000+ properties) made zero purchases in Q2 2026. This complete absence of large-scale corporate buying further distances the Rhode Island market from the narrative of a 'Wall Street' takeover of residential housing.

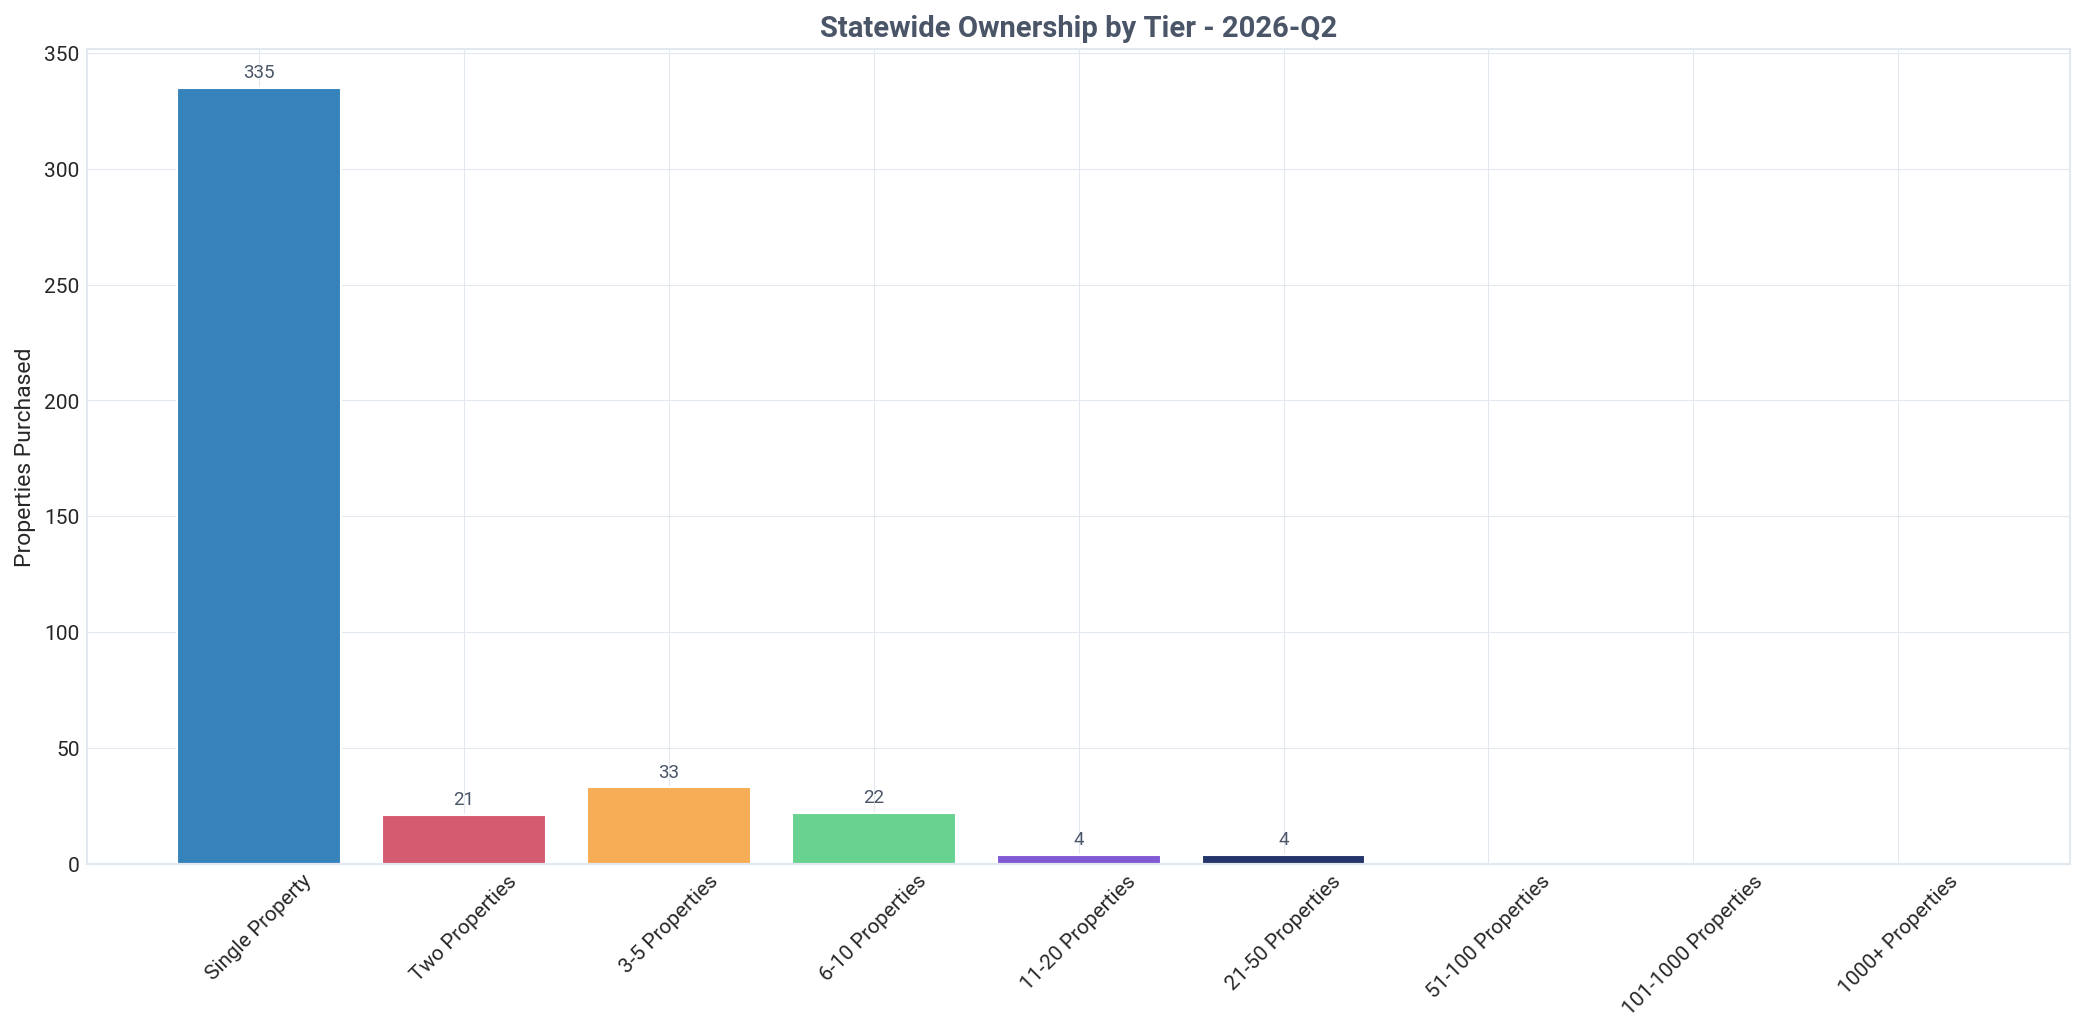
A key trend in the quarter was the significant influx of new market participants. A total of 453 new landlord entities entered the market by purchasing their first and only investment property. These new entrants acquired 335 properties, accounting for 80.5% of all investor purchases, signaling strong interest from first-time investors.

The data clearly shows that market growth is being fueled from the bottom up. The combination of high market share captured by investors, the dominance of mom-and-pop buyers, and the large number of new entrants points to a robust and decentralized investment ecosystem.

Ownership by Purchase Tier

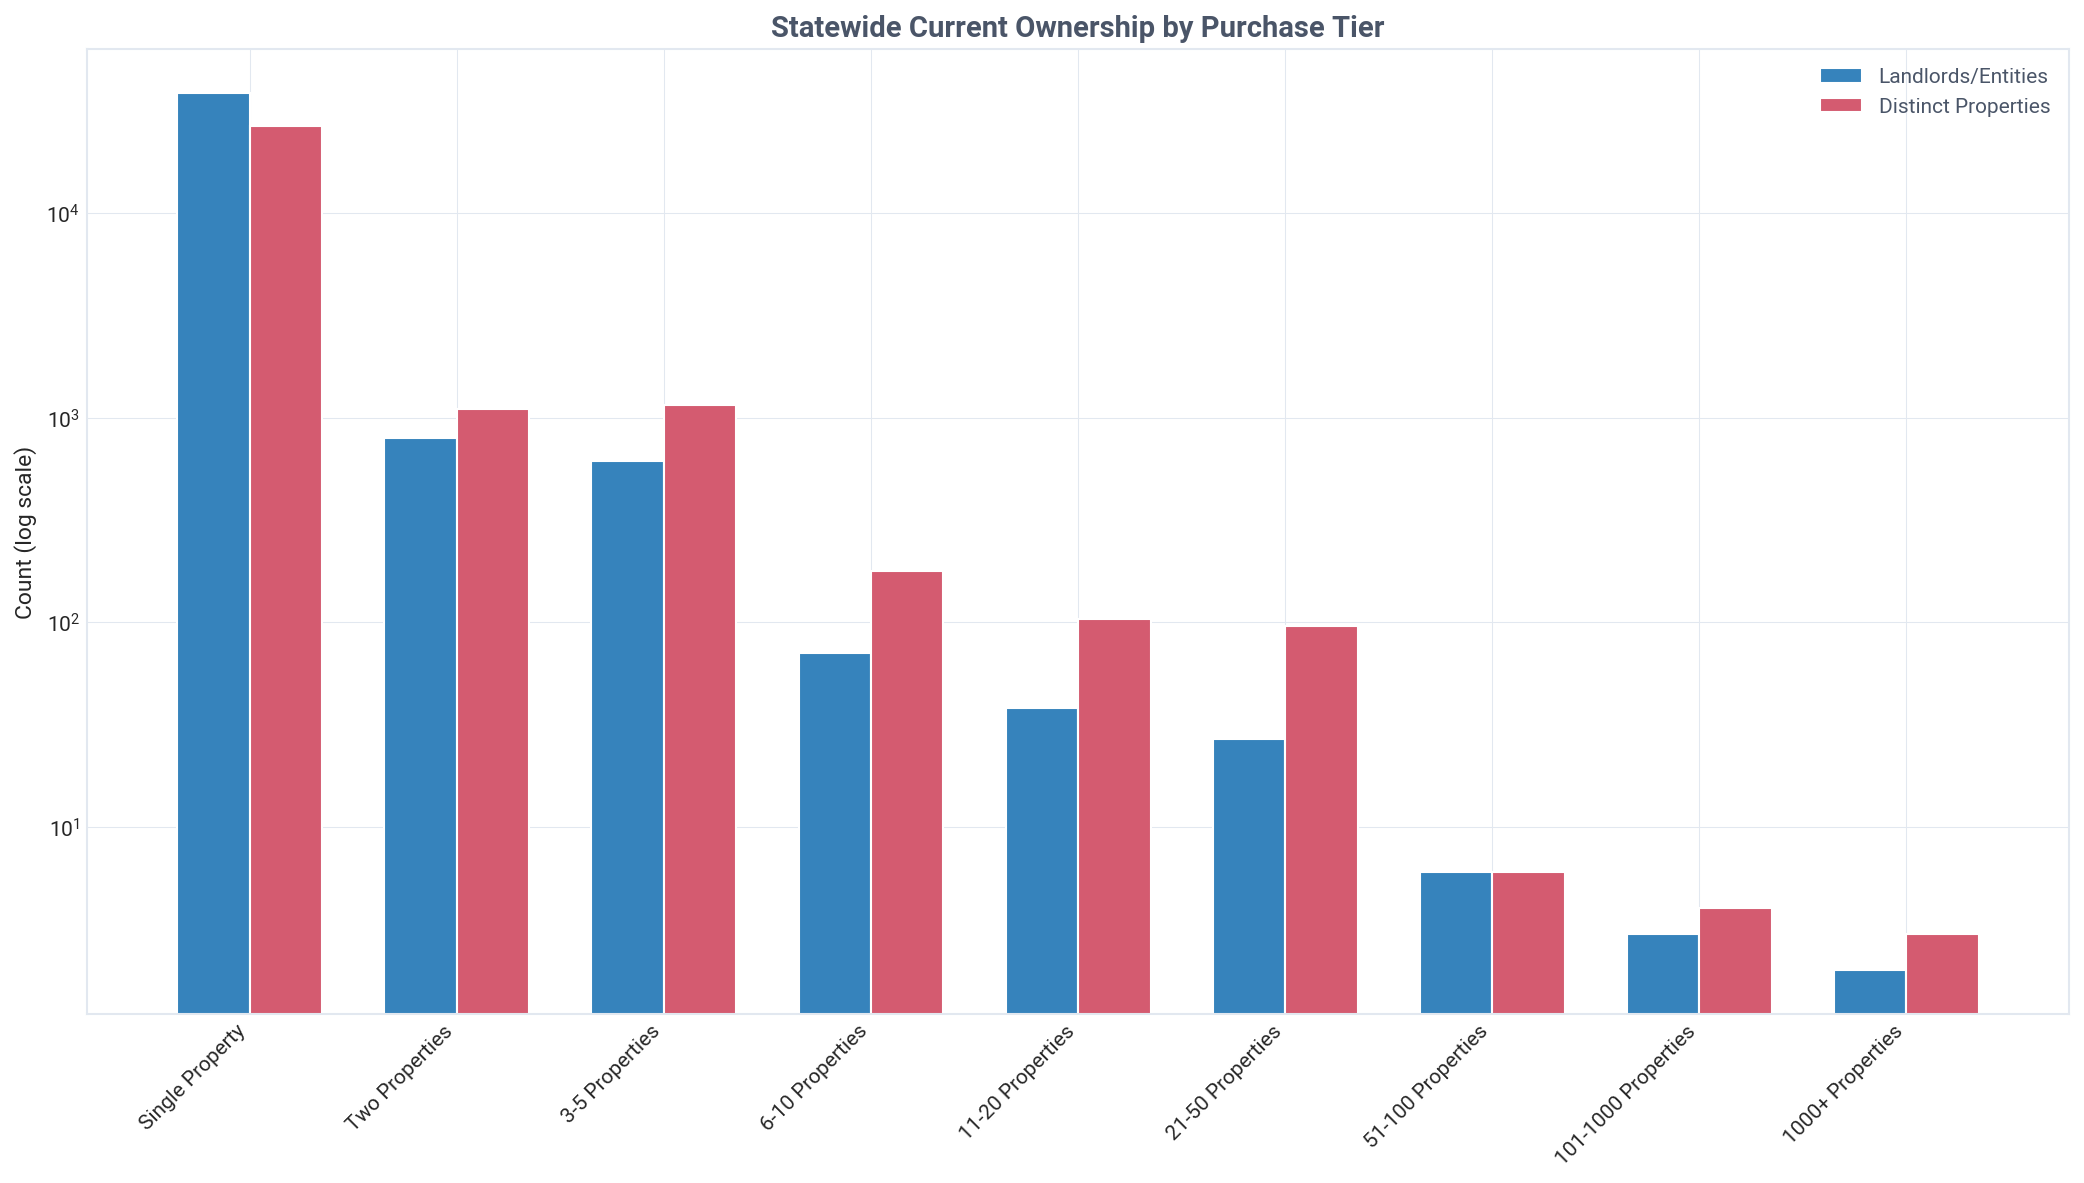
Distribution of investor-owned properties across portfolio size tiers

Key Insight
Mom-and-pop landlords (1-10 properties) control an overwhelming 99.3% of investor-owned SFRs in Rhode Island.
Detailed Findings

The structure of rental property ownership in Rhode Island is almost entirely decentralized. Mom-and-pop landlords, who own between 1 and 10 properties, collectively control 99.3% of the state's investor-owned SFR housing stock. This finding directly counters the common perception of large corporations dominating the rental market.

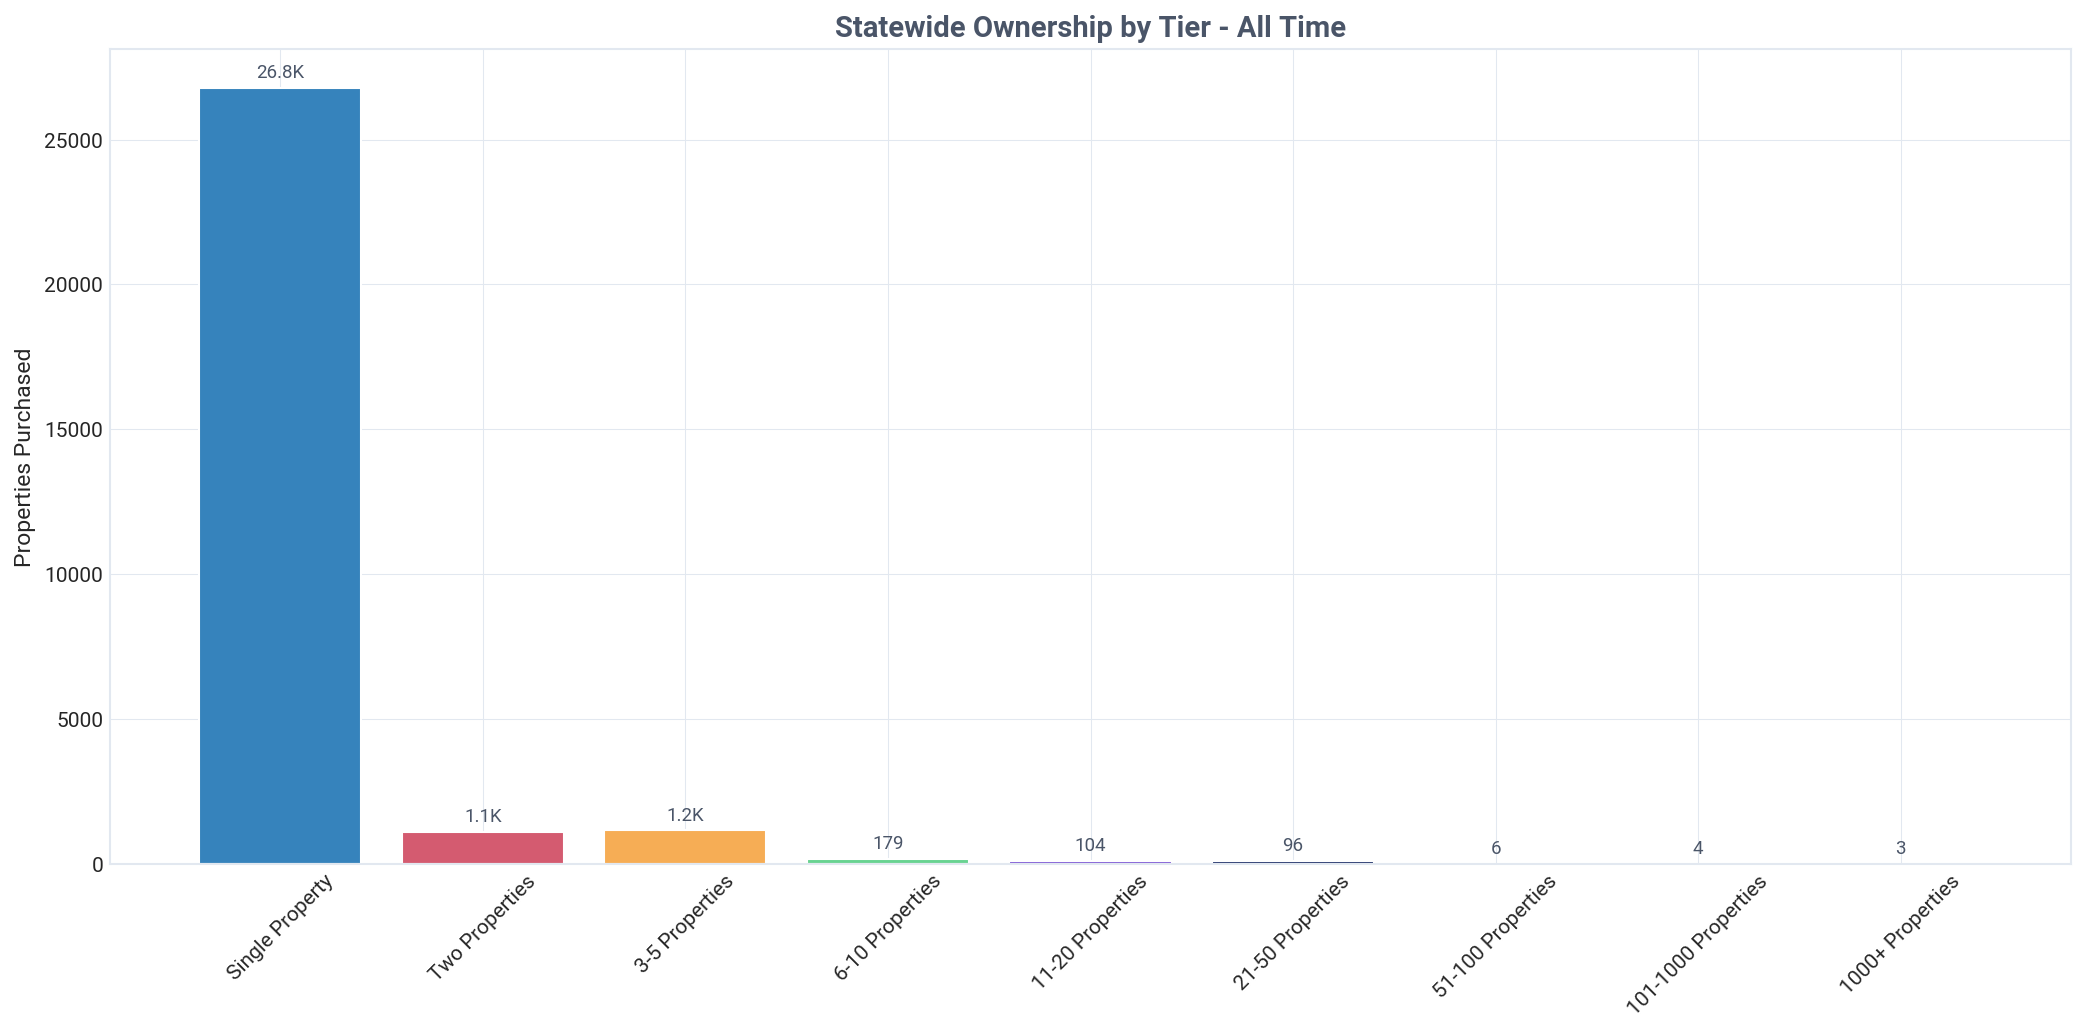
Single-property landlords (Tier 01) represent the largest segment by a wide margin, owning 26,788 properties. This accounts for 91.0% of all investor-owned SFRs, making first-time and small-scale investors the undisputed foundation of the market. This detailed property ownership by owner type report highlights a highly granular market structure.

Institutional ownership is statistically insignificant in Rhode Island. Investors in the 1,000+ property tier own a mere 3 properties in total, representing 0.0% of the investor-owned market. The absence of large-scale players is a defining characteristic of the state's investment landscape.

Mid-size landlords (11-1,000 properties) also have a very small footprint, collectively owning just 0.7% of the investor SFR portfolio. This indicates that very few investors in Rhode Island scale their operations beyond the 10-property threshold.

A surprising pricing trend emerged from Q2 2026 transaction data, where the smallest investors paid the highest prices. Single-property landlords paid an average of $549,973, while those in the 6-10 property tier paid only $315,104. This suggests new entrants may be competing for higher-priced, turnkey assets, while more experienced small landlords target properties with more value-add potential.

Rhode Island: current ownership by purchase tier, Q2 2026
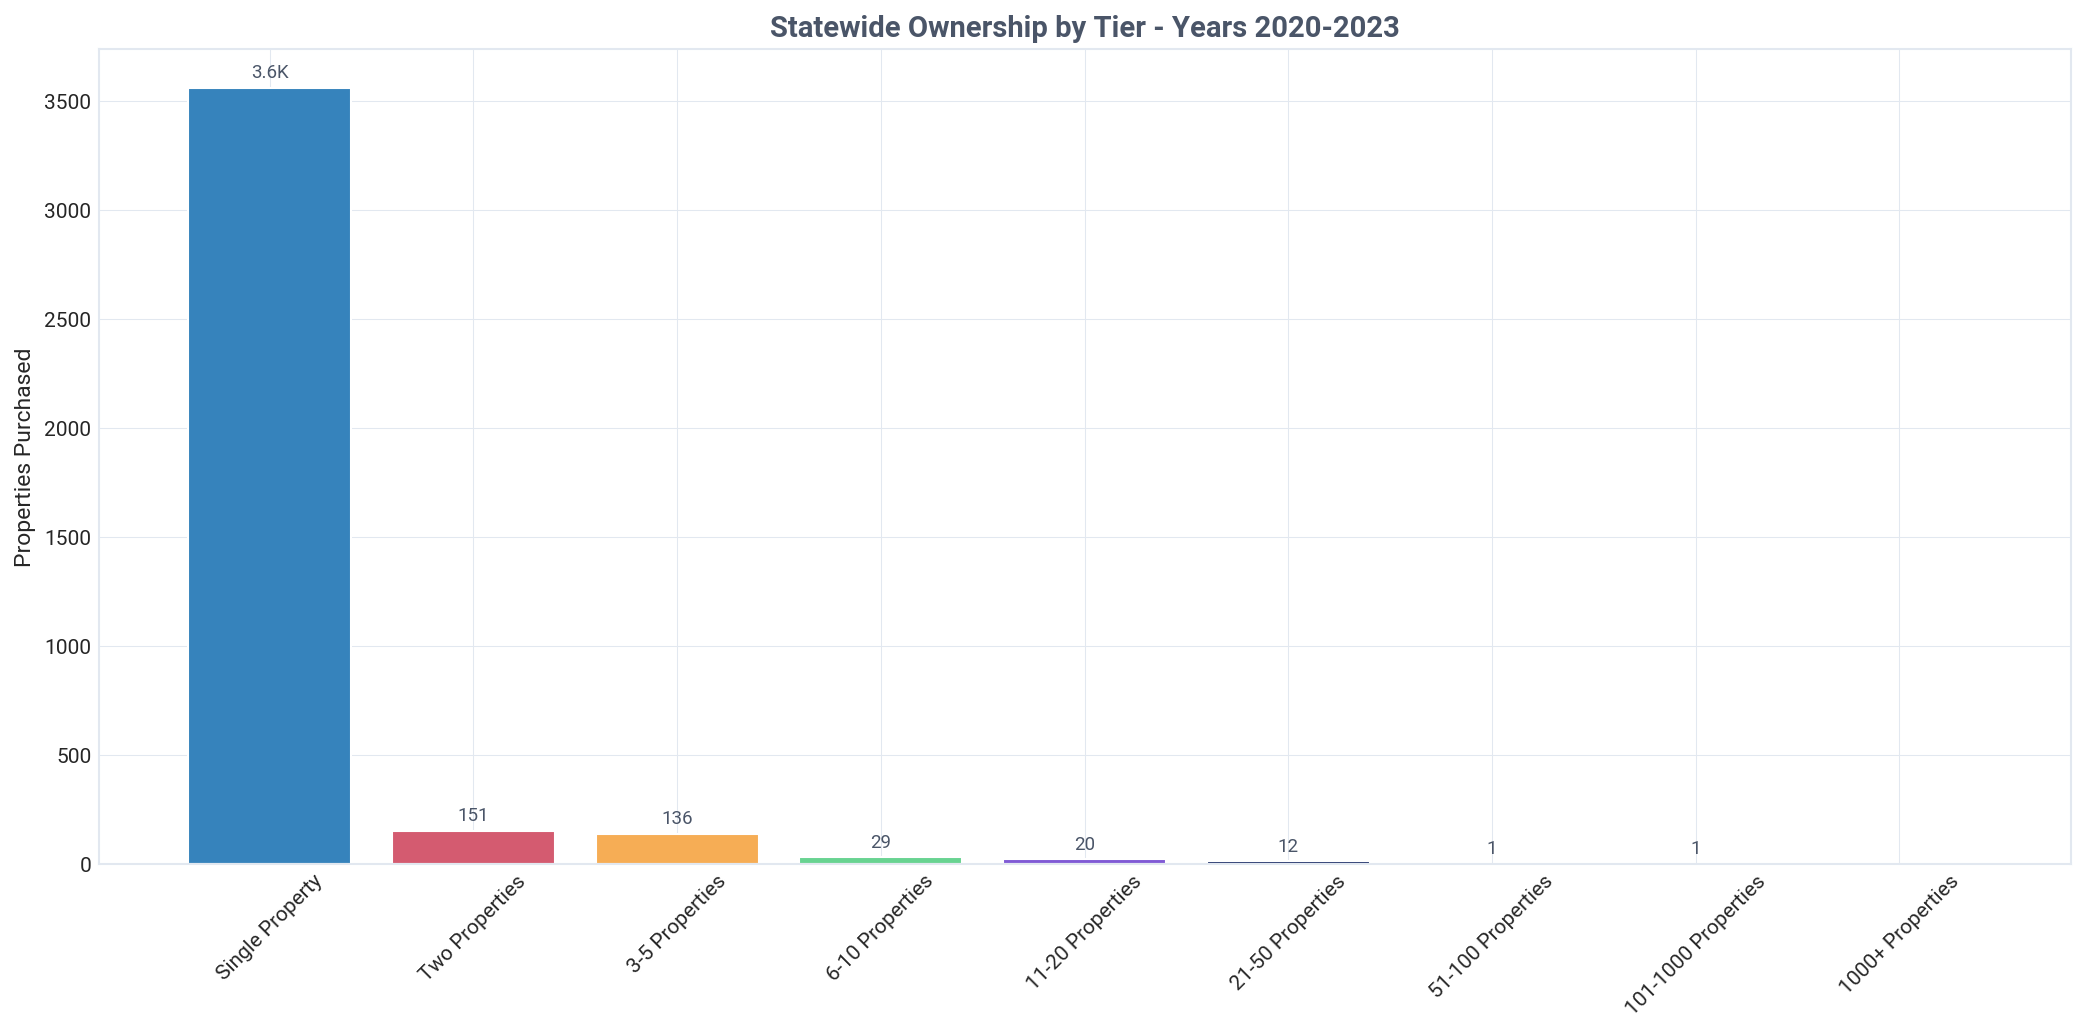
Rhode Island: properties purchased by tier, all time, Q2 2026
Rhode Island: properties purchased by tier this quarter, Q2 2026
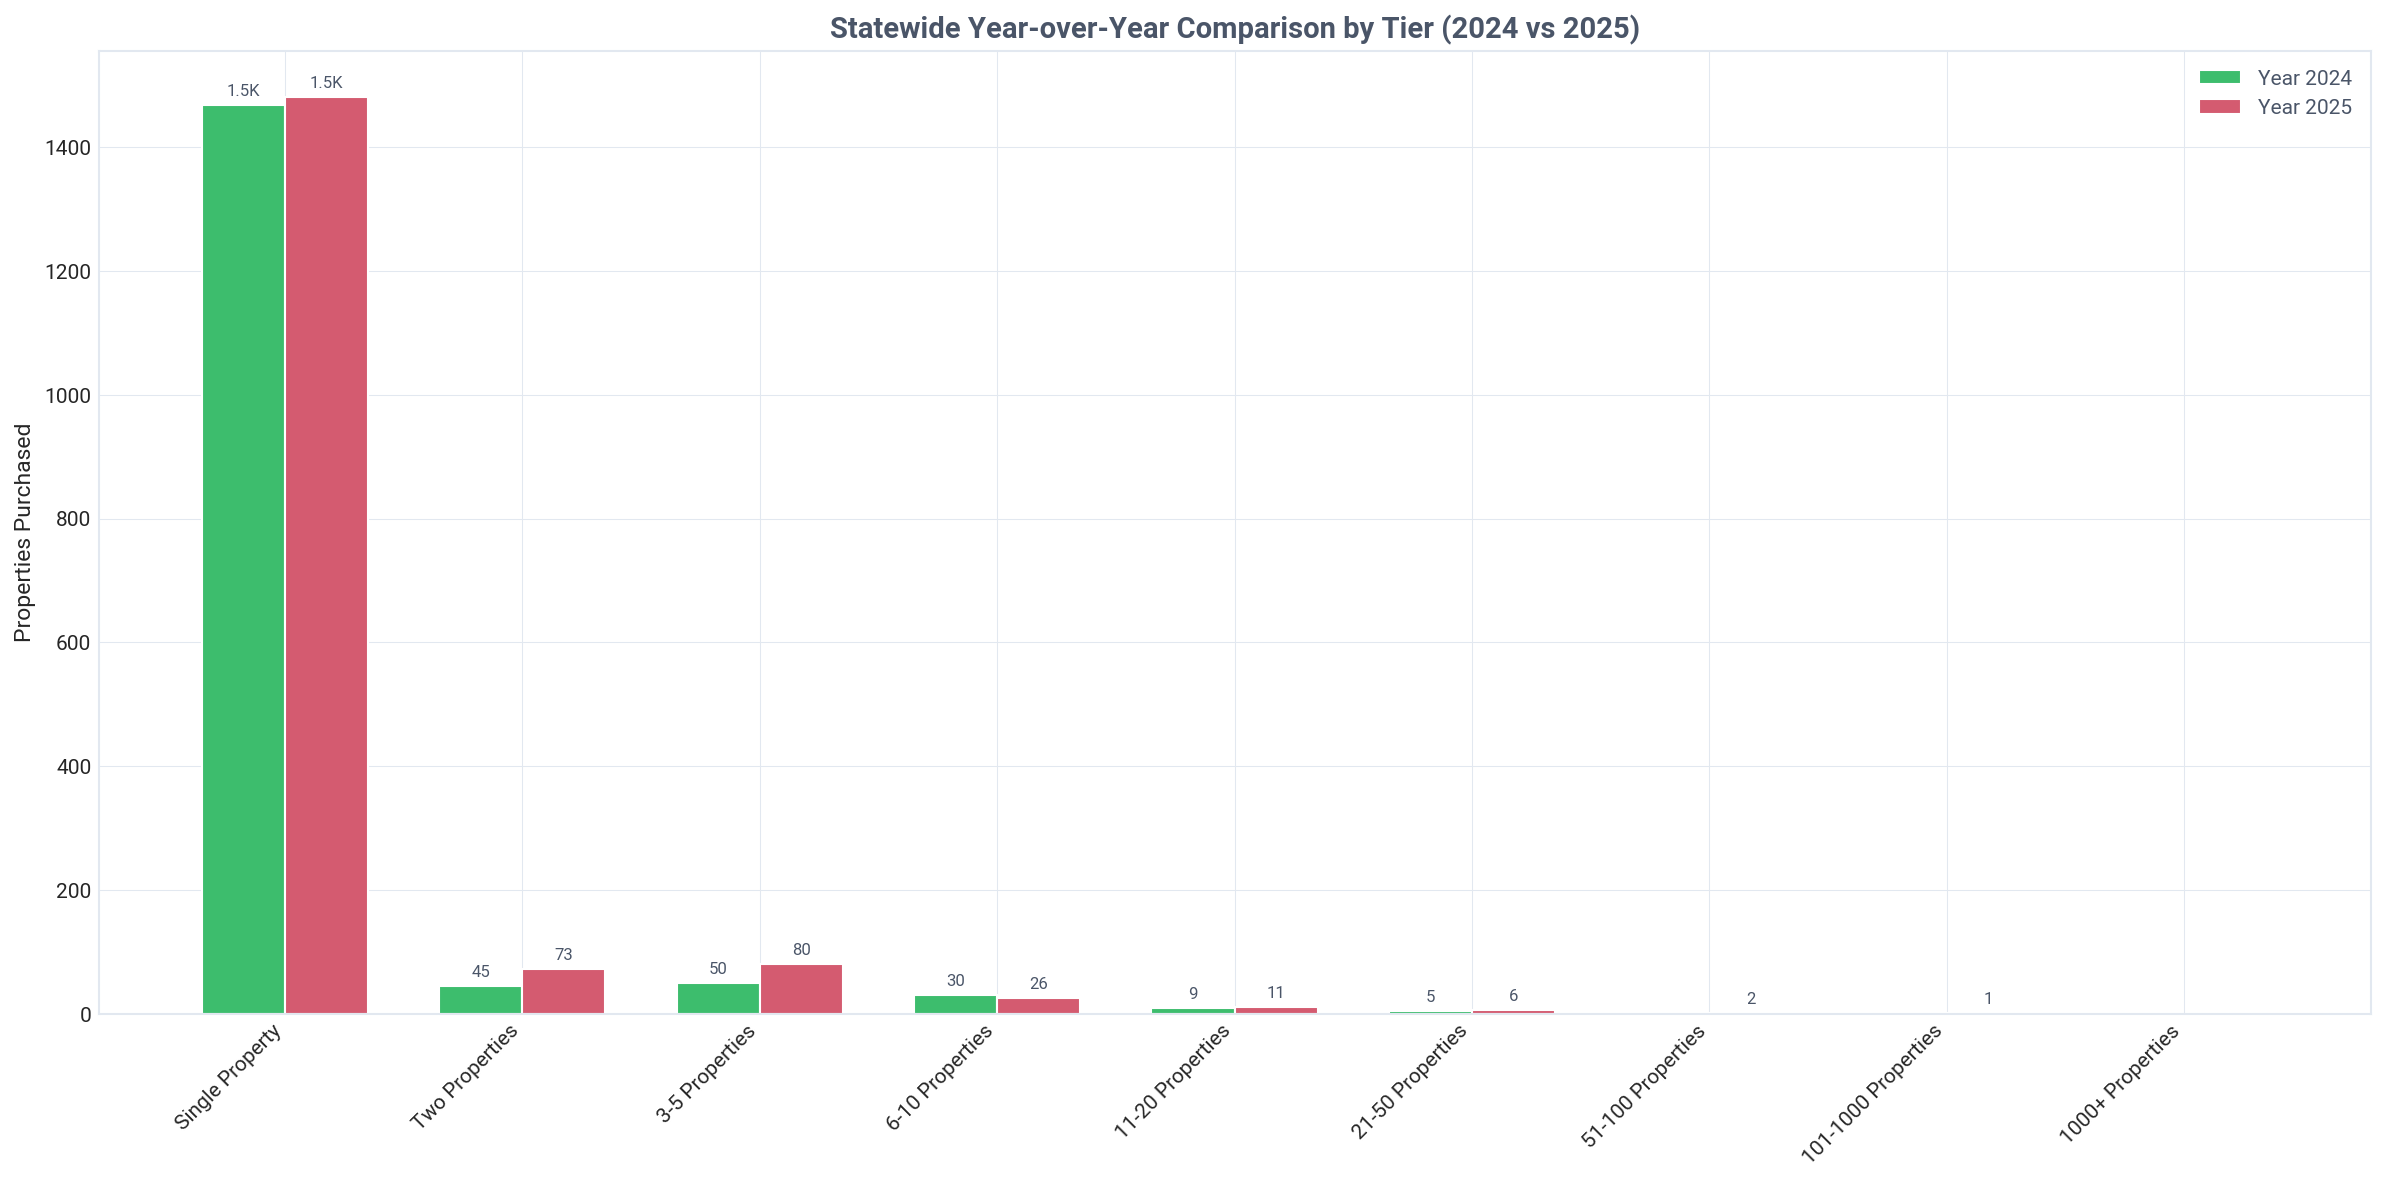
Rhode Island: properties purchased by tier year over year, Q2 2026

Need custom portfolio analysis based on these tier insights?

TALK TO AN EXPERT

Ownership by Tier & Owner Type

Breakdown of individual vs corporate ownership across portfolio tiers

Rhode Island: ownership by tier and owner type, Q2 2026
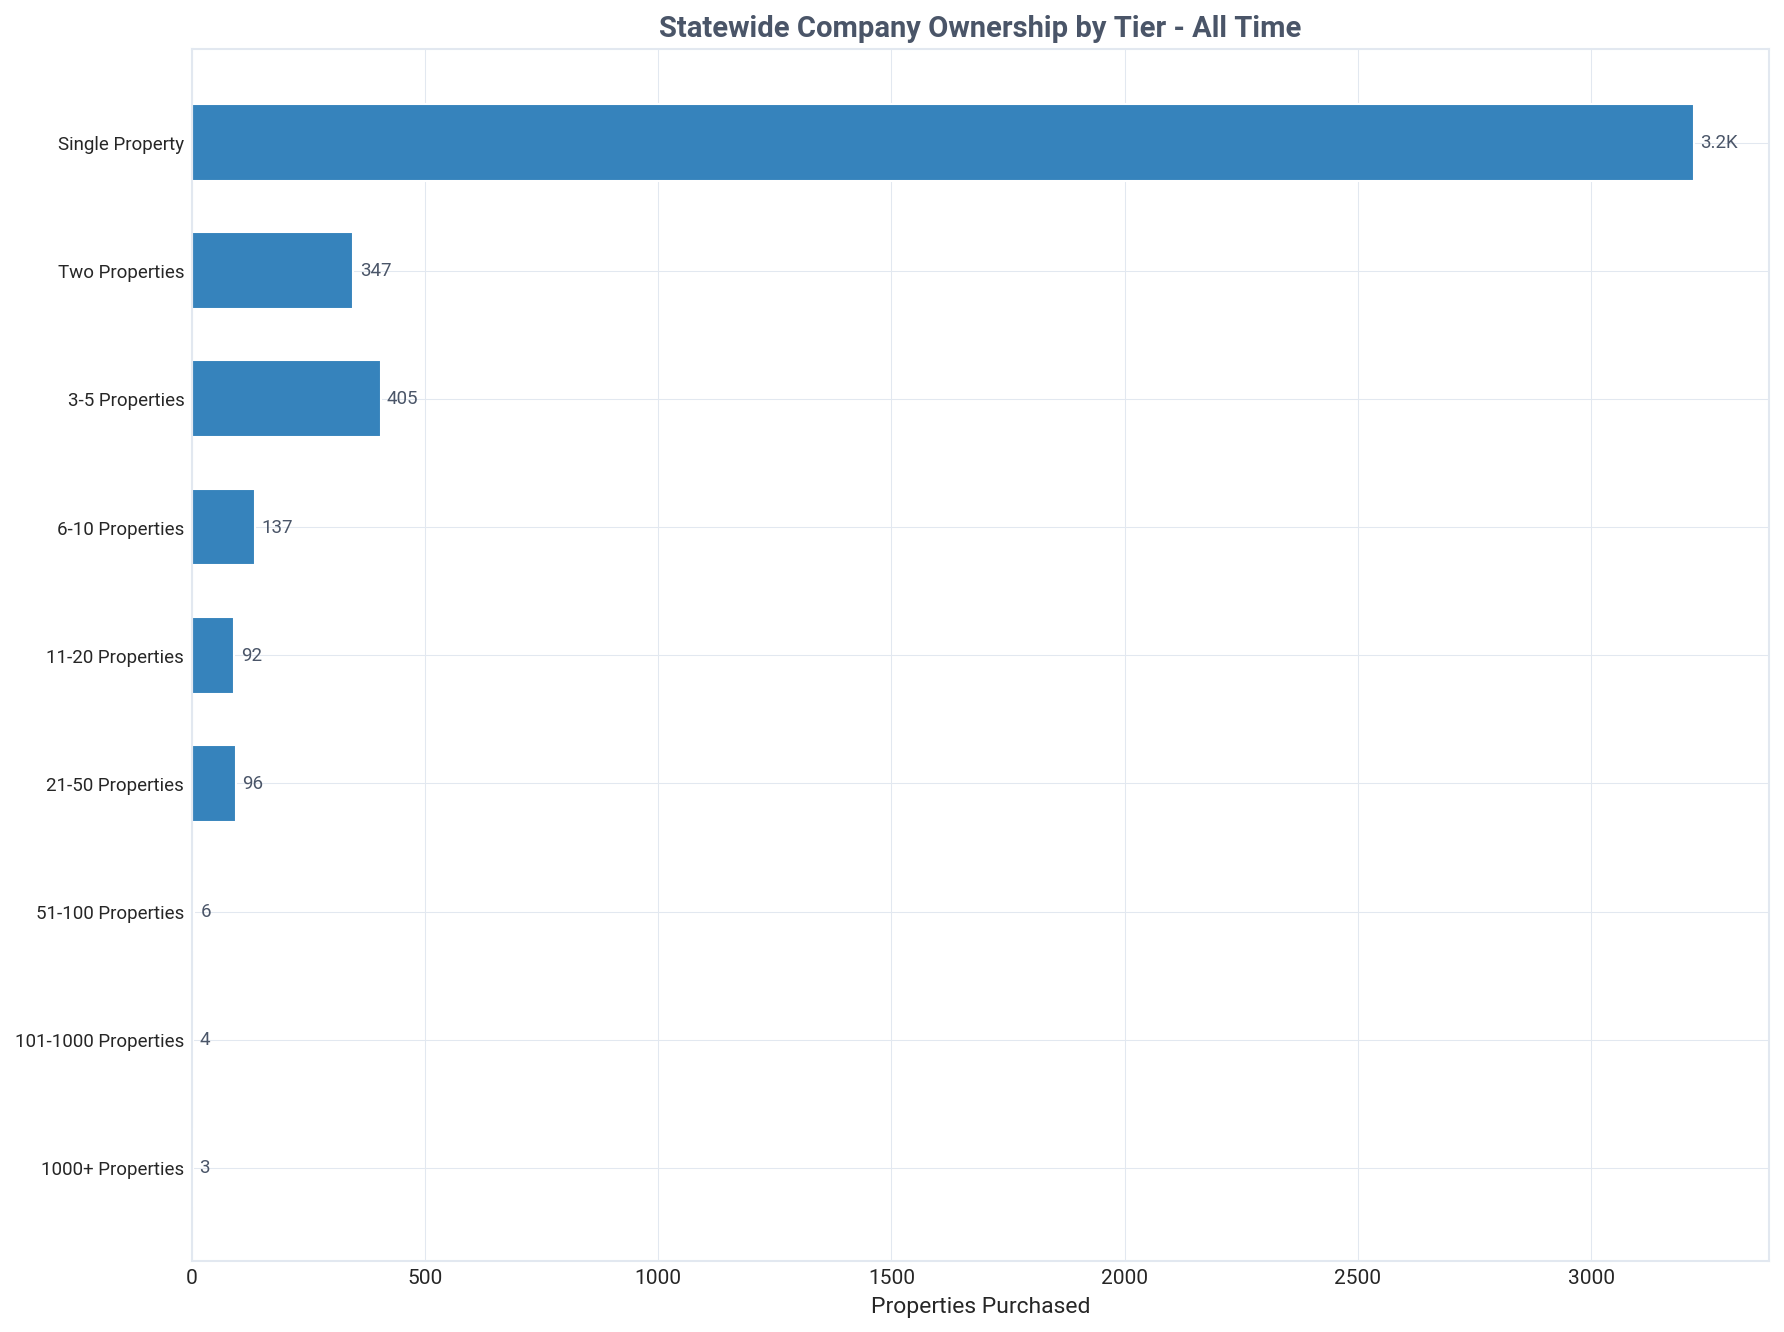
Rhode Island: company purchases by tier, all time, Q2 2026
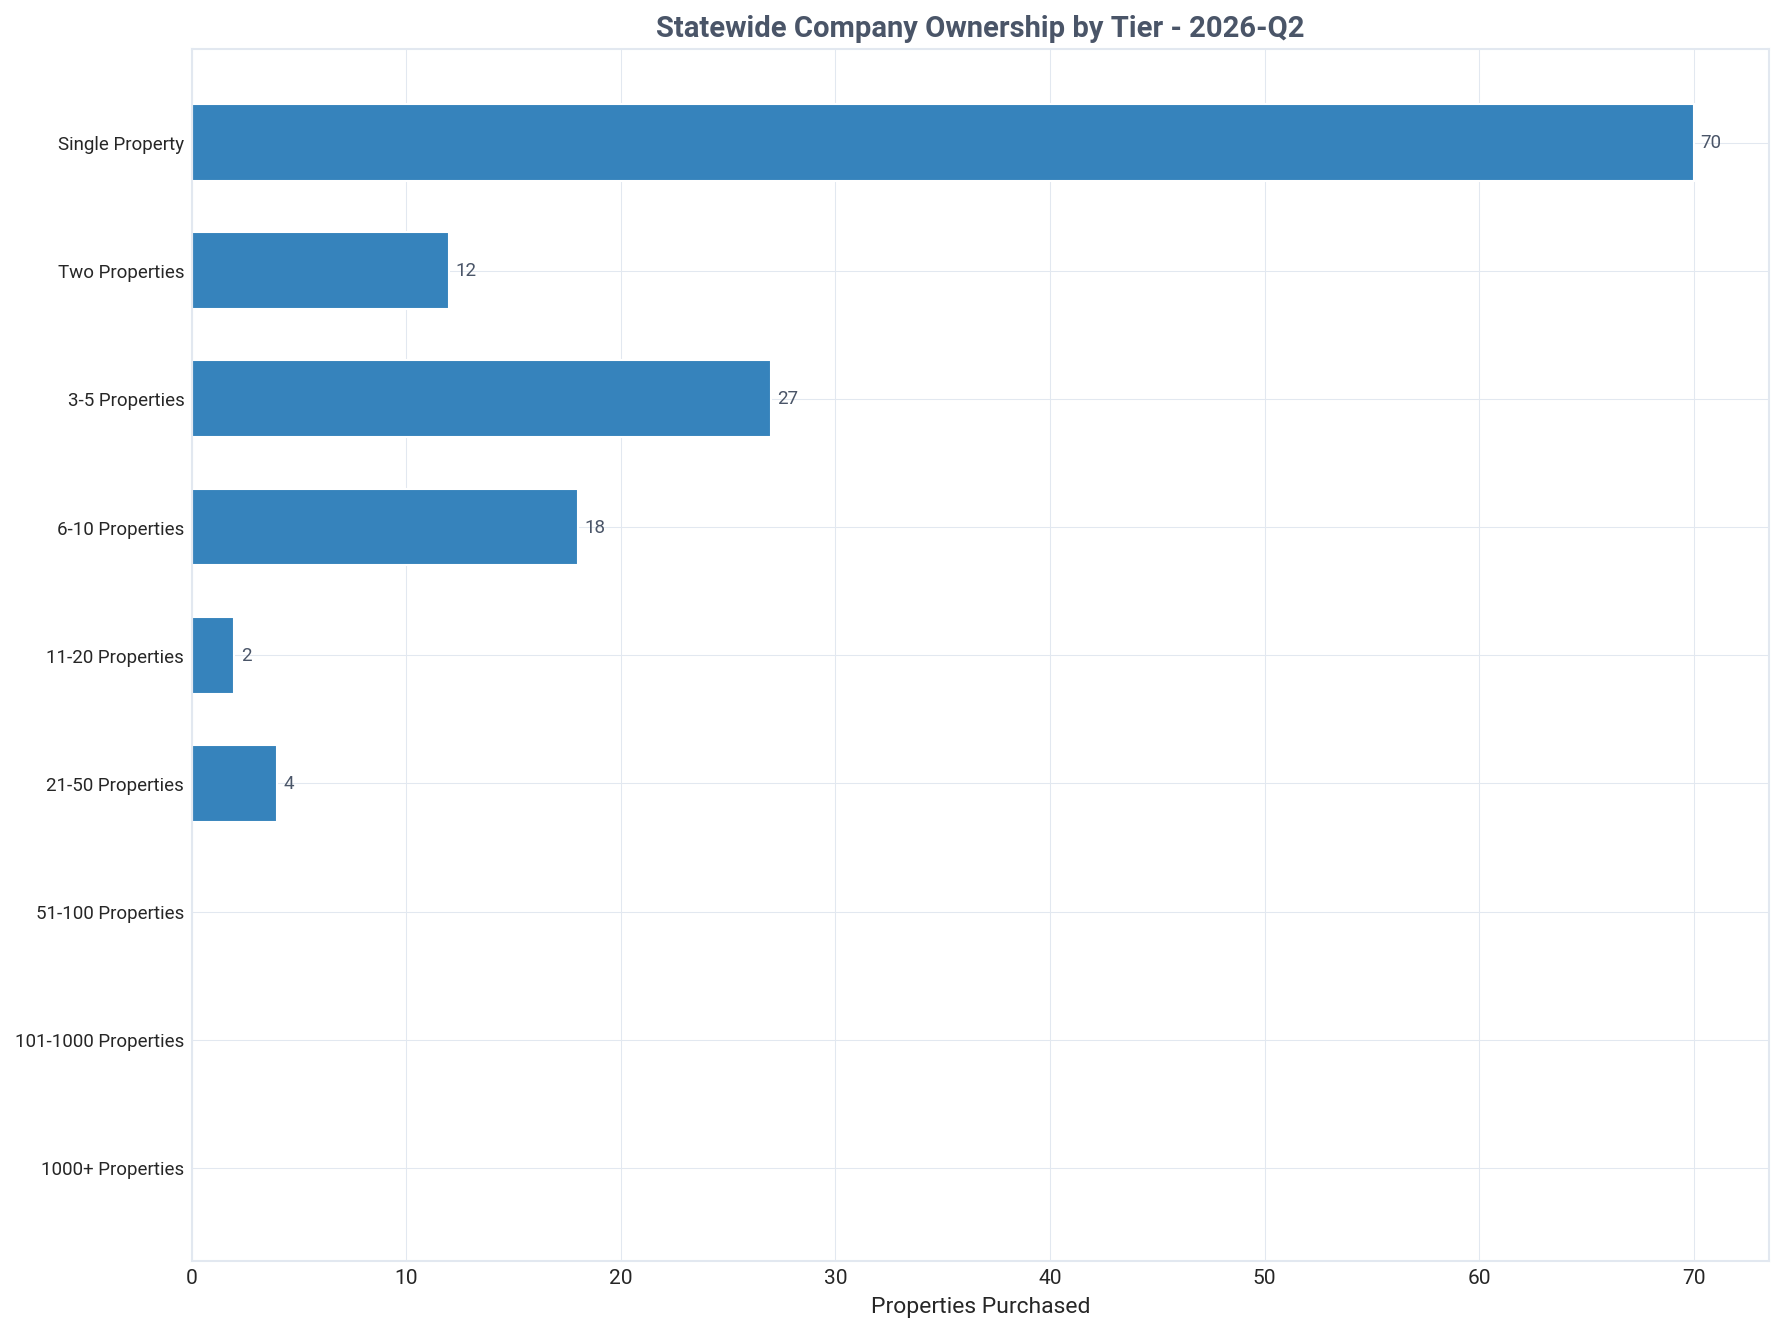
Rhode Island: company purchases by tier this quarter, Q2 2026
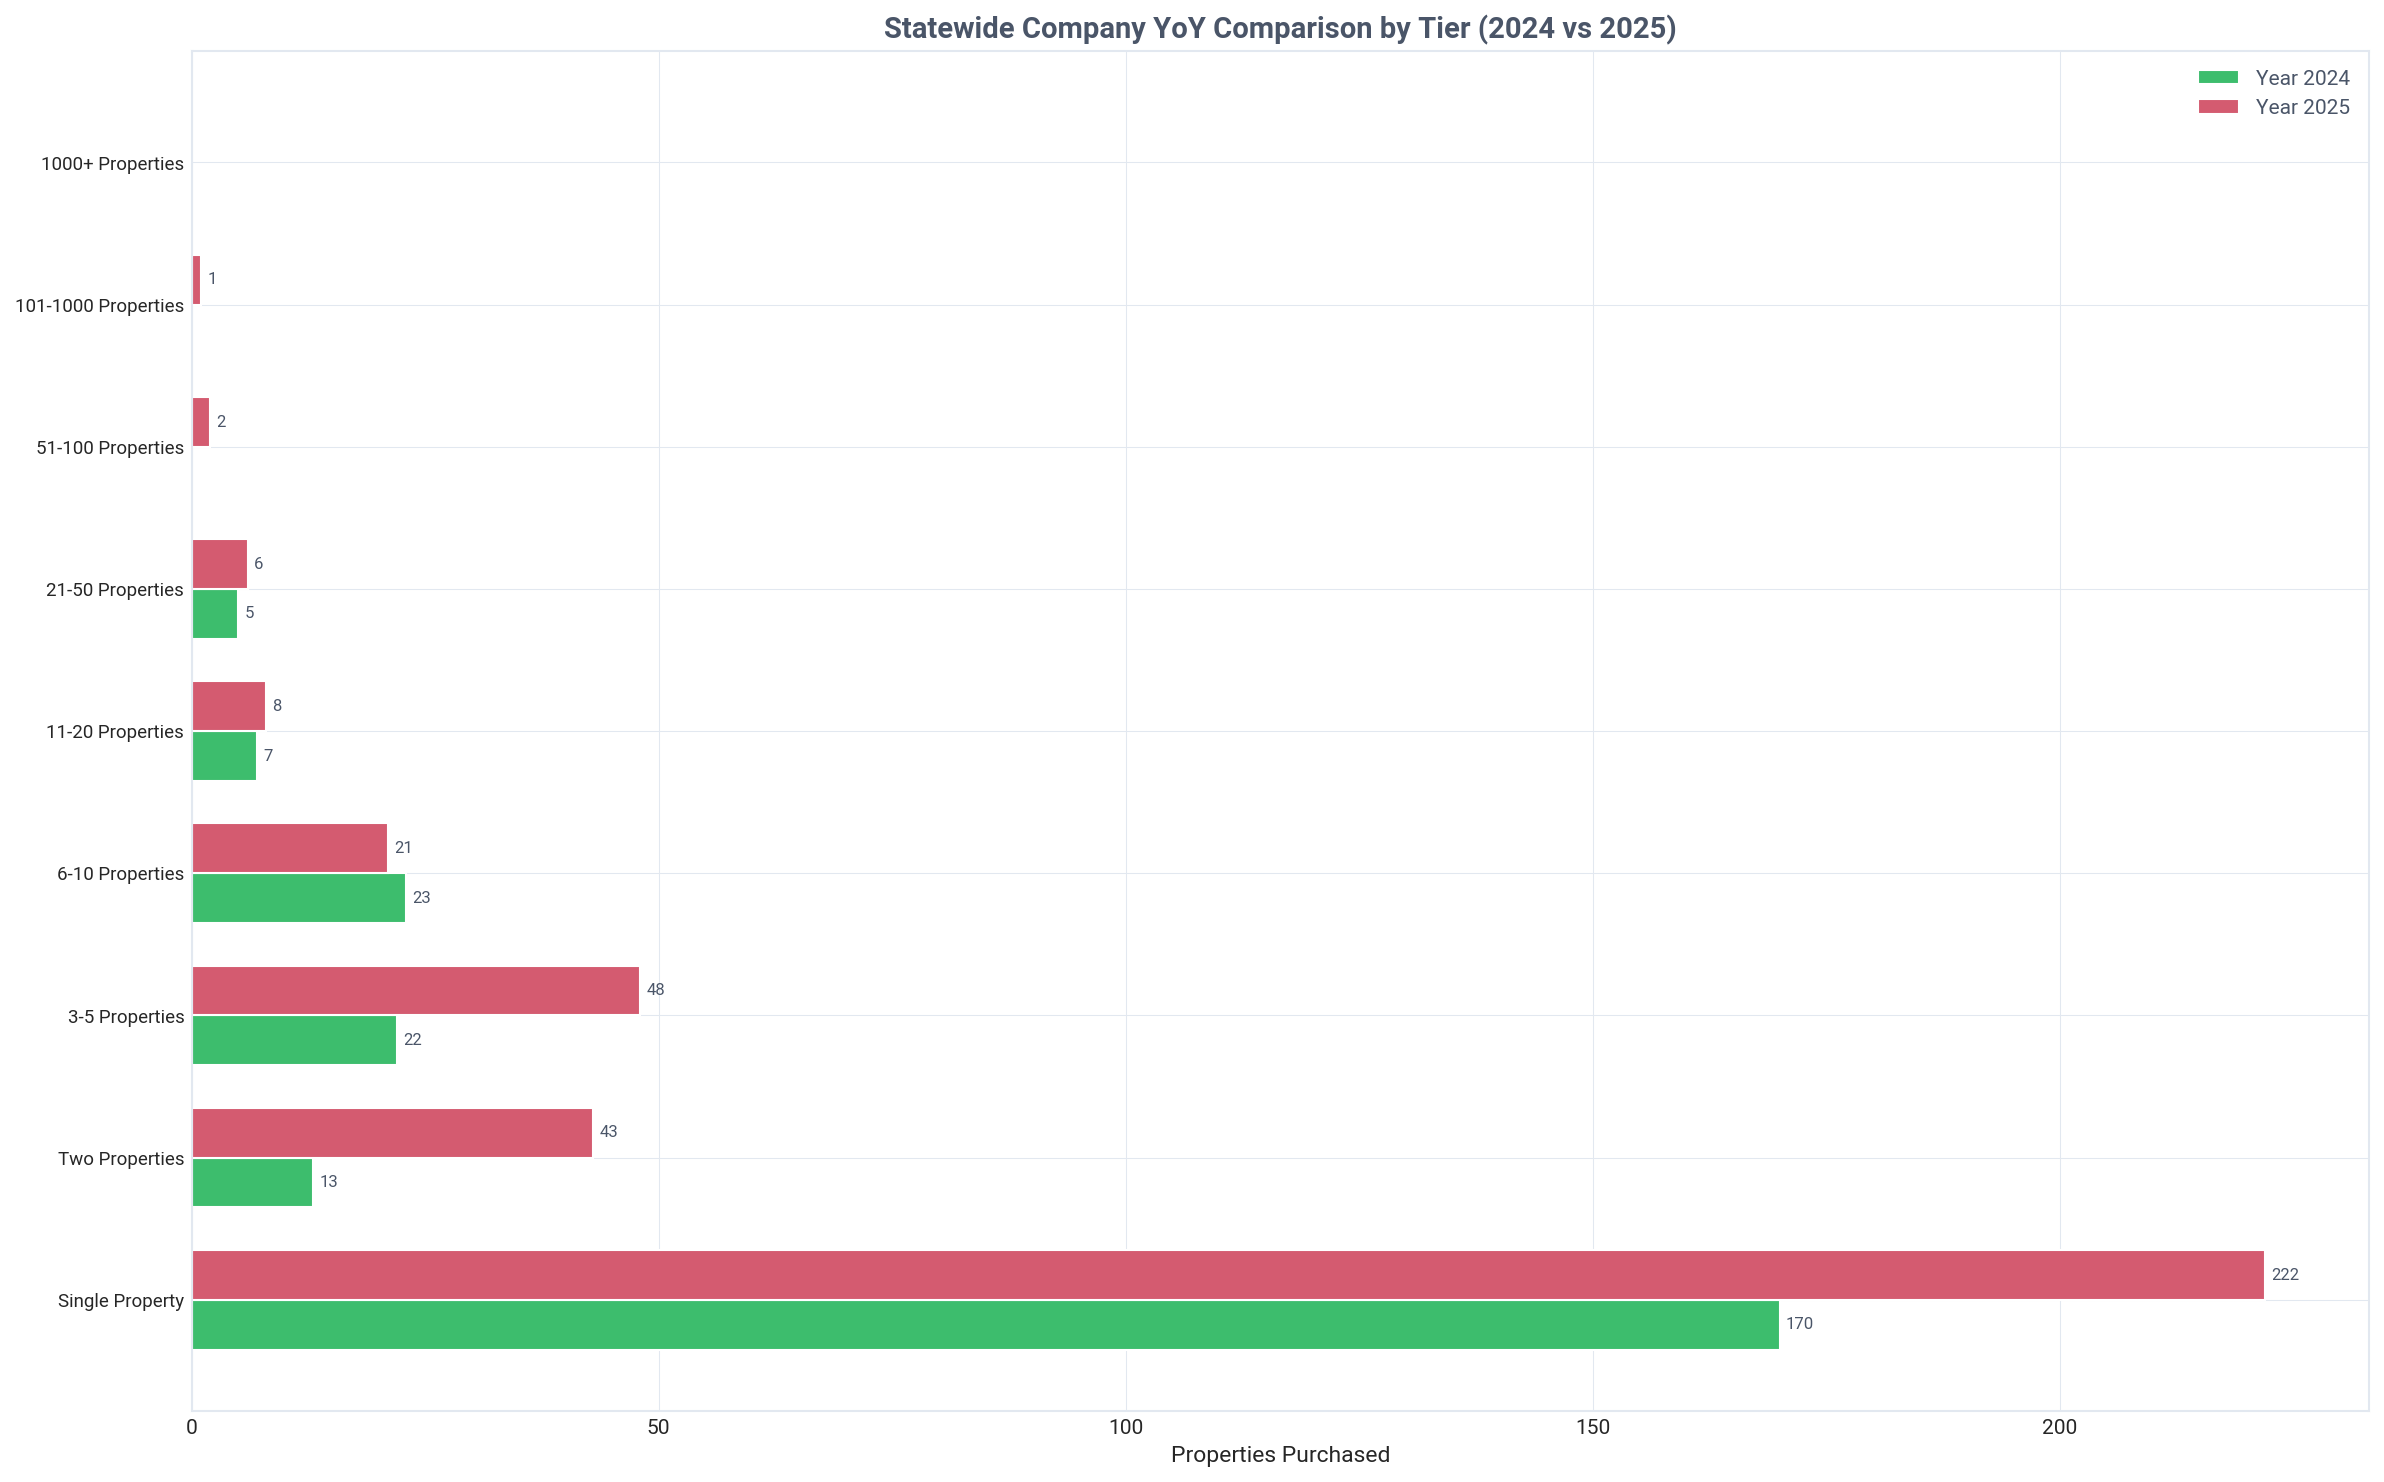
Rhode Island: company purchases by tier year over year, Q2 2026
Key Insight
Individuals dominate small portfolios, but companies become the majority owner (76.5%) at the 6-10 property tier.
Detailed Findings

Ownership structure shows a distinct evolution as investors scale their portfolios in Rhode Island. Individuals overwhelmingly own smaller portfolios, accounting for 88.2% of single-property holdings and 69.1% of two-property holdings. This reflects the typical entry point for new investors operating under personal ownership.

A significant strategic shift occurs once a portfolio reaches 6 to 10 properties. At this tier, company ownership jumps to 76.5%, making it the first level where corporations are the dominant owner type. This crossover point signals a professionalization threshold, where investors adopt formal business structures for liability protection and financial management.

The trend toward corporatization intensifies with size. For landlords holding 11-20 properties, company ownership reaches 88.5%. This indicates that scaling beyond 10 properties is almost universally accompanied by a move to an LLC or other corporate entity.

Even at the 3-5 property tier, which is still majority-owned by individuals (65.1%), a notable portion (34.9%) is held by companies. This suggests that a significant number of investors choose to incorporate their activities early in their investment journey.

This data illustrates a clear lifecycle for real estate investors in the state. Most begin as individuals, but as they achieve a modest level of scale, the operational and legal benefits of forming a company become a critical step in their growth.

Geographic Distribution

Regional breakdown of investor activity and ownership patterns

Key Insight
Investor activity is concentrated in Washington County, with 10,285 properties and a 22.9% ownership rate.
Detailed Findings

Investor ownership in Rhode Island is not evenly distributed, with heavy concentrations in specific counties. Washington County leads both in volume and density, with 10,285 investor-owned properties and an ownership rate of 22.9%. This means more than one in five SFRs in the county is an investment property.

Newport County also stands out as a hotspot for investment, with 5,388 properties and a 21.5% ownership rate. The high rates in both Washington and Newport counties likely reflect strong demand for vacation and seasonal rentals in these coastal areas, which can be further analyzed using demographic data.

Providence County presents a different market dynamic. While it has the second-highest absolute number of investor-owned homes at 8,524, its large total housing stock results in a much lower investor ownership rate of just 7.5%. This indicates a large, primarily owner-occupied market with investment activity that is broad but not deeply concentrated.

The remaining counties, Kent (7.3% rate) and Bristol (9.5% rate), have the lowest levels of investor penetration. This highlights a clear geographic divide in investor strategy, with a strong preference for coastal regions over the more central parts of the state.

The contrast between high-count areas like Providence and high-rate areas like Washington and Newport is critical. It shows that investors are targeting different types of opportunities: broad, stable rental markets in urban centers versus high-demand, potentially higher-yield markets in vacation destinations.

Rhode Island: landlord ownership map, Q2 2026
Rhode Island: top 15 areas by landlord-owned properties, Q2 2026
Rhode Island: top 15 areas by landlord ownership share, Q2 2026

Historical Transactions

Buy/sell transaction trends over time for all landlords and institutional investors

Rhode Island: landlord buy and sell transactions, Q2 2026
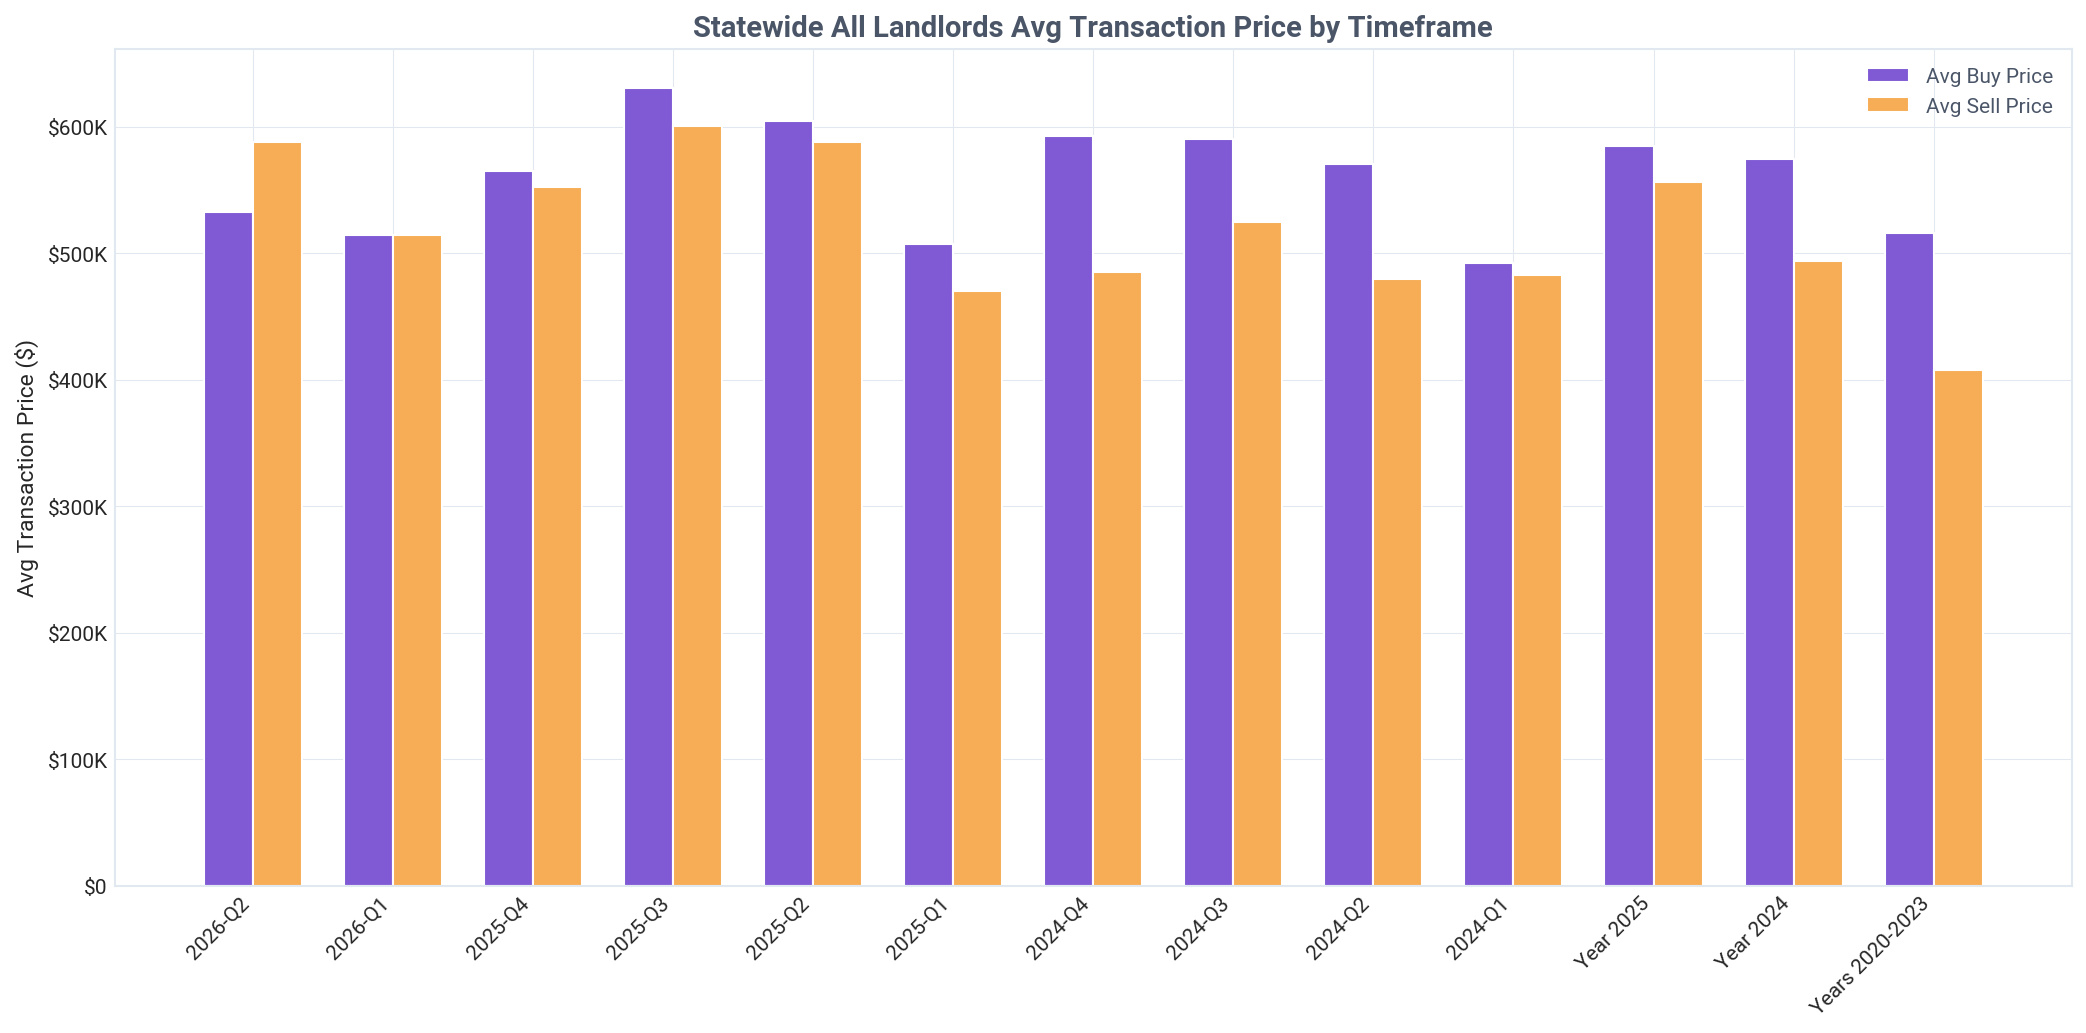
Rhode Island: landlord average buy and sell prices, Q2 2026
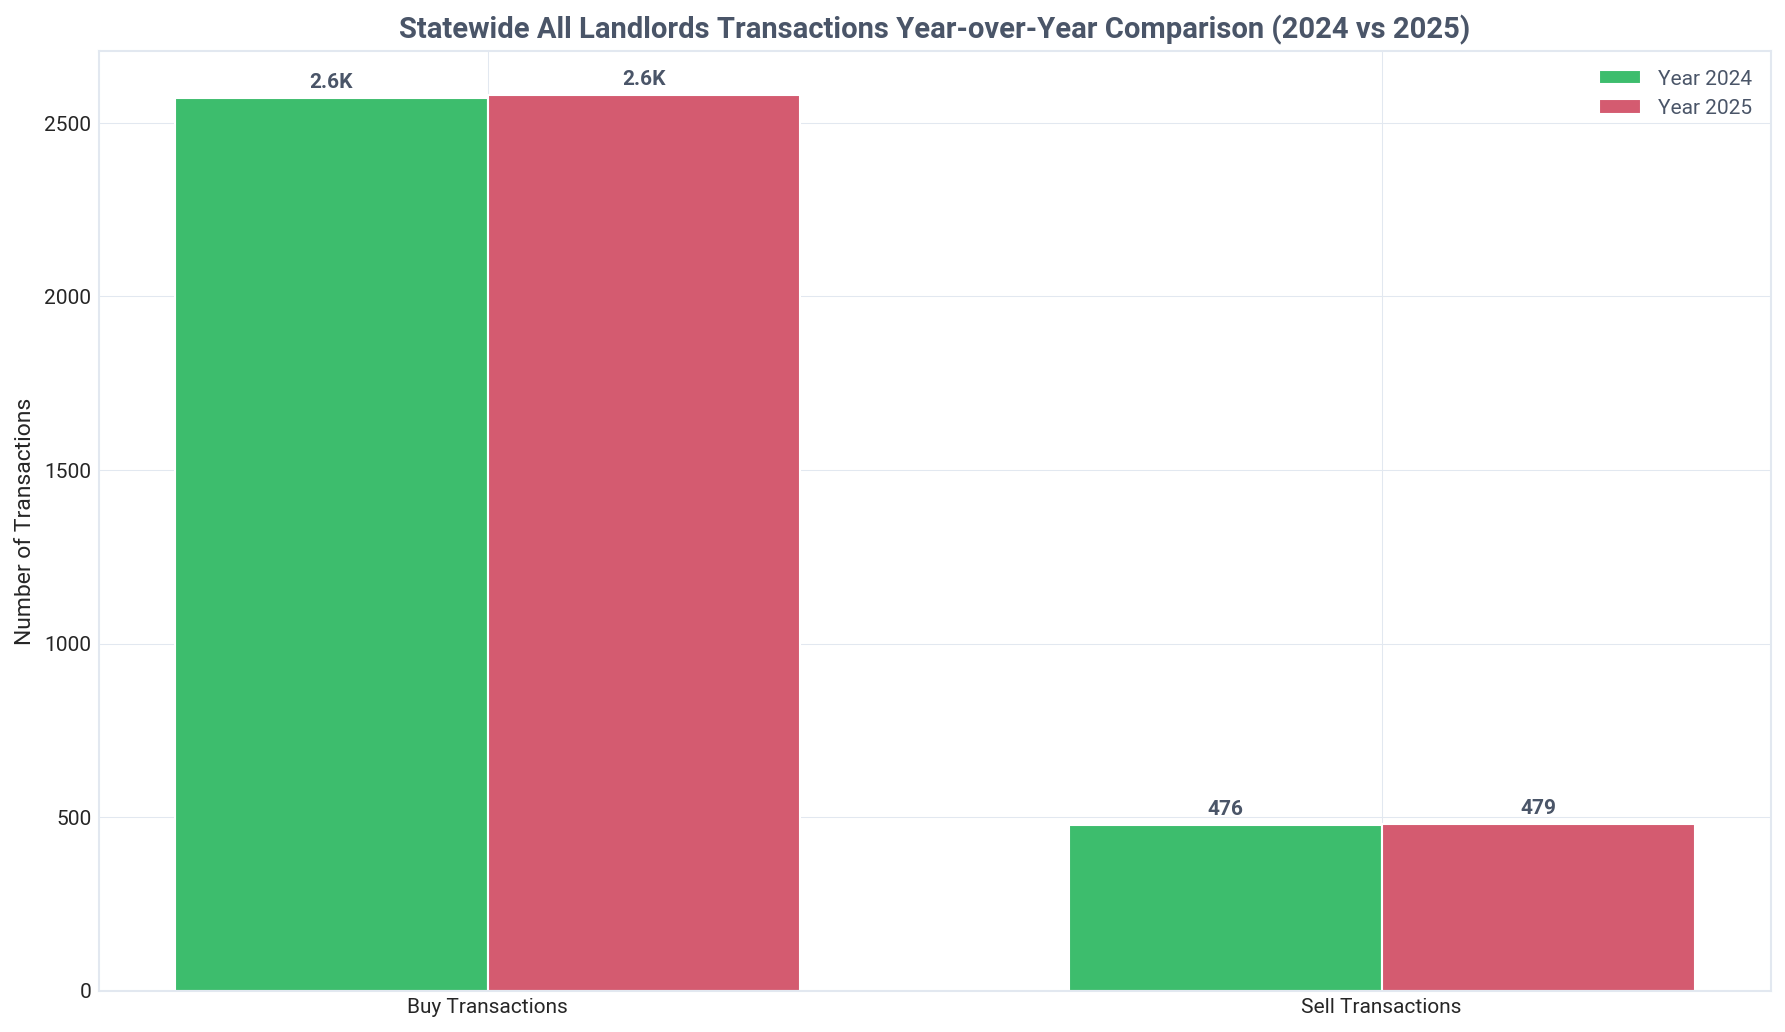
Rhode Island: landlord transactions year over year, Q2 2026
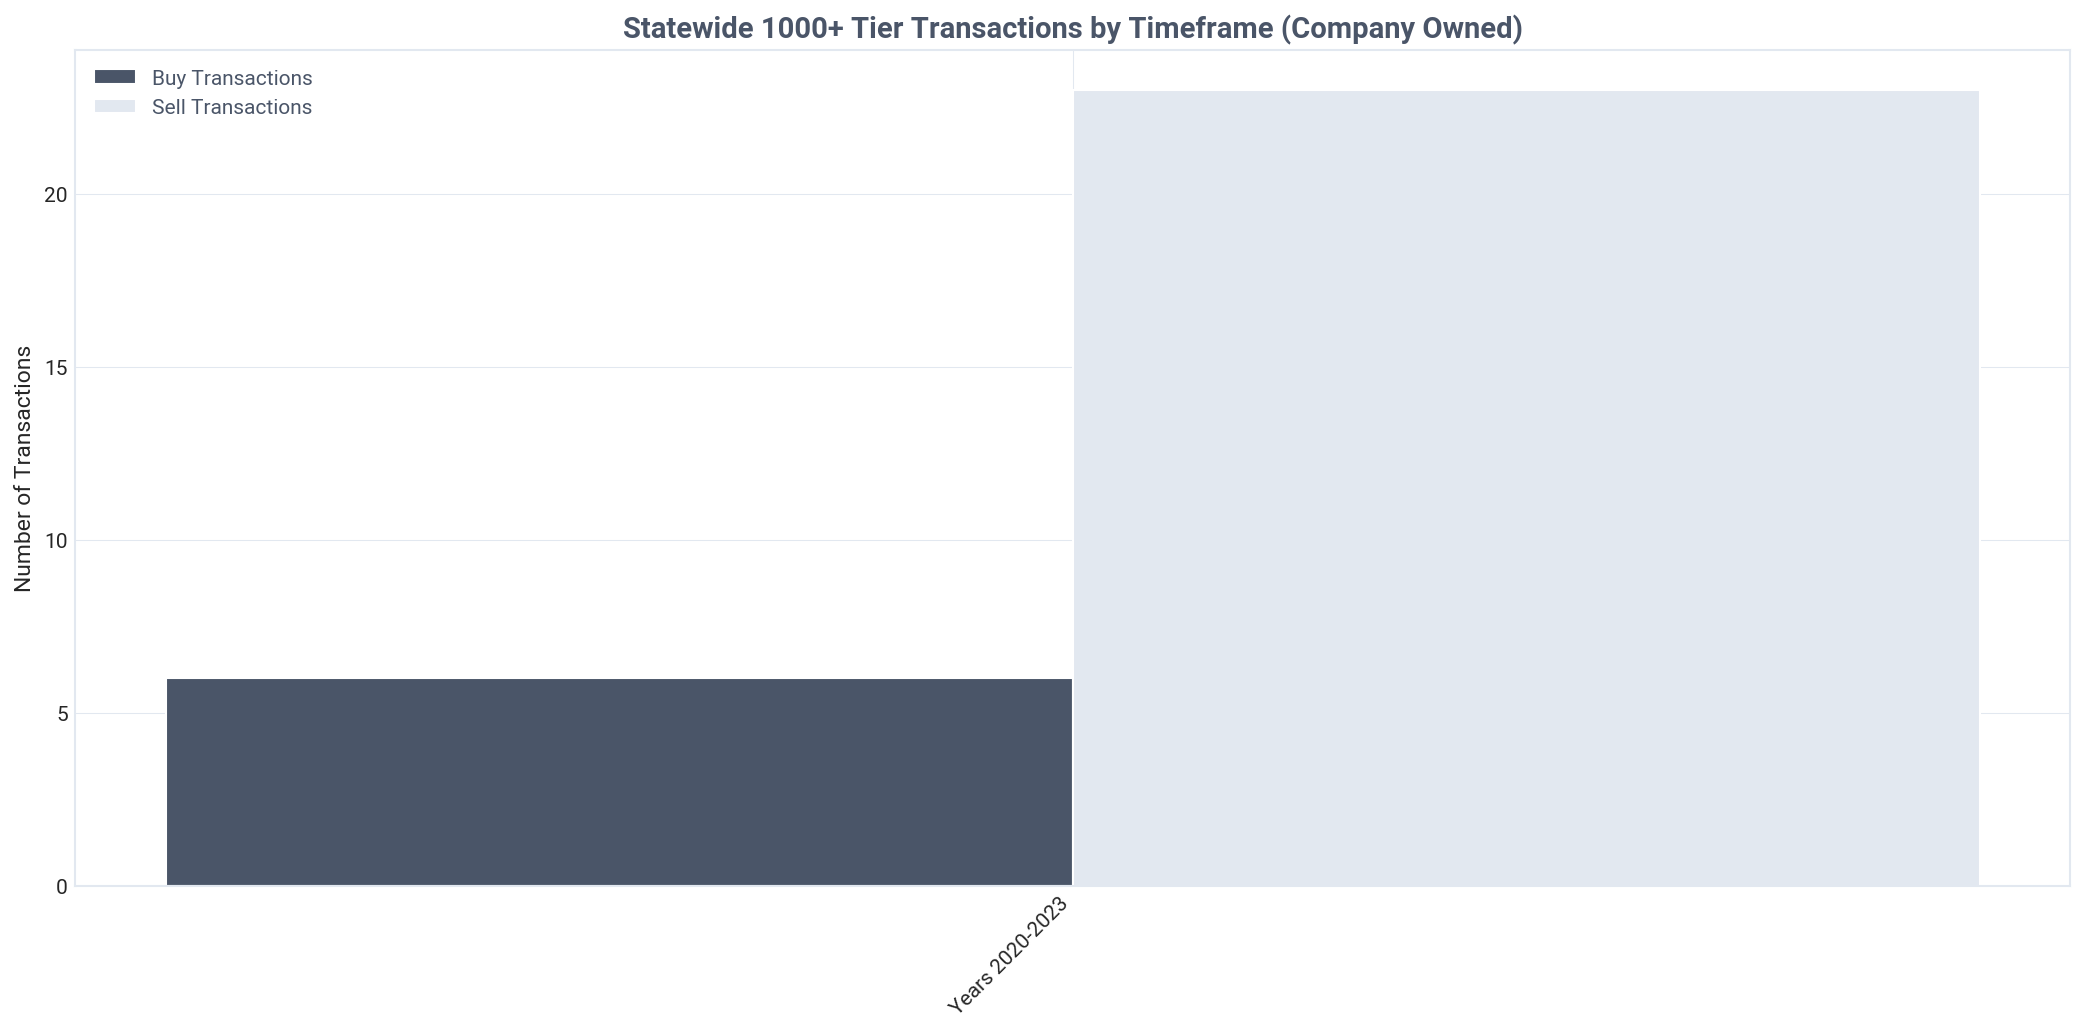
Rhode Island: 1000+ tier company transactions, Q2 2026
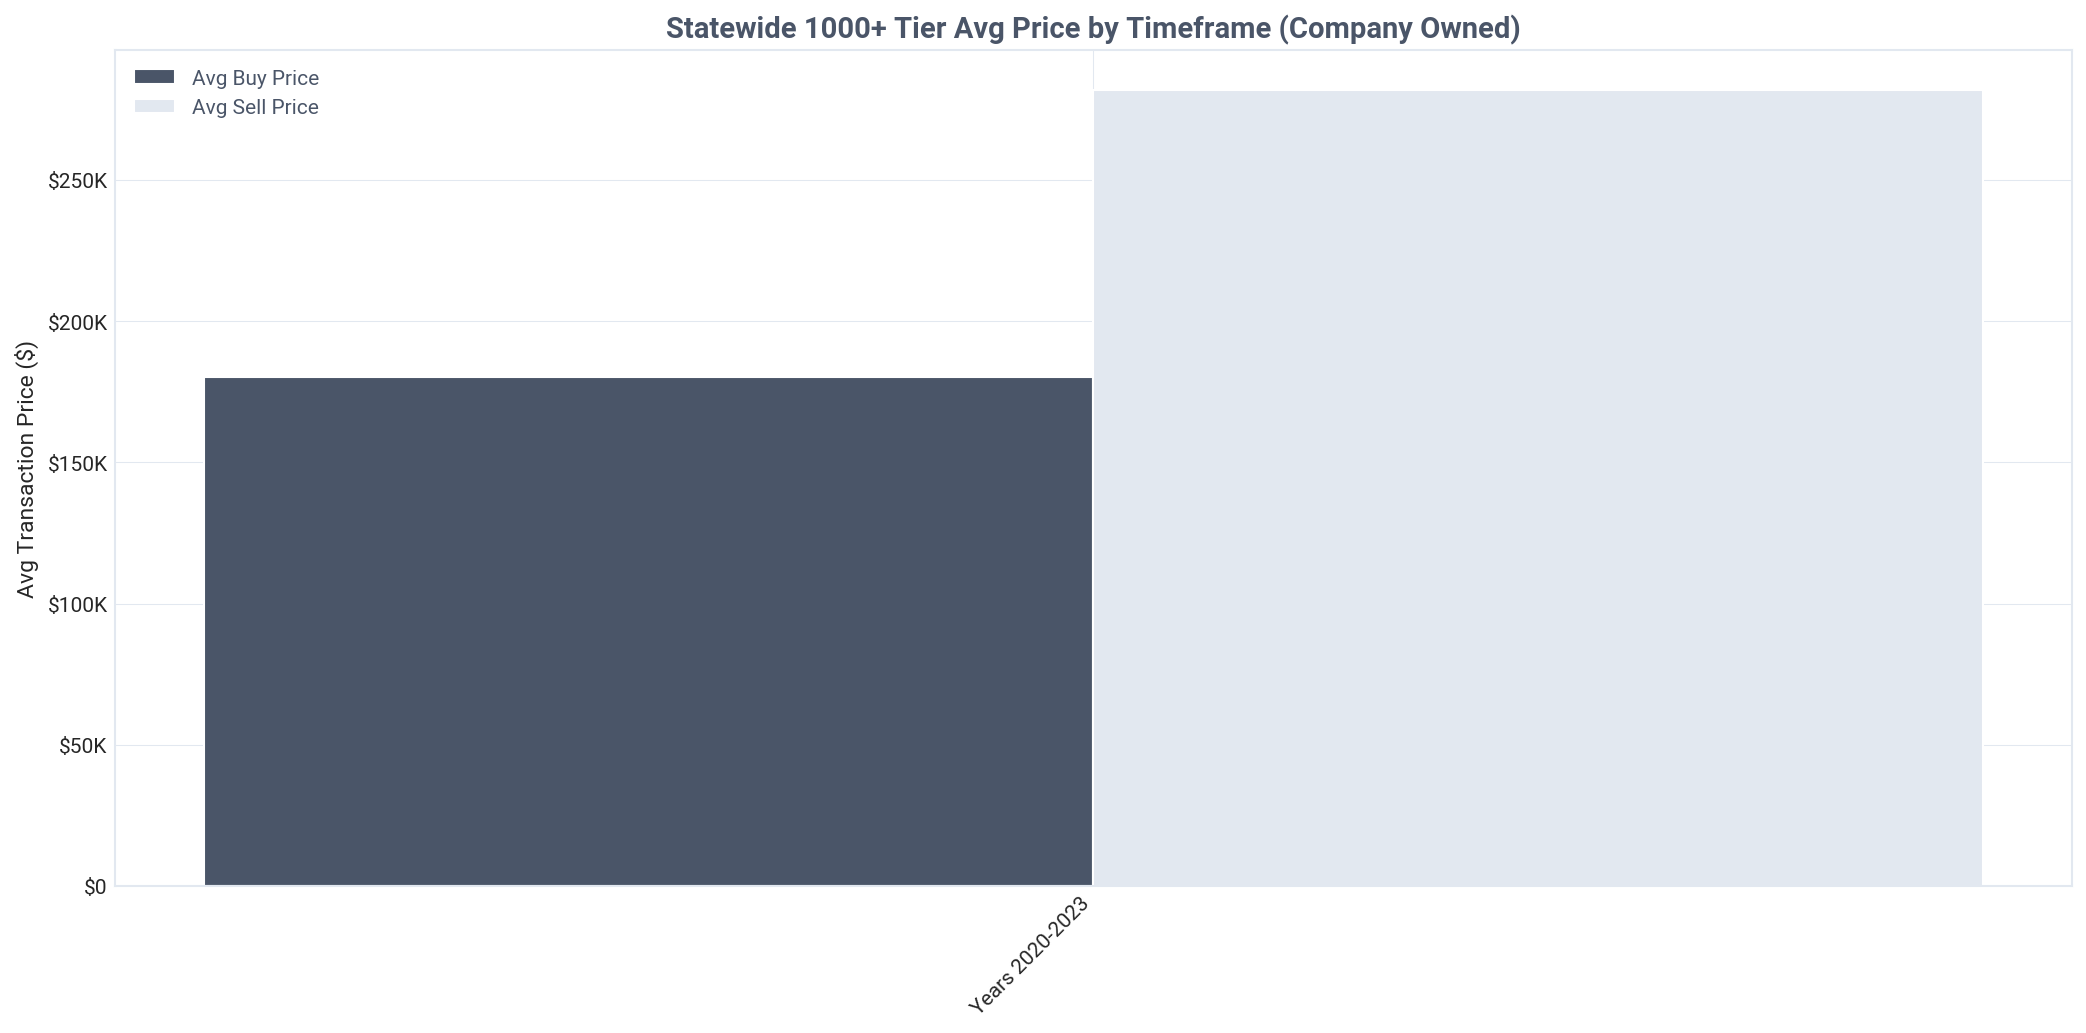
Rhode Island: 1000+ tier company average prices, Q2 2026
Key Insight
Landlords are strong net buyers, acquiring 549 properties and selling only 79 in Q2 2026.
Detailed Findings

Rhode Island's real estate investors are firmly in an accumulation phase, acting as strong net buyers in the market. In Q2 2026, they purchased 549 SFR properties while selling only 79, resulting in a net gain of 470 properties to their portfolios. This represents a buy-to-sell ratio of 6.95-to-1, signaling powerful confidence in the local market.

This aggressive net-buying behavior is not a new phenomenon. The trend has been remarkably consistent, with landlords adding a net 349 properties in Q1 2026 and 461 in Q4 2025. Over the full years of 2025 and 2024, investors added a net of 2,100 and 2,095 properties, respectively, demonstrating a sustained, multi-year strategy of portfolio growth.

The transaction data reveals no activity from institutional-grade (1,000+) investors. Their absence on both the buy and sell side aligns with their negligible ownership footprint in the state and confirms that market dynamics are driven exclusively by smaller players.

The high volume of acquisitions compared to dispositions suggests that investors see long-term value in the Rhode Island market. They are not engaging in short-term flipping but are instead focused on building and holding rental portfolios. This stability can be a positive indicator for the health of the rental market.

Overall, the persistent and high-ratio net buying across multiple quarters and years paints a clear picture of a confident, growing, and locally-driven investor base that is committed to expanding its footprint in the state.

Current Quarter Transactions

Q2 2026 transaction analysis by tier, price, and inter-landlord activity

Key Insight
Landlords were involved in 21.0% of all SFR transactions in Q2 2026, totaling 549 transactions.
Detailed Findings

In Q2 2026, landlords played a crucial role in market liquidity, participating in 21.0% of all single-family residential transactions. Their 549 transactions out of a market total of 2,616 show that roughly one in every five homes sold involved an investor on the buy side.

A distinct pricing pattern emerged among different investor tiers, with the least experienced investors paying the most. Single-property landlords (Tier 01) had the highest average purchase price at $549,973. This is in sharp contrast to the $315,104 average paid by more established landlords in the 6-10 property tier.

The $234,869 price gap between new and small-to-mid-size investors suggests different acquisition strategies. New investors may be buying recently renovated, turnkey properties at a premium, while more seasoned landlords may be targeting distressed or value-add opportunities at a lower price point, potentially using platforms that provide assessor data to find such properties.

Inter-landlord trading was not a primary source of inventory for new buyers. Only 7.2% of properties purchased by single-property investors were acquired from another landlord. This indicates that new entrants are overwhelmingly competing with traditional homebuyers for properties listed on the open market.

Conversely, slightly larger investors showed a greater tendency to buy from peers. Landlords in the two-property tier sourced 17.9% of their acquisitions from other investors, and those in the 21-50 tier sourced 25.0%, suggesting a more developed network for off-market or specialized deals as investors gain experience.

Rhode Island: landlord share of transactions, Q2 2026
Rhode Island: transactions by tier this quarter, Q2 2026
Rhode Island: average purchase price by tier, Q2 2026

Ready to leverage this data for your real estate investment decisions?

TALK TO AN EXPERT

Executive Summary

Rhode Island's investor market is dominated by mom-and-pop landlords, who control 99.3% of rentals and are aggressive net buyers.
Holdings
Landlords own 29,043 SFR properties, representing 11.8% of Rhode Island's market. Individual investors are the dominant force, holding 87.5% of these properties compared to 14.8% for companies.
Pricing
In Q2 2026, landlords paid an average of $554,430, securing a significant 14.2% discount compared to traditional homeowners, which translates to a savings of $91,423 per property.
Activity
Investor activity was strong in Q2 2026, with landlords purchasing 416 properties, or 23.0% of all SFR sales. The market saw an influx of new participants, with 453 single-property landlords making their first purchase.
Market Share
The market is overwhelmingly controlled by small investors, with mom-and-pop landlords (1-10 properties) owning 99.3% of all investor-held SFRs. In stark contrast, institutional investors (1000+) have a negligible presence, holding just 0.0% of the portfolio.
Ownership Type
Individual investors dominate smaller portfolios, but a clear professionalization trend emerges as companies become the majority owner (76.5%) in the 6-10 property tier.
Transactions
Landlords are in a strong accumulation phase, acting as net buyers with a 6.95-to-1 buy/sell ratio in Q2 2026 (549 buys vs. 79 sells). Institutional investors were entirely inactive on both sides of transactions.
Market Narrative

The Rhode Island single-family rental market is characterized by its highly decentralized and locally driven nature, as detailed in this Investor Pulse reports. Investors own 29,043 SFR properties, accounting for 11.8% of the state's total housing stock. Ownership is firmly in the hands of individuals, who control 87.5% of the portfolio. The market structure defies the narrative of corporate consolidation; mom-and-pop landlords (1-10 properties) command an overwhelming 99.3% share, while institutional investors (1,000+ properties) have a virtually nonexistent footprint at just 0.0%.

Investor behavior in Q2 2026 underscores a confident and expanding market. Landlords were responsible for 23.0% of all home purchases, signaling strong demand. They also demonstrated a significant pricing advantage, acquiring properties at a 14.2% discount compared to traditional homeowners. This period also saw a notable influx of 453 new landlords entering the market. Transaction data reveals a clear accumulation strategy, with investors acting as aggressive net buyers, purchasing nearly seven homes for every one they sold (a 6.95-to-1 buy/sell ratio).

The key takeaway for the Rhode Island housing market is that it is shaped not by Wall Street, but by small, local entrepreneurs. The market's health and growth are fueled by the continuous entry of new individual investors and the expansion of small portfolios. Investment is geographically concentrated in coastal areas like Washington and Newport counties, which have investor ownership rates above 20%. The combination of decentralized ownership, strong net buying, and a steady stream of new entrants points to a resilient and competitive rental market for the foreseeable future, a topic often covered in our market reports.

About This Report

Report Methodology

This report analyzes BatchData's Investor Pulse dataset, covering single-family residential (SFR) investor activity across the United States.

Data is extracted from 15 CSV files covering ownership, transactions, and pricing trends, then analyzed using AI-powered insights.

Property Counting Methodology:

Distinct Counts: All headline totals represent distinct properties. If 2+ landlords co-own the same property, it's counted only once. This provides accurate market representation.

Category Breakdowns: When analyzing by tier (01-09), owner type (Individual/Corporate), or occupancy status, properties with co-ownership across categories are counted once per category. This causes breakdowns to sum 2-4% higher than totals, and percentages may sum to 100-104%. This is expected and reflects co-ownership patterns.

Tier Properties Category
01-041-10Mom-and-Pop
05-0711-100Mid-Size
08101-1000Large
091000+Institutional
About BatchData

BatchData provides comprehensive real estate data and analytics, offering insights into property ownership, investor activity, and market trends across the United States.

The Investor Pulse dataset tracks single-family residential (SFR) investor behavior at national, state, county, and MSA levels.

For more information, visit batchdata.io or explore our API documentation.

Data Freshness
Report Generated October 29, 2026 at 12:30 AM
Data Period Q2 2026
Geography Level State
Geography Rhode Island
×
Chart Section2 Coverage
Rhode Island: SFR vs other property coverage, Q2 2026
×
Chart Section3 Ownership Donut
Rhode Island: SFR ownership share, company vs individual, Q2 2026
×
Chart Section3 Ownership Bar
Rhode Island: SFR properties by owner type, Q2 2026
×
Chart Section4 Distribution
Rhode Island: company vs individual landlords, Q2 2026
×
Chart Section5 Holdings
Rhode Island: landlord SFR holdings by type, Q2 2026
×
Chart Section6 Prices
Rhode Island: properties purchased by timeframe, Q2 2026
×
Chart Section6 Prices Alt
Rhode Island: average acquisition price by timeframe, Q2 2026
×
Chart Section6 Yoy Comparison
Rhode Island: average acquisition price year over year, Q2 2026
×
Chart Section6 Trends
Rhode Island: average acquisition price by buyer type, Q2 2026
×
Chart Section7 Purchases
Rhode Island: purchases by tier, Q2 2026
×
Chart Section7 Tiers
Rhode Island: purchased property share by tier, Q2 2026
×
Chart Section8 Distribution
Rhode Island: current ownership by purchase tier, Q2 2026
×
Chart Section8 Prices
Rhode Island: properties purchased by tier, all time, Q2 2026
×
Chart Section8 Prices Q4
Rhode Island: properties purchased by tier this quarter, Q2 2026
×
Chart Section8 Prices 2020
Rhode Island: properties purchased by tier, historical, Q2 2026
×
Chart Section8 Yoy Comparison
Rhode Island: properties purchased by tier year over year, Q2 2026
×
Chart Section9 Ownership
Rhode Island: ownership by tier and owner type, Q2 2026
×
Chart Section9 Growth
Rhode Island: company purchases by tier, all time, Q2 2026
×
Chart Section9 Growth Q4
Rhode Island: company purchases by tier this quarter, Q2 2026
×
Chart Section9 Yoy Comparison
Rhode Island: company purchases by tier year over year, Q2 2026
×
Chart Section10 Top Regions
Rhode Island: top 15 areas by landlord-owned properties, Q2 2026
×
Chart Section10 Top Pct
Rhode Island: top 15 areas by landlord ownership share, Q2 2026
×
Chart Section10 Map
Rhode Island: landlord ownership map, Q2 2026
×
Chart Section11 Buysell
Rhode Island: landlord buy and sell transactions, Q2 2026
×
Chart Section11 Buysell Price
Rhode Island: landlord average buy and sell prices, Q2 2026
×
Chart Section11 Yoy All Landlords
Rhode Island: landlord transactions year over year, Q2 2026
×
Chart Section11 Institutional
Rhode Island: 1000+ tier company transactions, Q2 2026
×
Chart Section11 Institutional Price
Rhode Island: 1000+ tier company average prices, Q2 2026
×
Chart Section12 Transactions
Rhode Island: landlord share of transactions, Q2 2026
×
Chart Section12 Prices
Rhode Island: transactions by tier this quarter, Q2 2026
×
Chart Section12 Prices Detail
Rhode Island: average purchase price by tier, Q2 2026

Licensing & Usage Rights

This report, data, and all visual analyses are the property of BatchData © 2026 BatchService, Inc. and are licensed under Creative Commons Attribution-NonCommercial-NoDerivatives 4.0 International (CC BY-NC-ND 4.0).

You MAY: Download, share, or excerpt this content for personal or non-commercial purposes, provided you give clear attribution to BatchData with a link back to this original page.

You MAY NOT: Use this data commercially, resell or redistribute it as your own, or publish modified versions.

For commercial licensing: batchdata.io/contact-sales

Creative Commons BY-NC-ND 4.0 - creativecommons.org/licenses/by-nc-nd/4.0/

How to cite this report

BatchData. (2026). Q2 2026 RI State Report. BatchService, Inc. Retrieved from https://reports.batchdata.io/investorpulse-reports/2026-q2-state-ri/. Licensed under CC BY-NC-ND 4.0.