Oklahoma Investor Pulse Report (2026-Q2)

Real Estate comprehensive investment analysis of investor activity in the Oklahoma single-family residential housing market. Discover ownership trends, transaction patterns, and market insights.

Market Overview

Total SFR Properties in Oklahoma
1,190,048
Total Investors in Oklahoma
266,727
Investor Owned SFR in Oklahoma
275,483(23.1%)
Individual Landlords
Landlords
227,248
SFR Owned
187,734
Corporate Landlords
Landlords
39,479
SFR Owned
92,389
Understanding Property Counts

Distinct Count Methodology: The total 275,483 represents distinct properties - if 2+ landlords co-own the same property, it's counted only once. This provides the most accurate representation of investor-owned SFR properties.

Why totals don't sum: When broken down by Individual vs Corporate ownership (or by tier), properties with co-ownership across categories are counted once per category. For example, if a property is co-owned by an individual AND a corporate landlord, it appears in both counts. This is why Individual + Corporate totals may exceed the distinct total by 2-4%, and percentages may sum to 100-104%.

Market Visualization

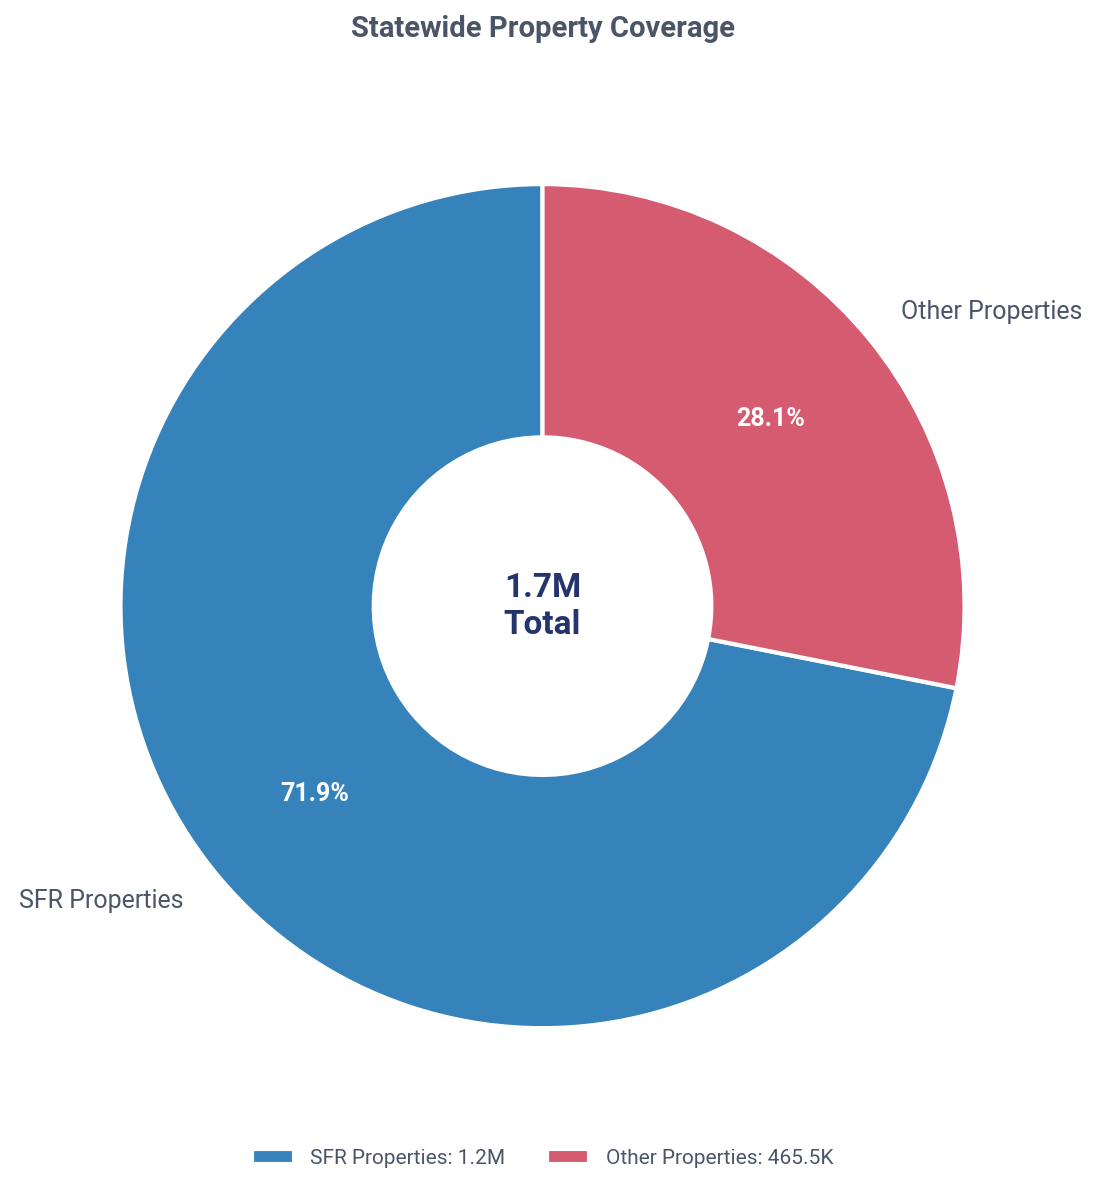
Oklahoma: SFR vs other property coverage, Q2 2026
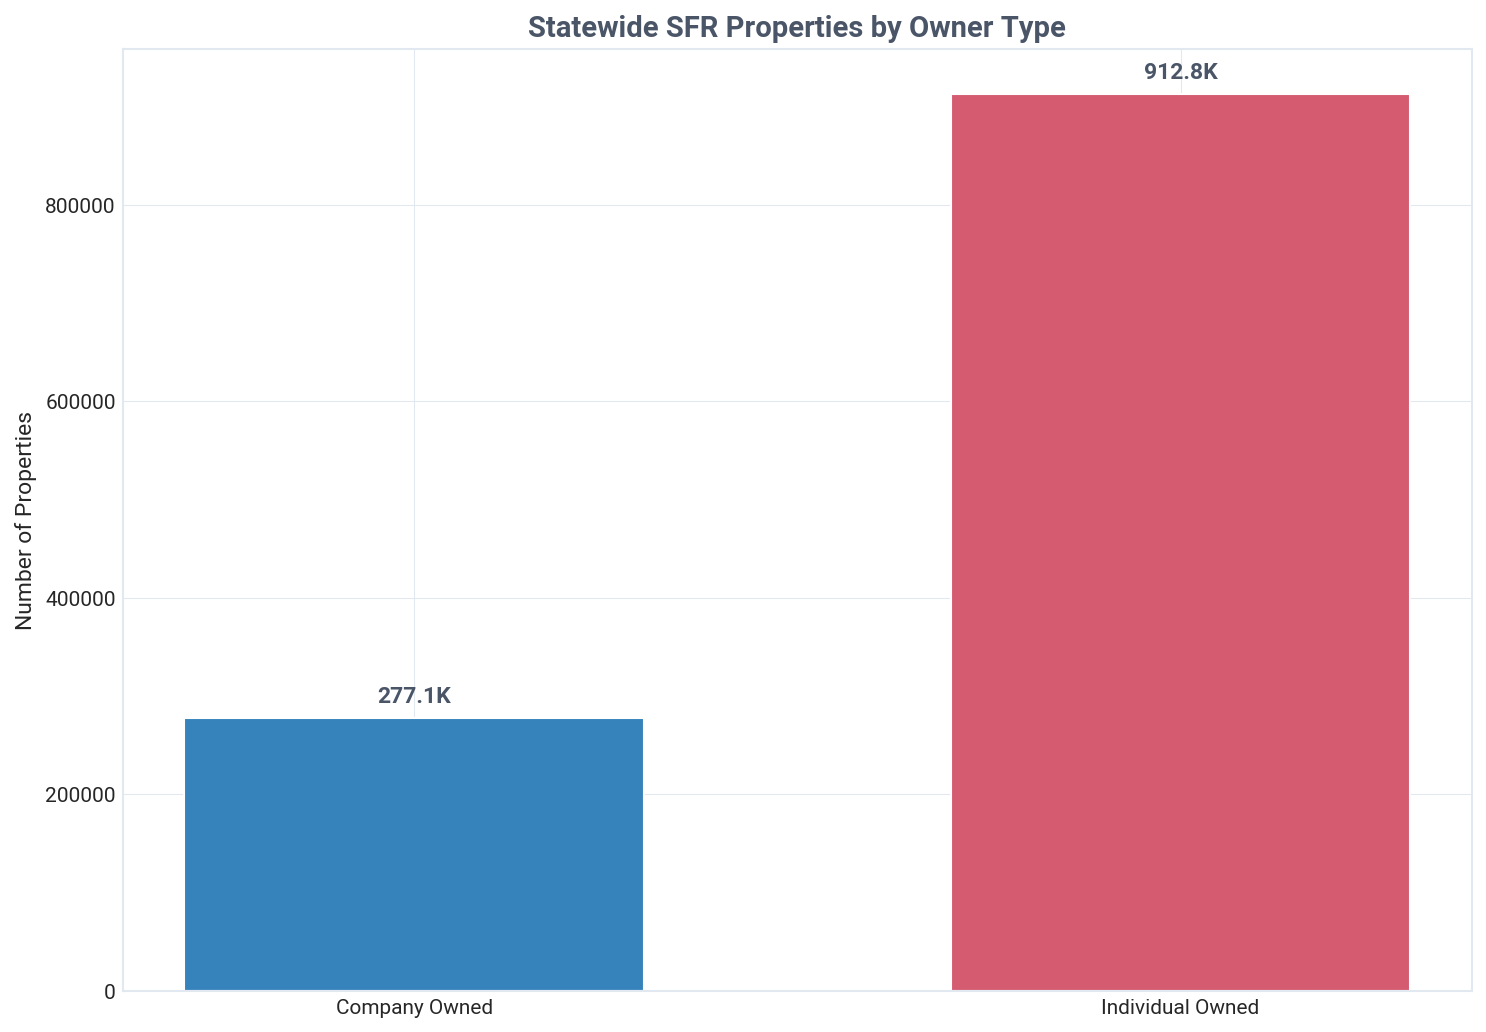
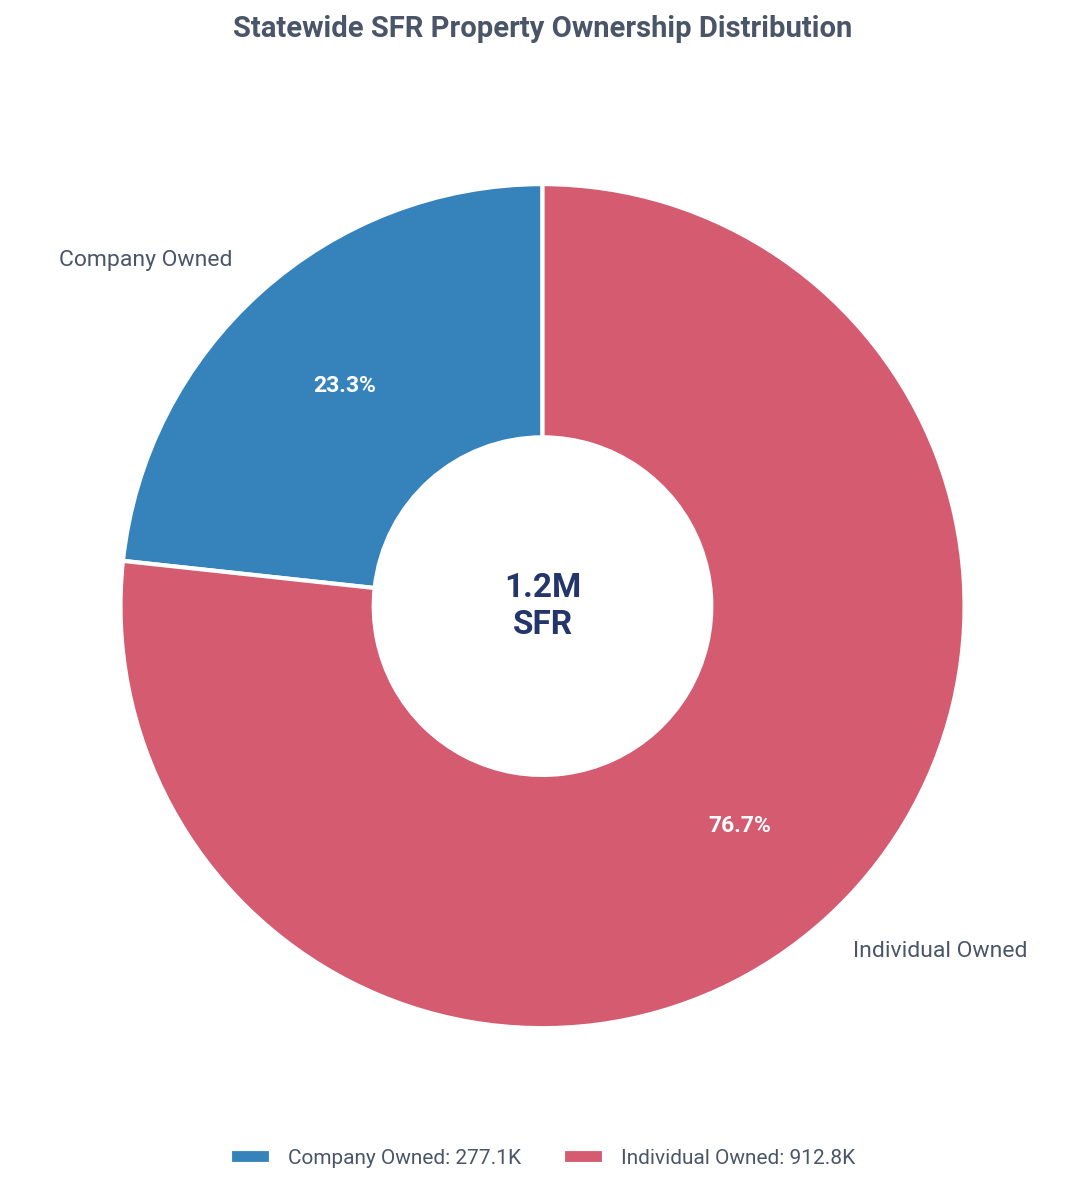
Oklahoma: SFR ownership share, company vs individual, Q2 2026
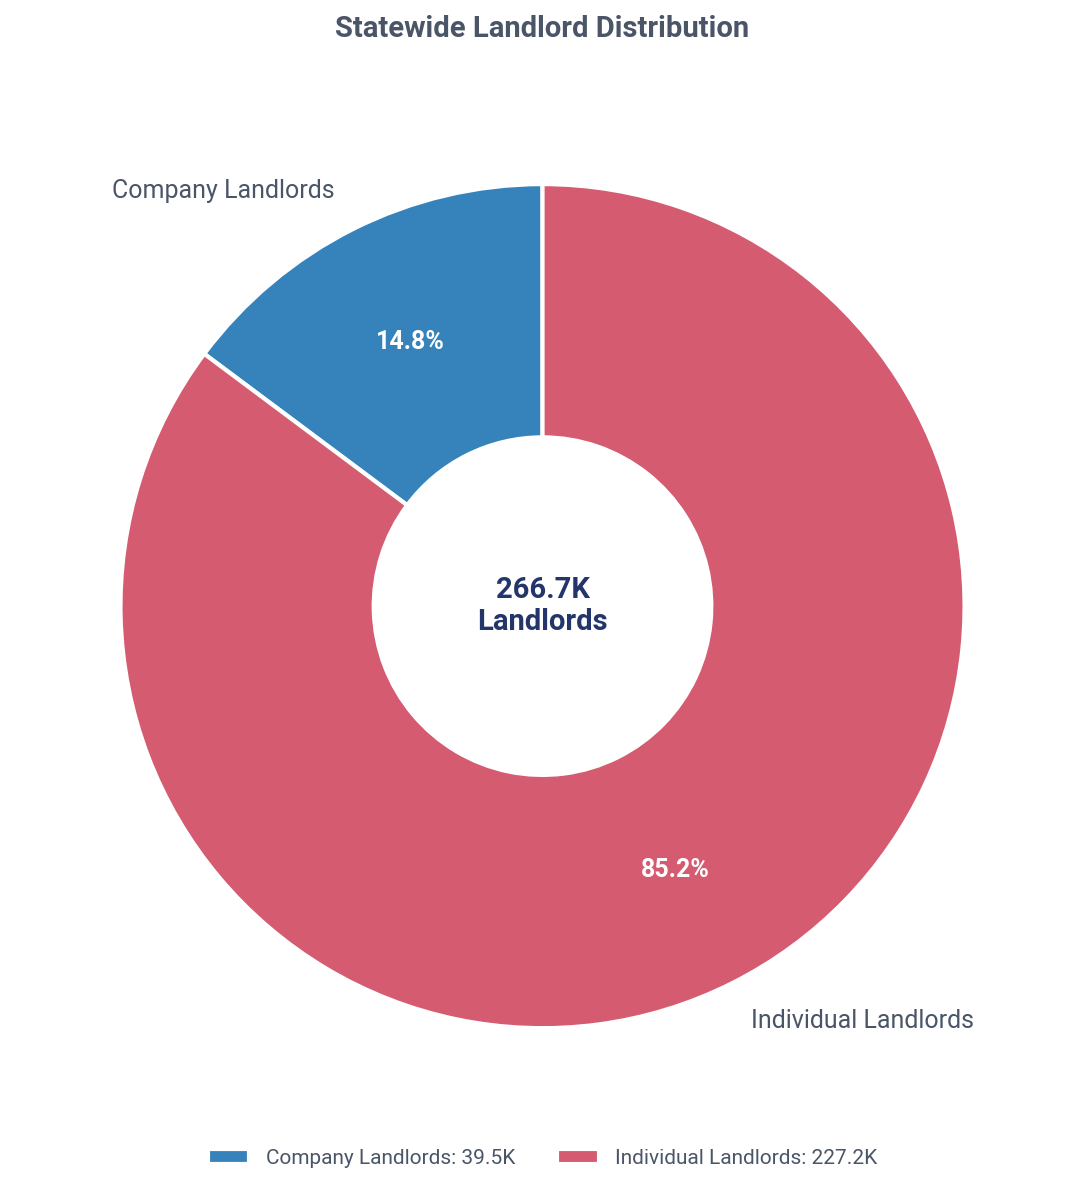
Oklahoma: company vs individual landlords, Q2 2026

Key Market Insights

Mom-and-Pop Landlords Dominate Oklahoma's Market With 85.5% Ownership, Securing Massive 29% Price Discounts
Investors now own 275,483 SFR properties in Oklahoma, representing 23.1% of the total market. This landscape is controlled by small landlords (1-10 properties) who hold 85.5% of the inventory, while institutional investors own just 1.0%. In Q2 2026, landlords were net buyers and acquired properties at a remarkable 29.2% discount compared to traditional homeowners.
Landlord Owned Current Holdings
Investors own 275,483 SFR properties in Oklahoma, with individual investors holding 68.1% of the portfolio.
The vast majority of investor-owned properties are held with cash (72.5%) rather than financing (27.5%). The portfolio is intensely focused on rentals, with 96.4% of properties classified as non-owner-occupied. Individual landlords make up 85.2% of all investor entities, far outnumbering companies.
Landlord vs Traditional Homeowners
In Q2 2026, Oklahoma landlords paid 29.2% less than homeowners, a massive discount of $88,711 per property.
The price gap between landlords and homeowners has been widening, increasing from a 25.2% discount in Q4 2025 to 29.2% in Q2 2026. Since the 2020-2023 period, the average landlord acquisition price has appreciated by 19.4%, rising from $180,372 to $215,407.
Current Quarter Purchases
Landlords acquired 20.2% of all single-family homes sold in Oklahoma during Q2 2026, totaling 3,021 properties.
Mom-and-pop investors (1-10 properties) drove the market, accounting for 78.2% of all landlord purchases. In contrast, institutional investors (1000+ properties) made up just 2.4% of buying activity. A wave of 1,889 new single-property landlords entered the market this quarter.
Ownership by Tier
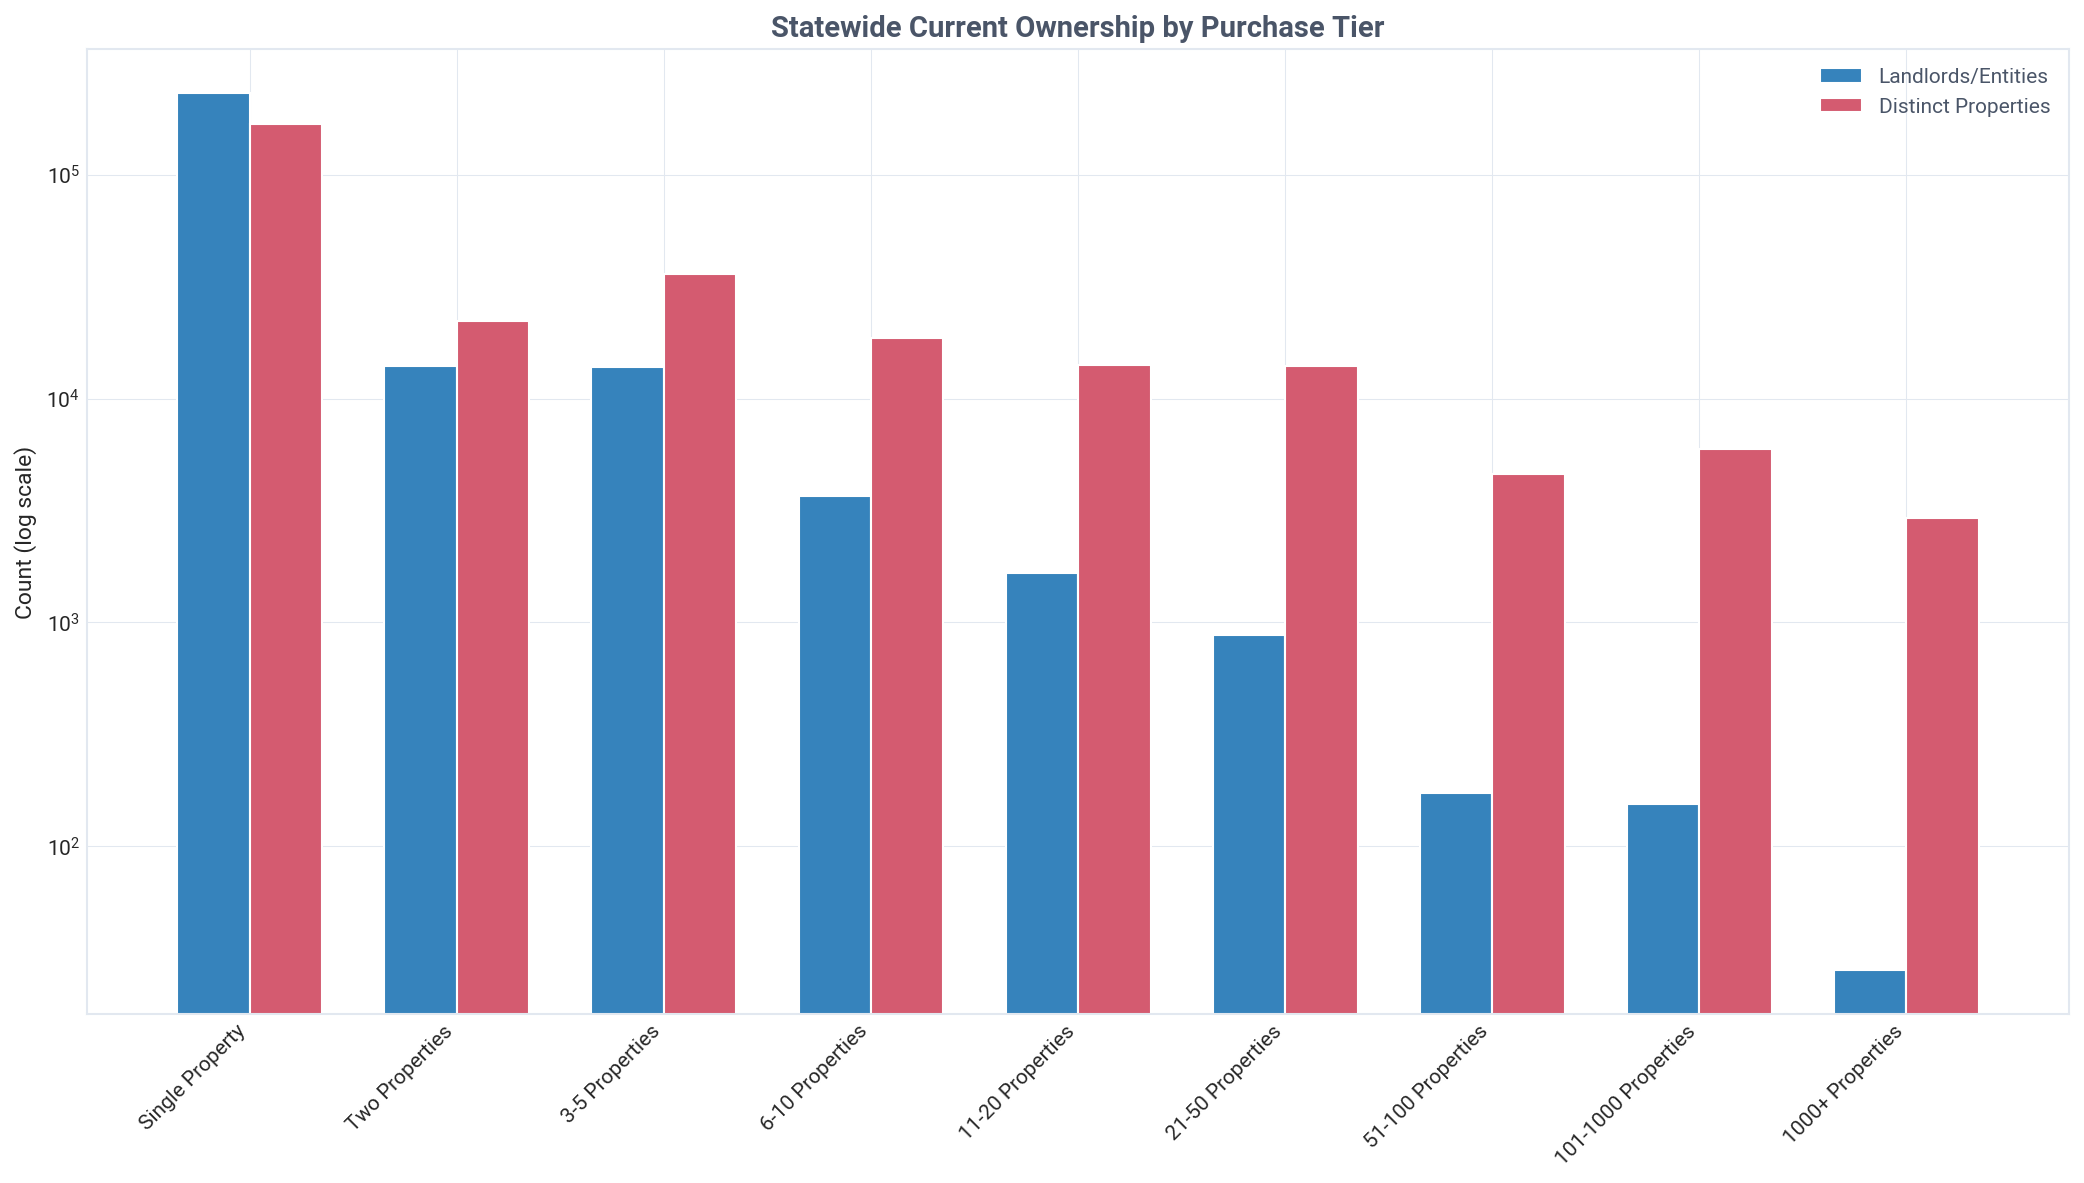
Mom-and-pop landlords own a commanding 85.5% of Oklahoma's investor-held SFR housing, while institutions own just 1.0%.
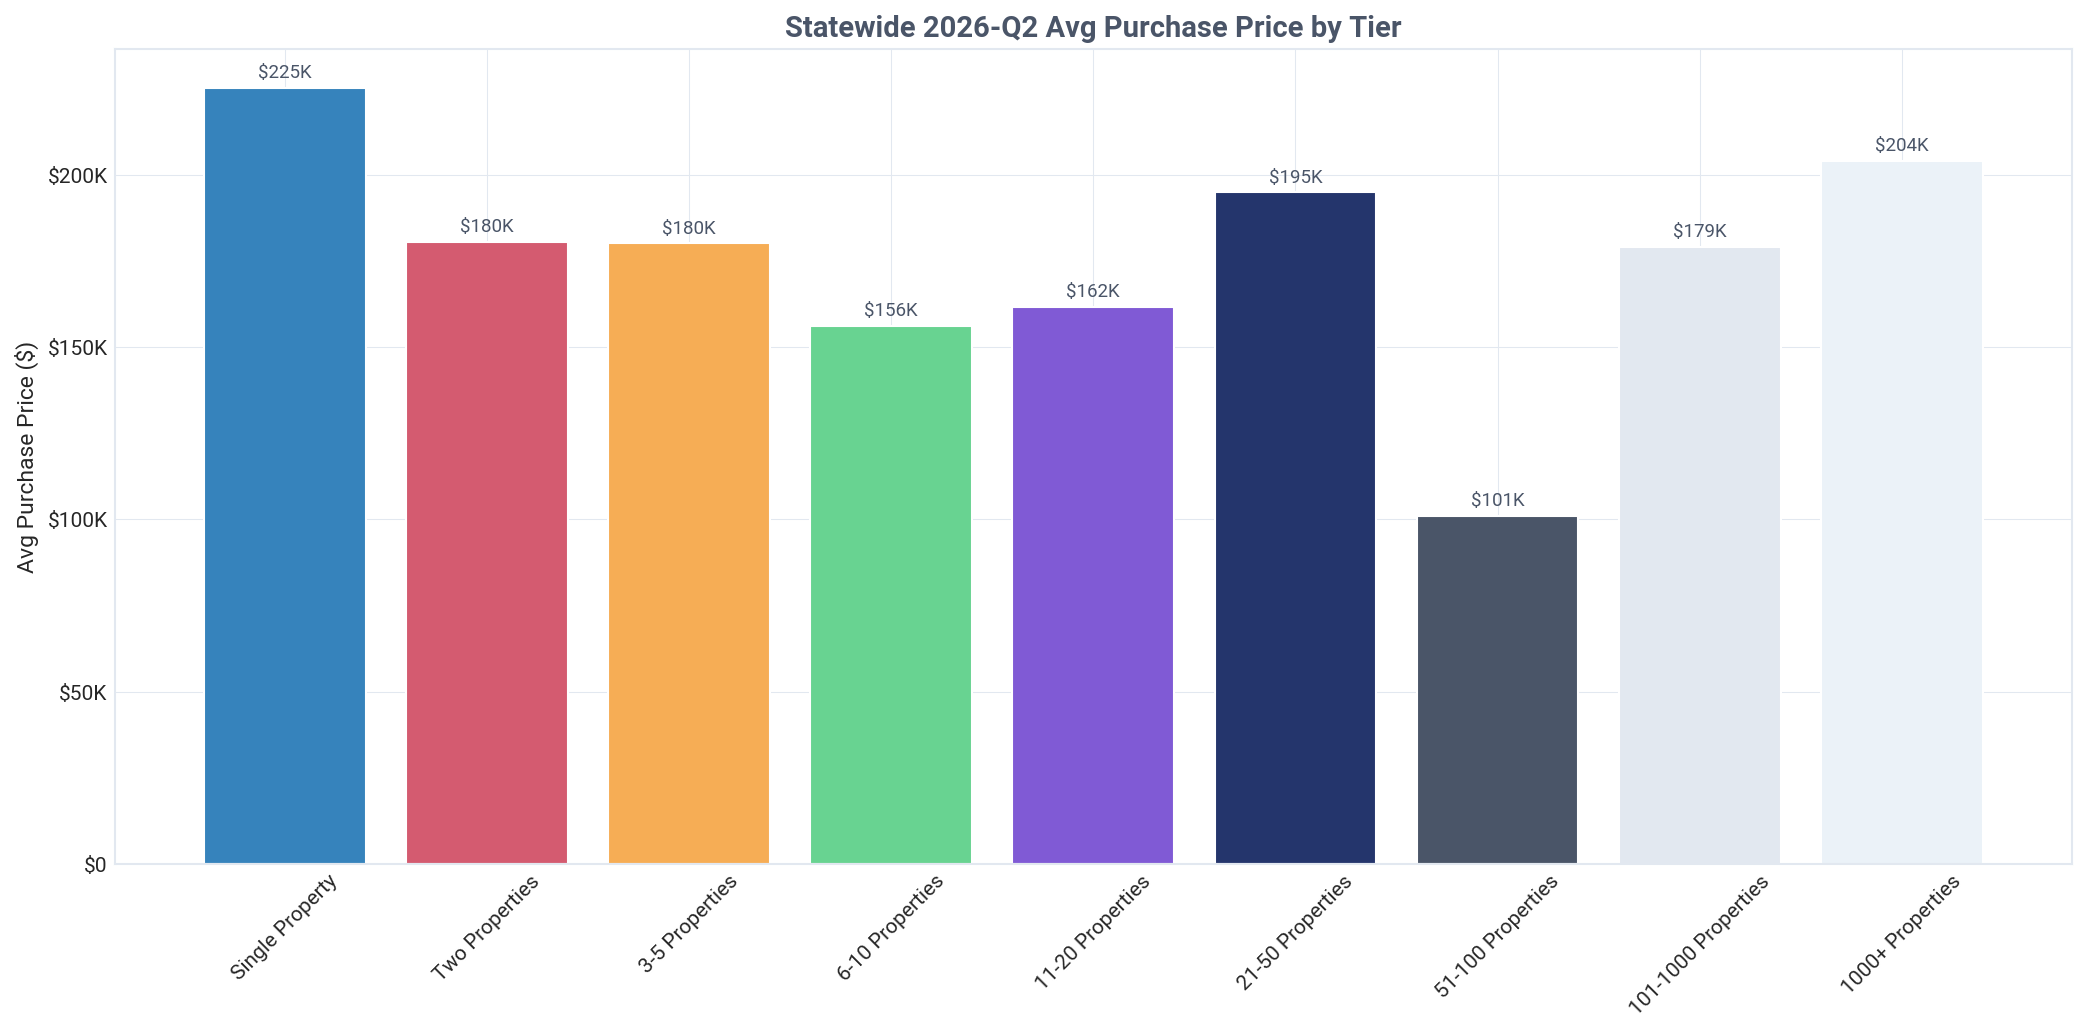
Single-property landlords are the largest group, controlling 58.8% of all investor-owned properties. When buying, institutional investors pay 9.4% less than these single-property landlords ($203,971 vs $225,213 in Q2 2026).
Ownership by Tier & Type
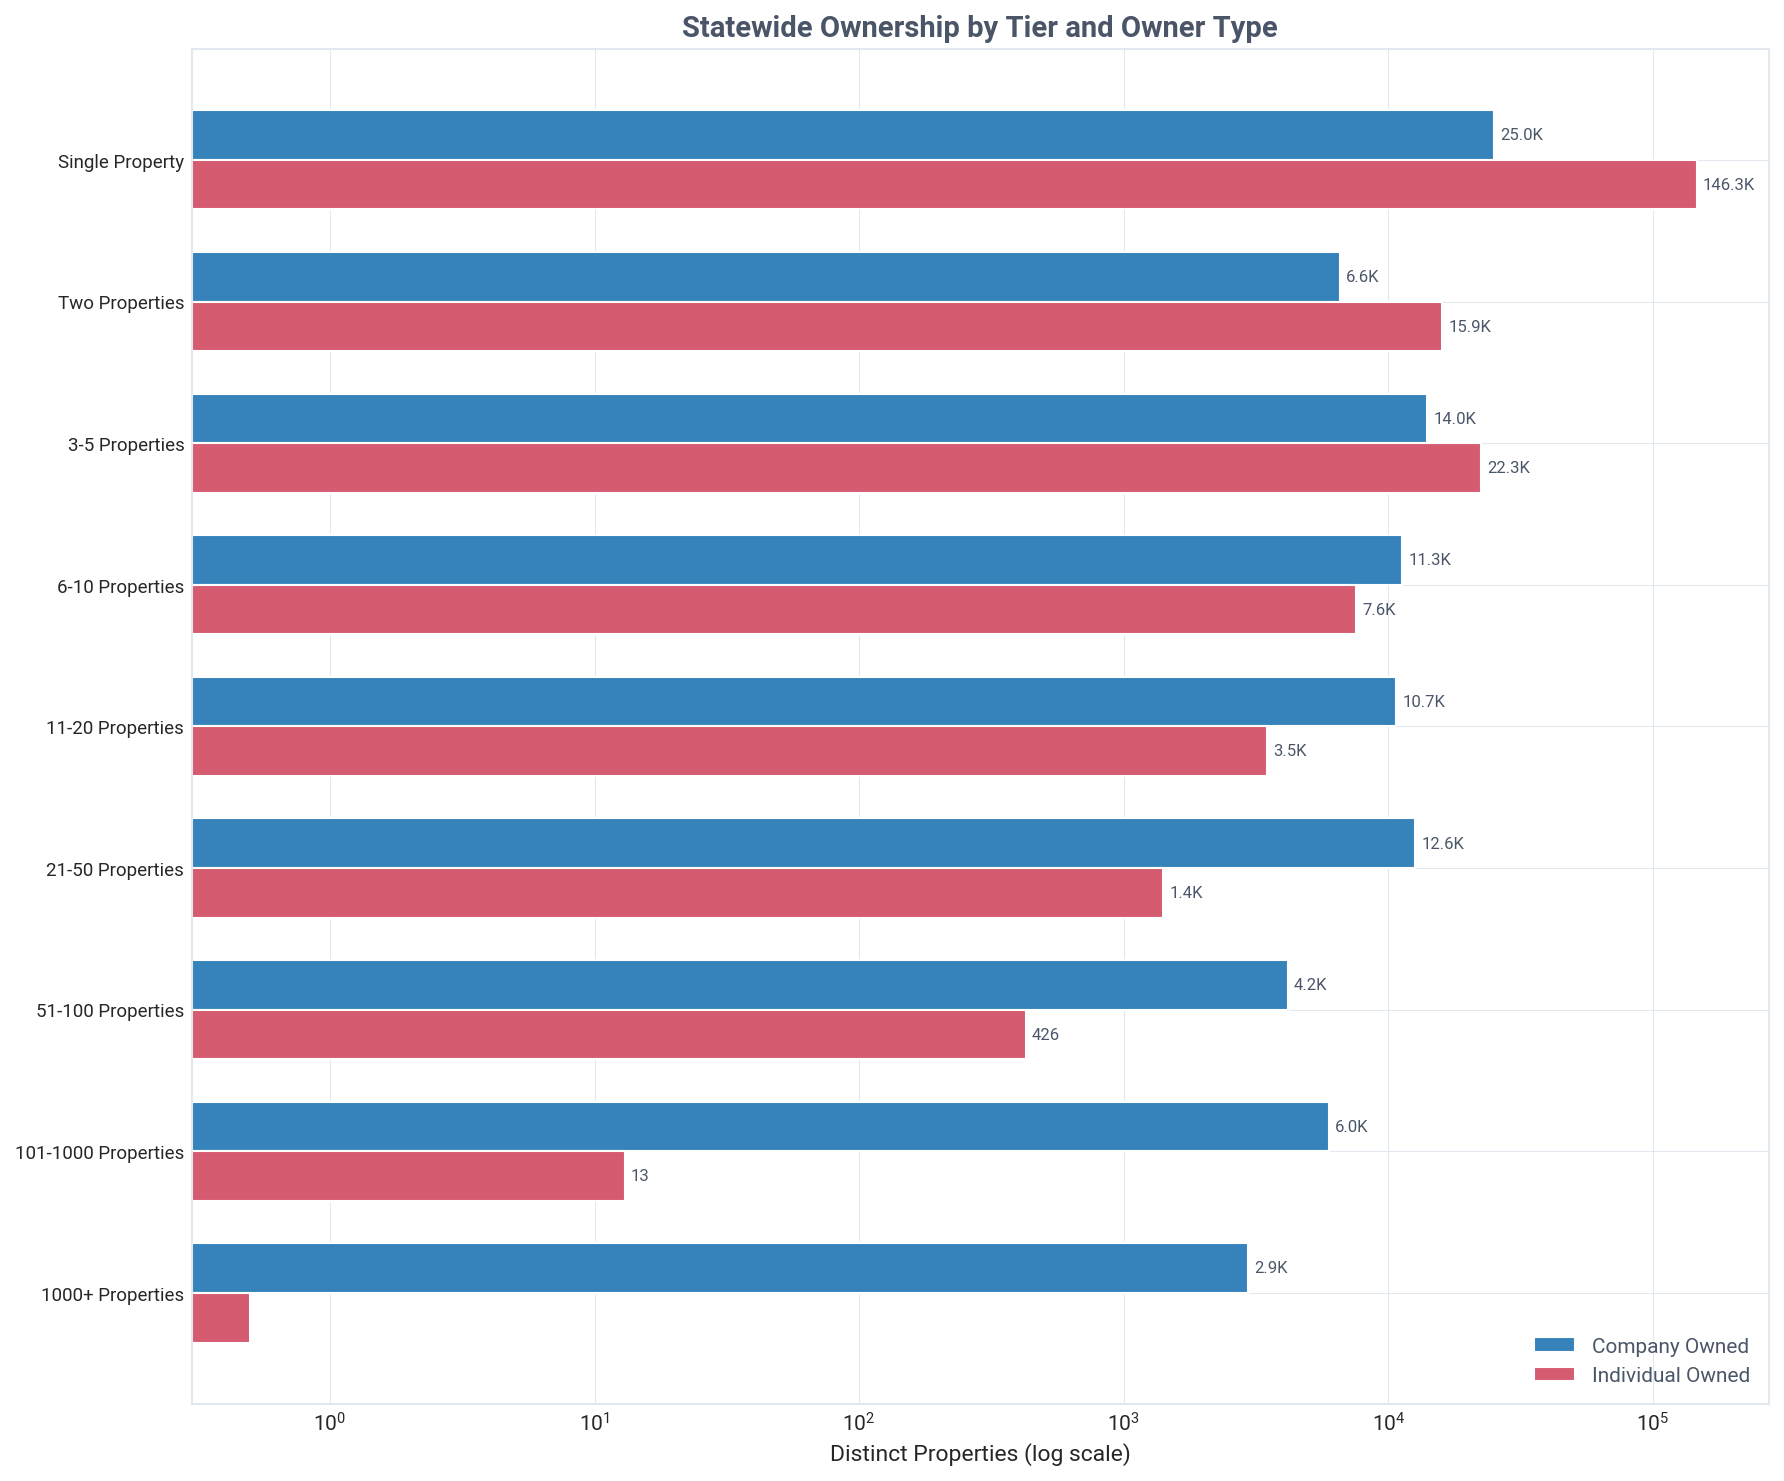
Companies become the majority property owners at the 6-10 property tier, signaling a key professionalization point.
Individuals dominate smaller portfolios, owning 85.4% of single-property holdings. In contrast, companies own 99.8% of large portfolios (101-1,000 properties), showing a clear shift as operations scale.
Geographic Distribution
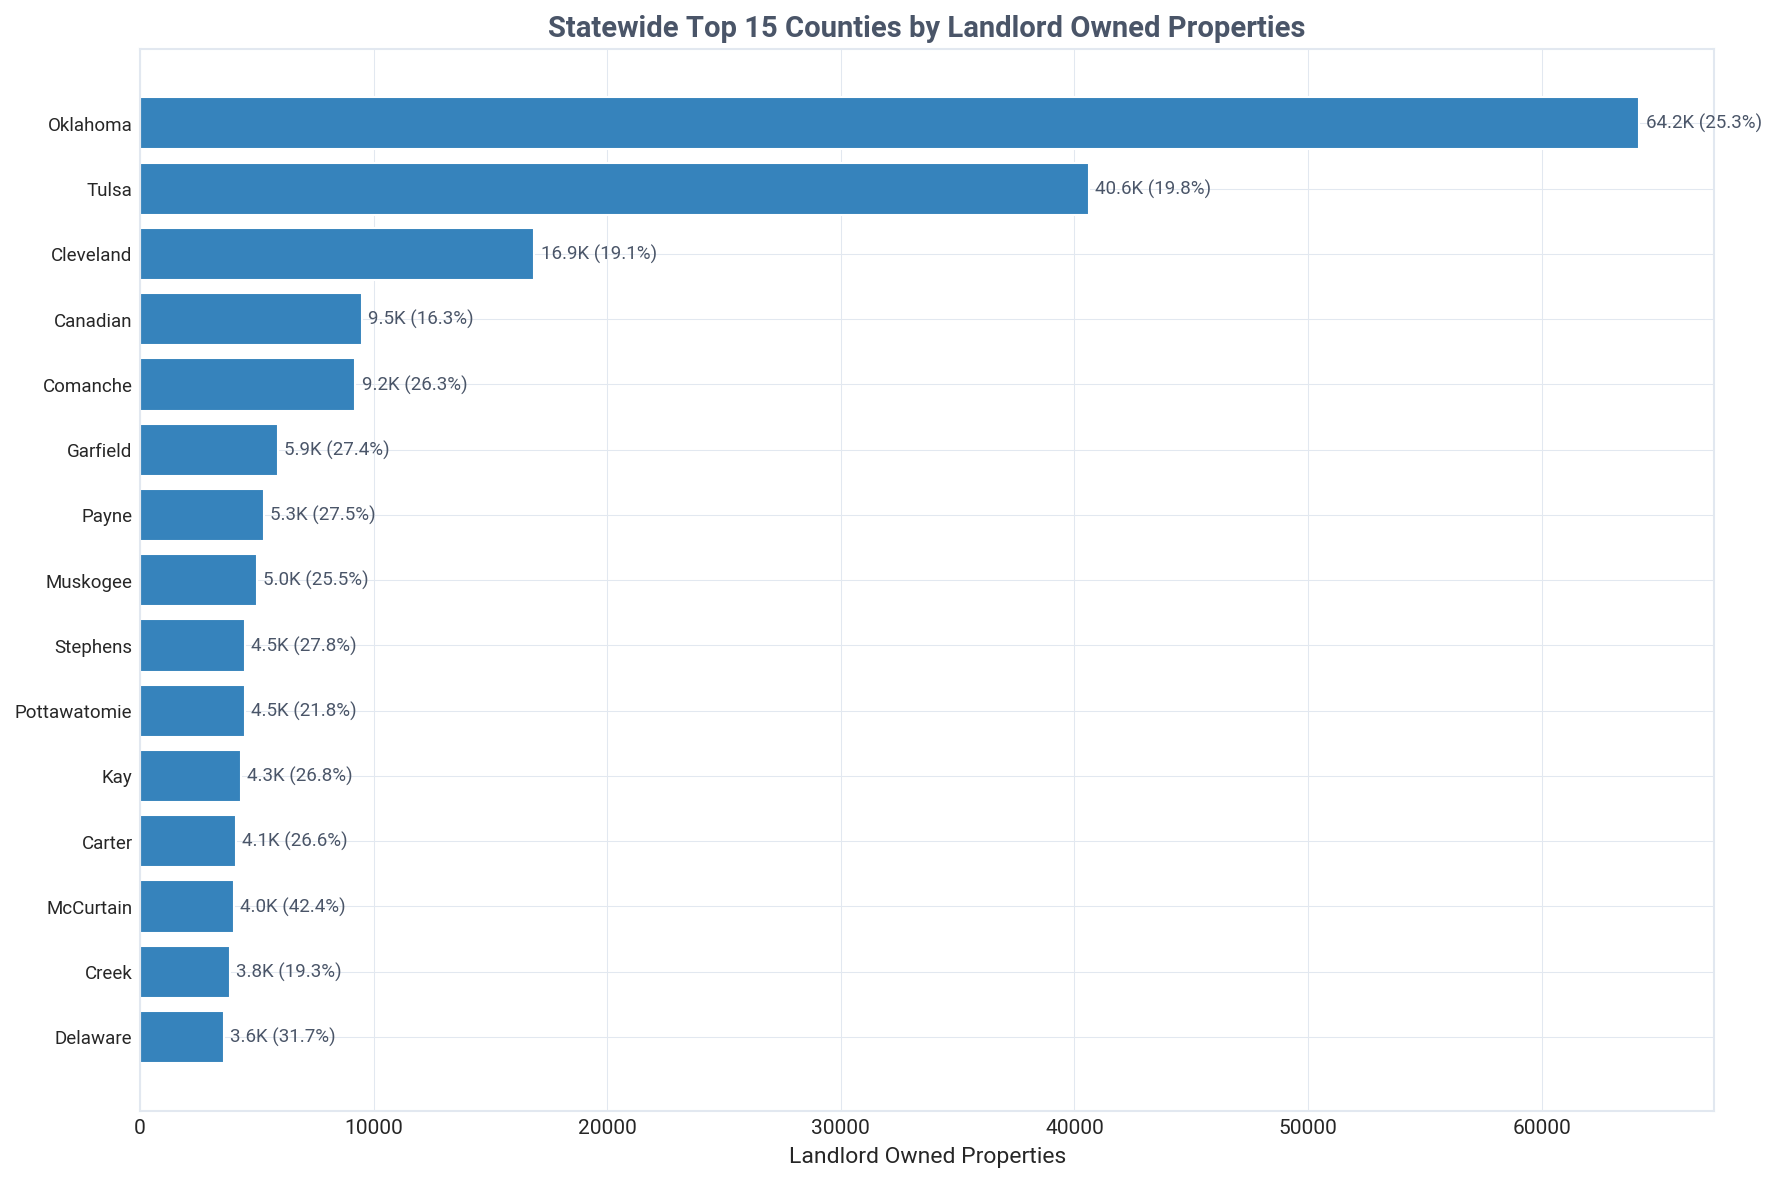
Investor activity is concentrated in Oklahoma and Tulsa counties, which together hold 38.0% of all investor-owned SFRs.
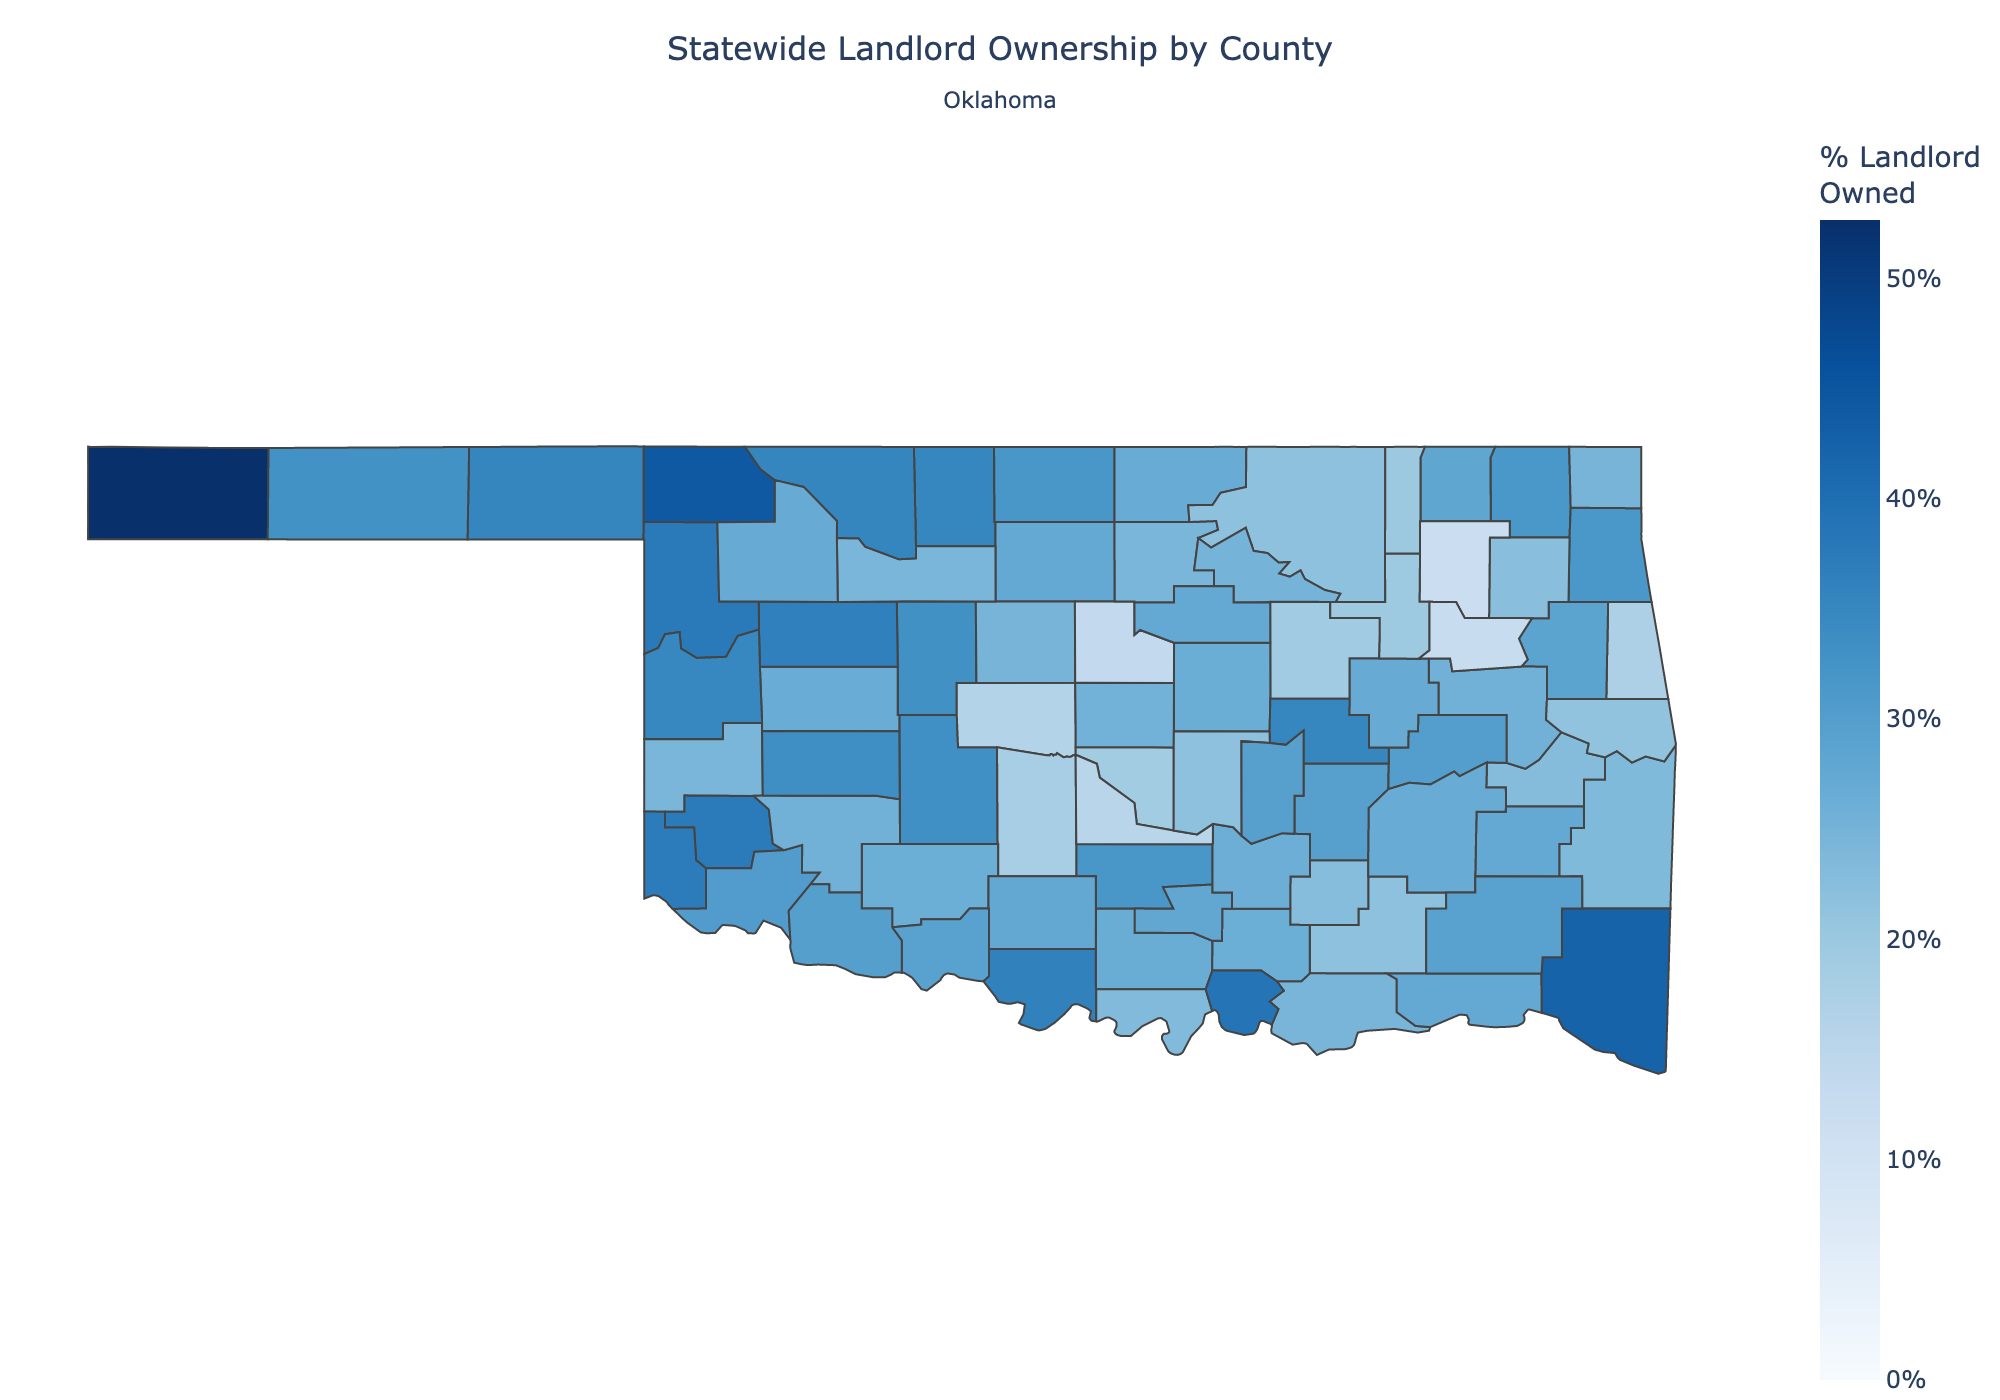
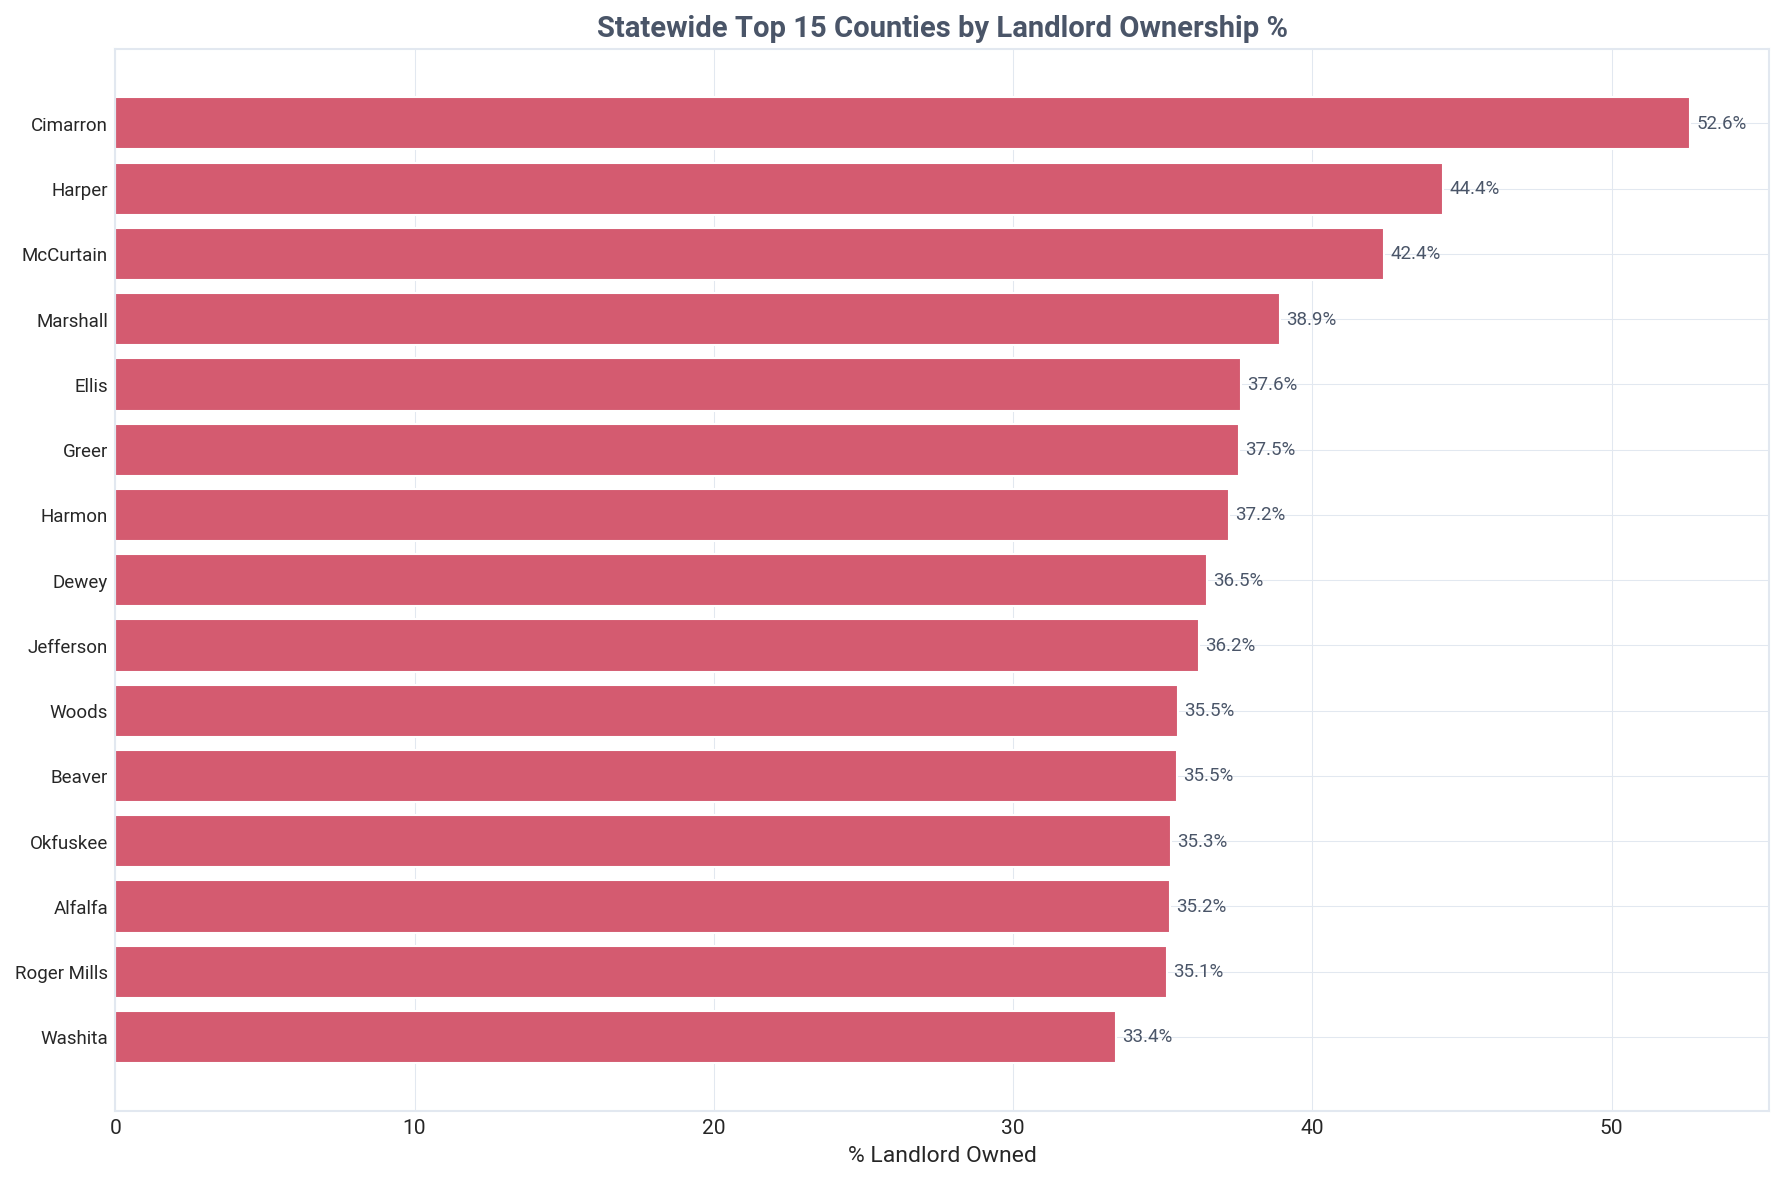
While urban centers lead by volume, rural counties show the highest penetration rates. Cimarron County has the highest investor ownership rate at 52.6%, followed by Harper County at 44.4%.
Historical Transactions
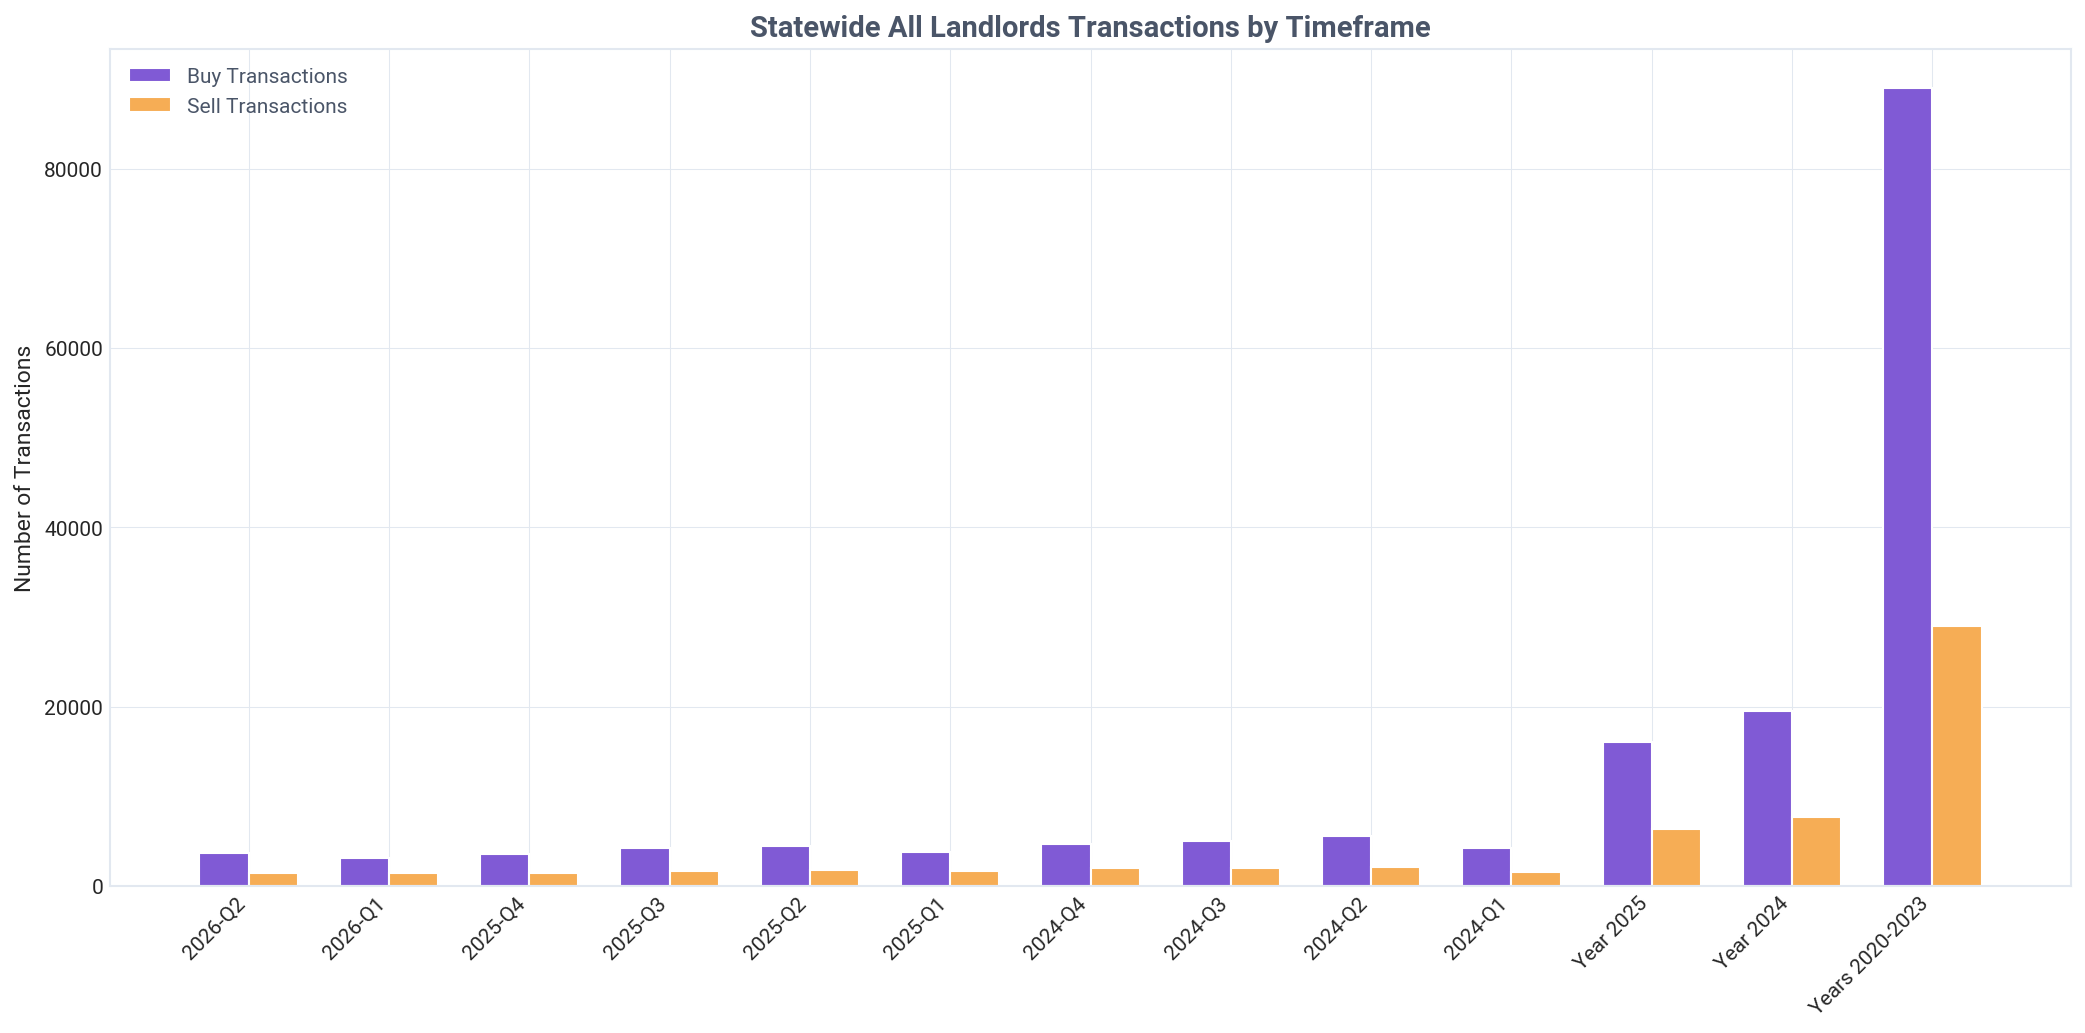
Oklahoma landlords are strong net buyers, acquiring 2.57 properties for every one sold in Q2 2026.
Institutional investors have shifted back to acquisition mode, becoming net buyers in Q2 2026 (+11 properties) after being net sellers for the full year of 2025 (-36 properties). The net buying trend for all landlords has been consistent over the past two years.
Current Quarter Transactions
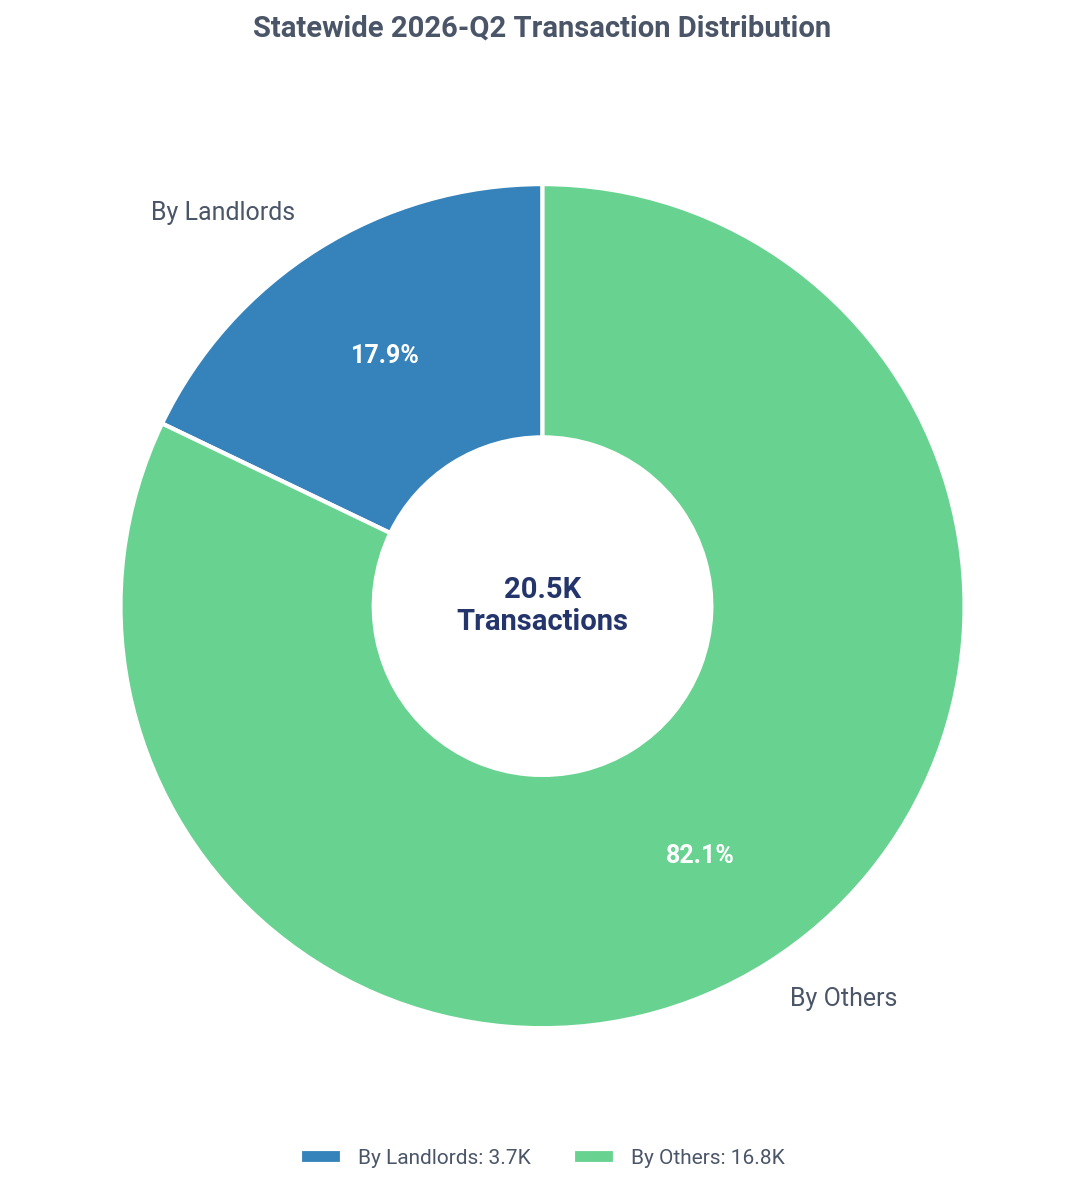
Landlords participated in 17.9% of all SFR transactions in Q2 2026, with single-property buyers paying the highest prices.
A clear price hierarchy exists: institutional investors paid 9.4% less per property than new single-property buyers ($203,971 vs $225,213). Mid-size investors (51-100 properties) were most likely to buy from other landlords, sourcing 37.1% of their deals from within the investor community.

Want deeper insights tailored to your investment strategy?

TALK TO AN EXPERT

Current Holdings Portfolio

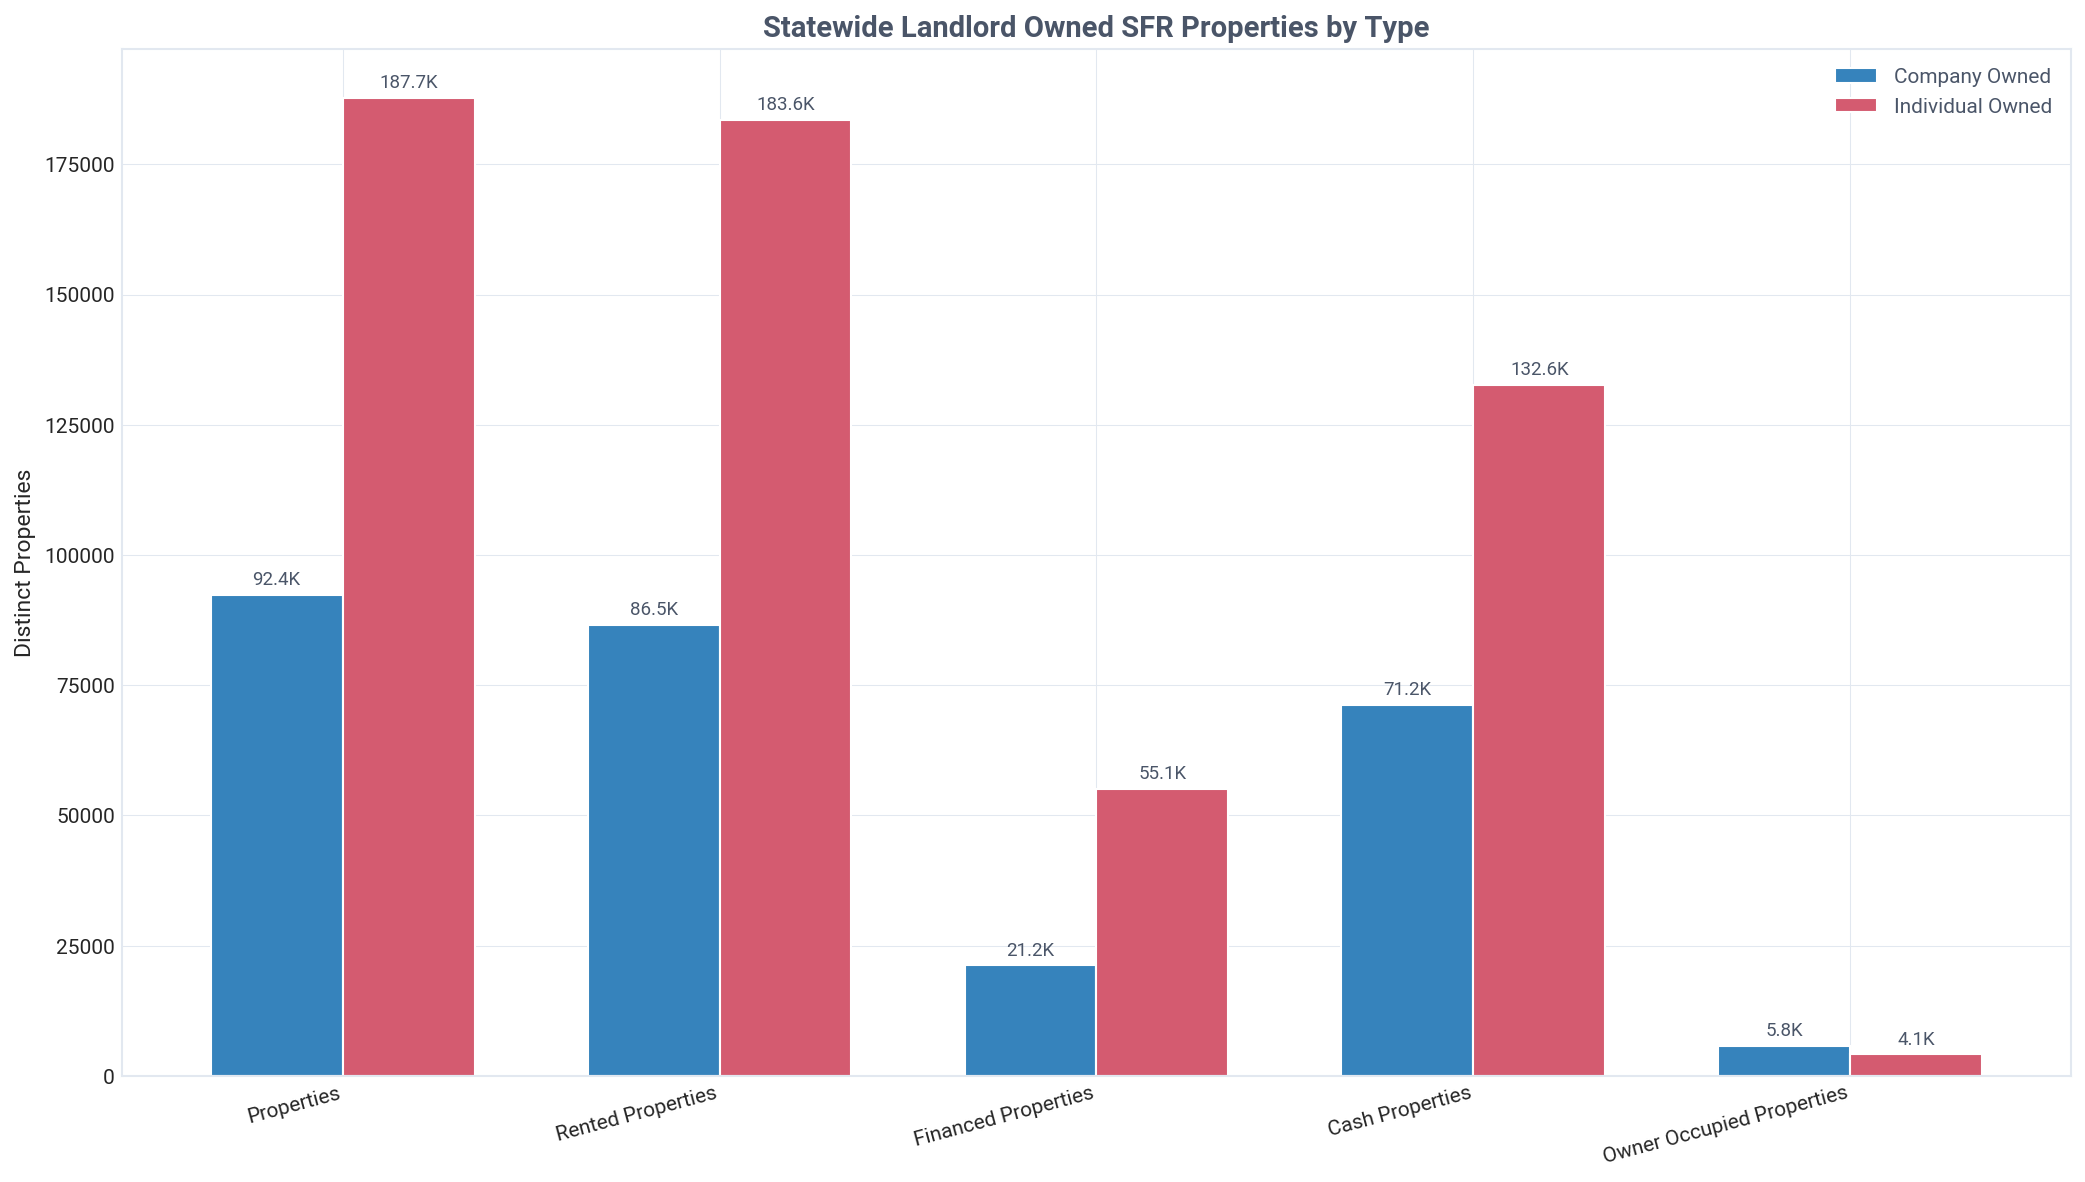
Analysis of landlord property holdings by type, financing method, and owner category

Oklahoma: landlord SFR holdings by type, Q2 2026
Key Insight
Investors own 275,483 SFR properties in Oklahoma, with individual investors holding 68.1% of the portfolio.
Detailed Findings

Investors hold a significant 23.1% share of Oklahoma's single-family residential market, totaling 275,483 properties. This highlights the critical role of real estate investing in the state's housing ecosystem. The ownership structure is heavily skewed towards individuals over corporations, challenging common narratives about market monopolization.

Individual investors are the backbone of the market, owning 187,734 properties, or 68.1% of the total investor portfolio. In contrast, companies own 92,389 properties (33.5%). This dynamic is even more pronounced when looking at entity counts, where 227,248 individual landlords represent 85.2% of all investors, compared to just 39,479 companies.

The financial strategy of Oklahoma investors leans heavily towards outright ownership. A striking 72.5% of the portfolio (199,761 properties) was acquired with cash, while only 27.5% (75,722 properties) is currently financed. This suggests a well-capitalized investor base that is less sensitive to interest rate fluctuations.

The portfolio's purpose is overwhelmingly geared towards providing rental housing. Of the total properties held by investors, 265,583 are rented, which equates to a 96.4% non-owner-occupied rate. This confirms that investor activity is directly supplying the vast majority of single-family rental units in the state.

The data clearly shows that the typical Oklahoma landlord is an individual, likely operating on a smaller scale, who owns their properties outright and contributes directly to the rental housing supply. This contrasts sharply with the image of a market dominated by large, debt-leveraged corporations.
Acquisition Timing & Pricing

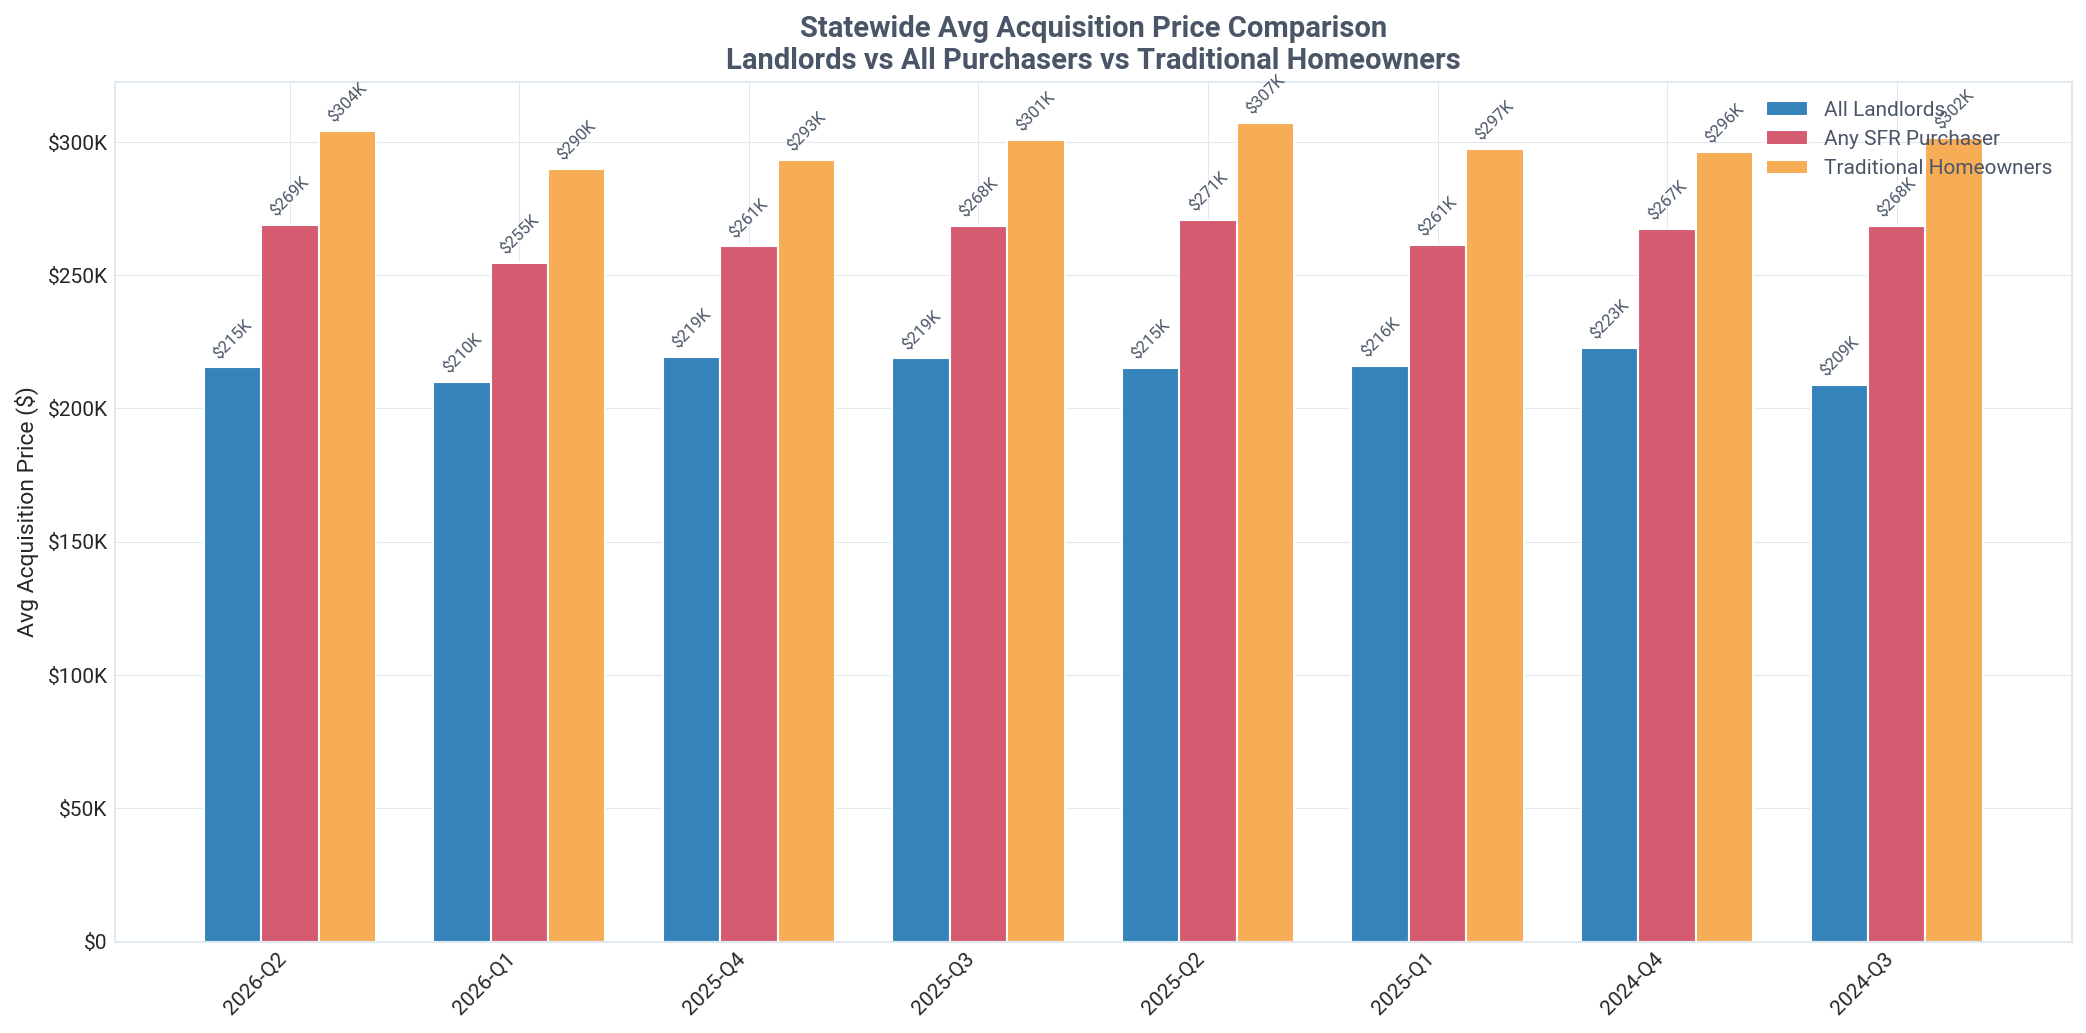
Comparison of acquisition prices between landlords and traditional homeowners

Key Insight
In Q2 2026, Oklahoma landlords paid 29.2% less than homeowners, a massive discount of $88,711 per property.
Detailed Findings

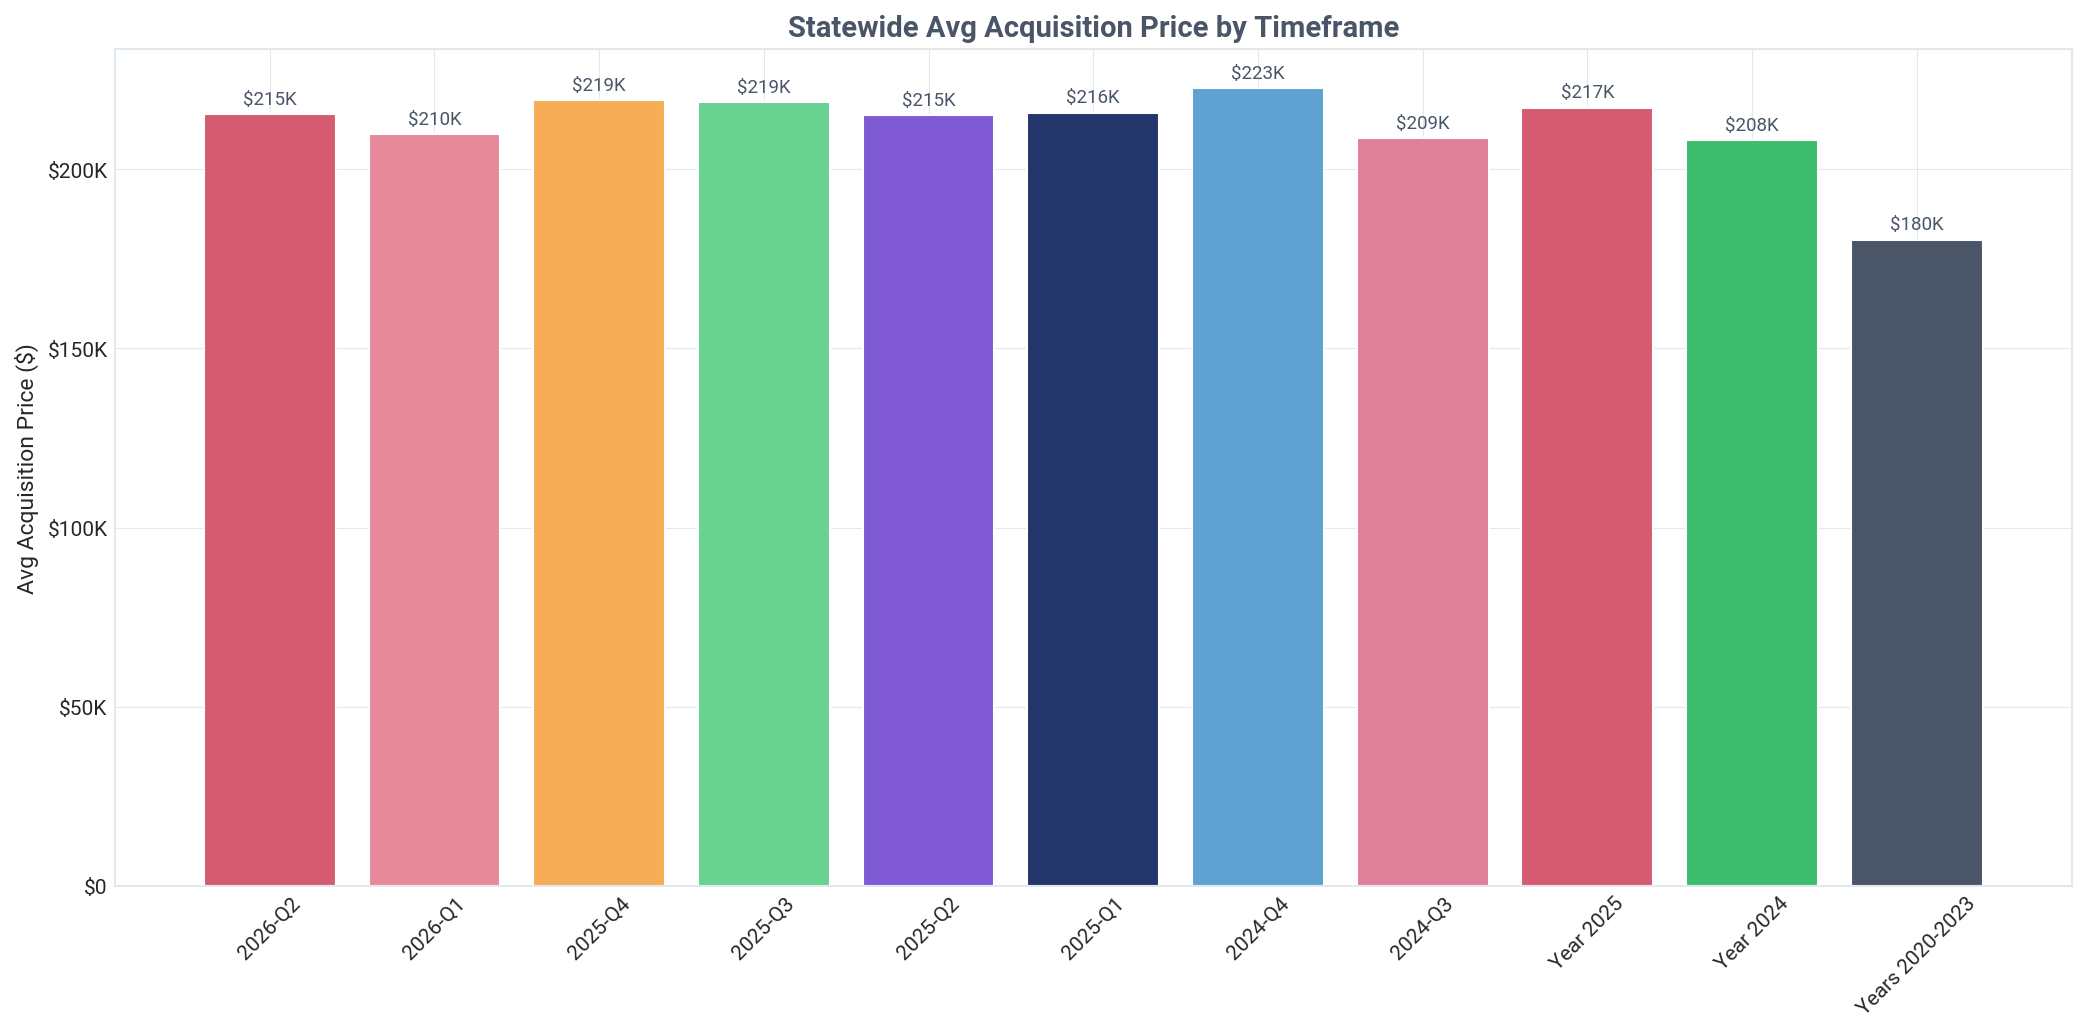
A dramatic pricing advantage defines investor acquisitions in Oklahoma. In Q2 2026, landlords purchased properties for an average of $215,407, a staggering $88,711 (or 29.2%) less than the $304,118 paid by traditional homeowners. This significant discount points to sophisticated deal-sourcing strategies, such as off-market purchases or targeting distressed assets.

The landlord discount is not only substantial but also growing. The 29.2% price gap in Q2 2026 represents a notable increase from the 27.6% gap in Q1 2026 and the 25.2% gap in Q4 2025. This widening trend suggests that as the market evolves, investors are becoming even more effective at securing properties below the typical retail price point.

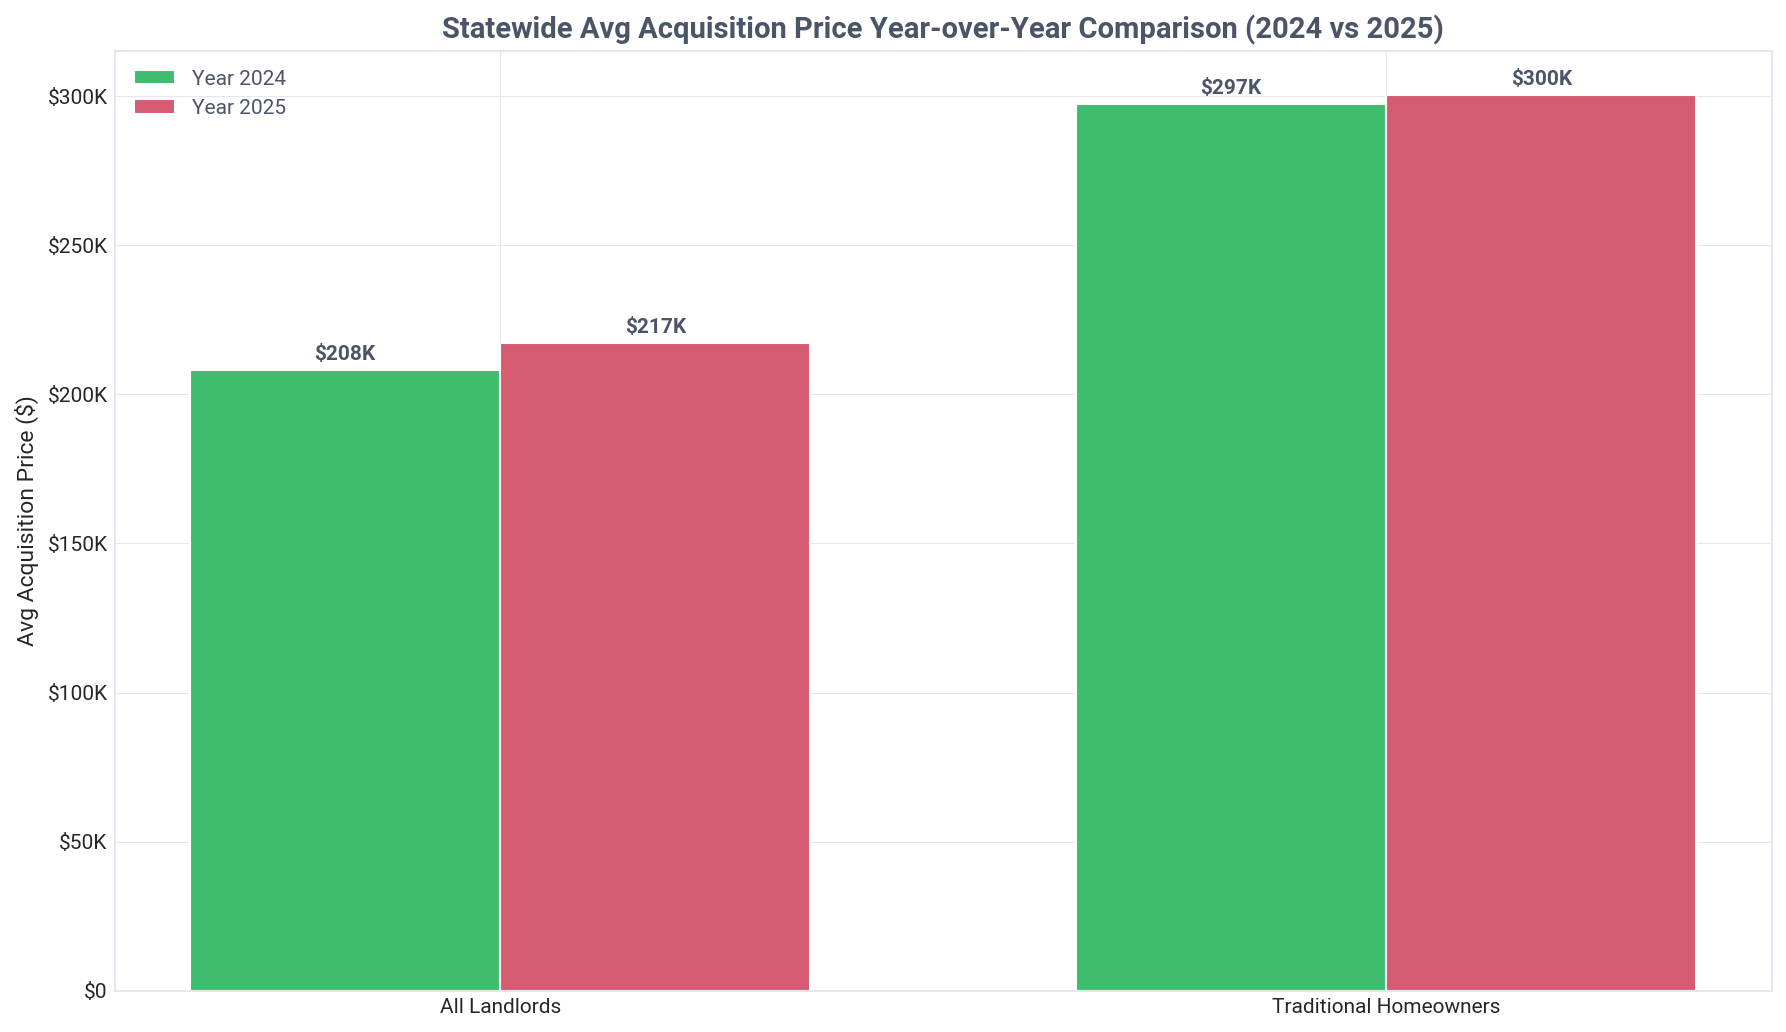
While paying less than homeowners, investors have still seen significant price appreciation on their acquisitions. The average purchase price of $215,407 in Q2 2026 is 19.4% higher than the average of $180,372 during the 2020-2023 boom period. This reflects broad market value increases, even for discounted properties, perhaps validated through an automated valuation (AVM).

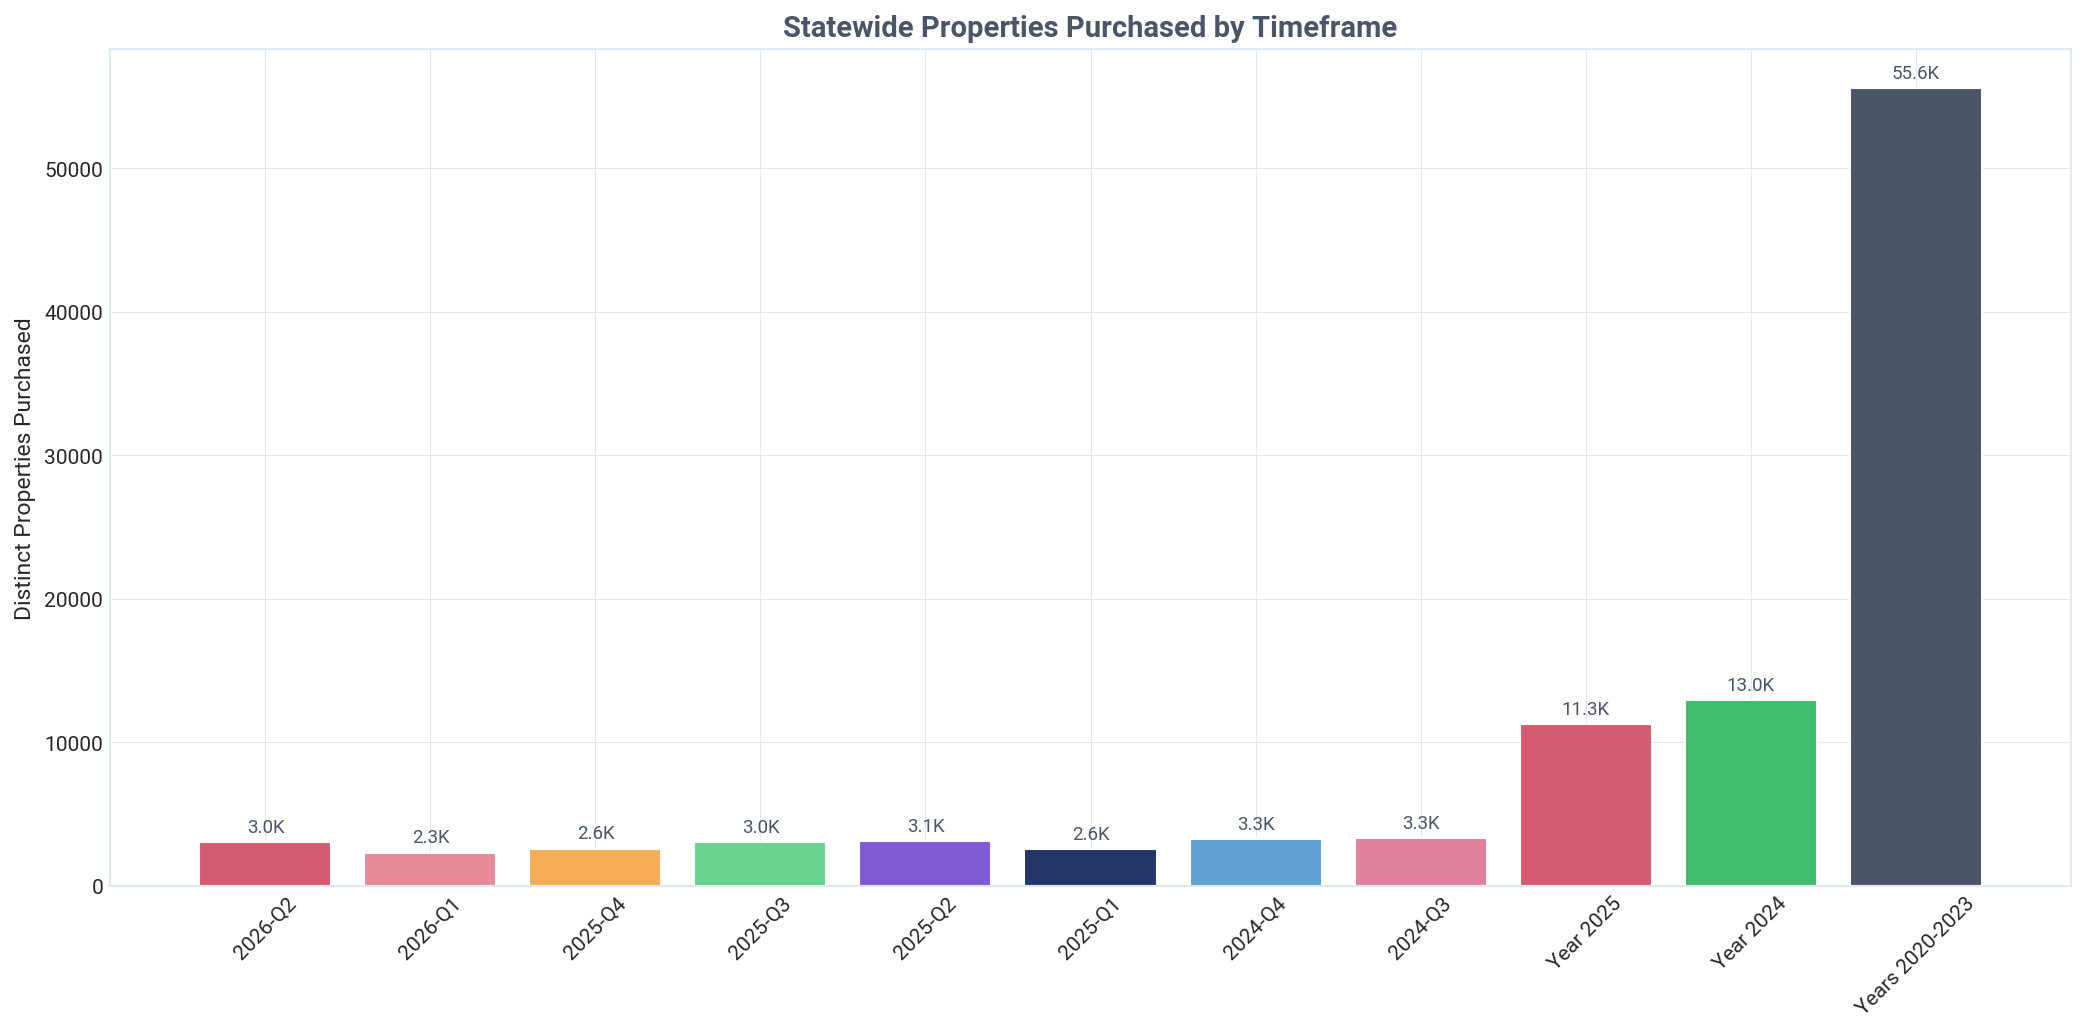
Acquisition volume remains robust, with landlords purchasing 3,021 properties in Q2 2026. This activity level is consistent with prior quarters, such as the 3,024 properties bought in Q3 2025, indicating steady and ongoing demand from investors.

Quarterly price trends show some fluctuation. While the Q2 2026 average price of $215,407 is an increase from Q1's $209,850, it remains below the recent peak of $219,223 seen in Q4 2025. This suggests that while the overall trend is upward, investors remain disciplined and are not chasing prices indiscriminately.

Oklahoma: properties purchased by timeframe, Q2 2026
Oklahoma: average acquisition price by timeframe, Q2 2026
Oklahoma: average acquisition price by buyer type, Q2 2026
Oklahoma: average acquisition price year over year, Q2 2026

Current Quarter Purchase Summary

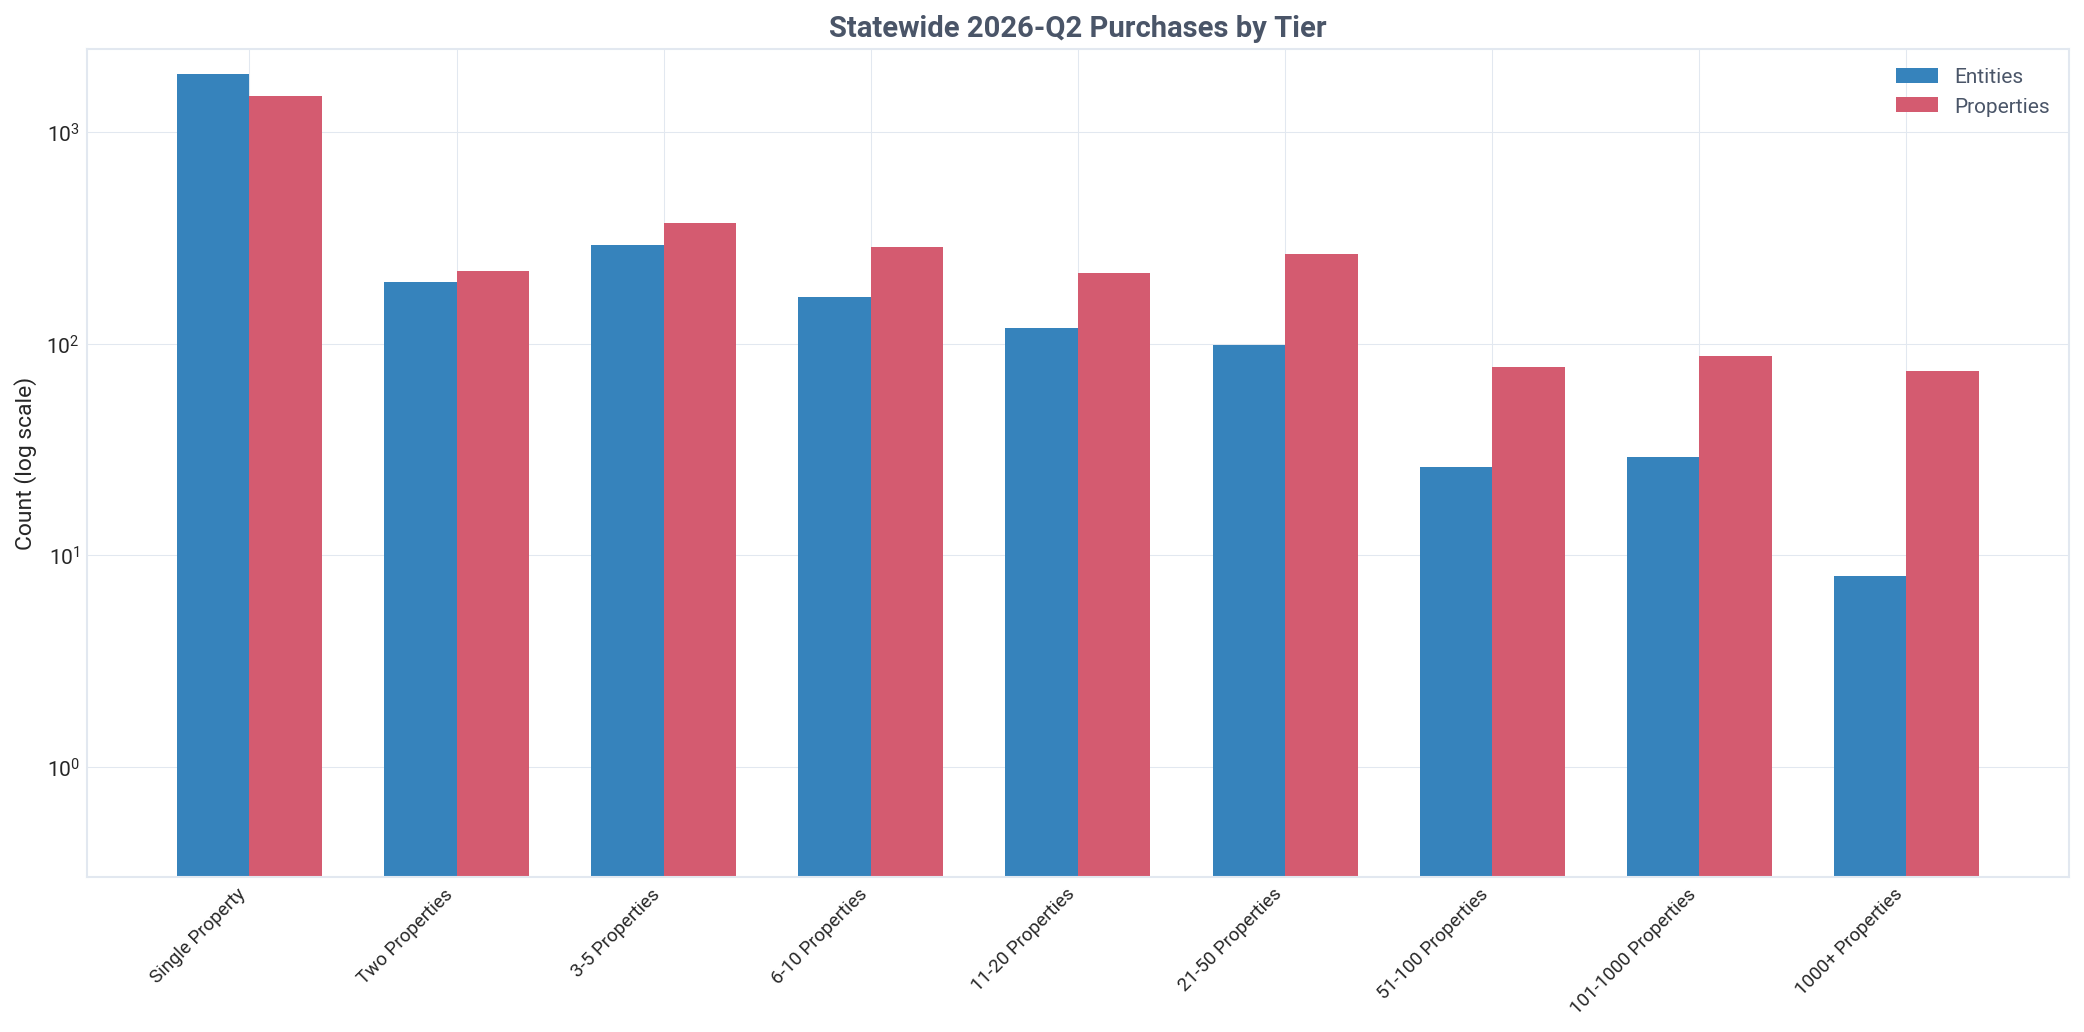
Analysis of Q2 2026 purchase activity by investor tier and type

Oklahoma: purchases by tier, Q2 2026
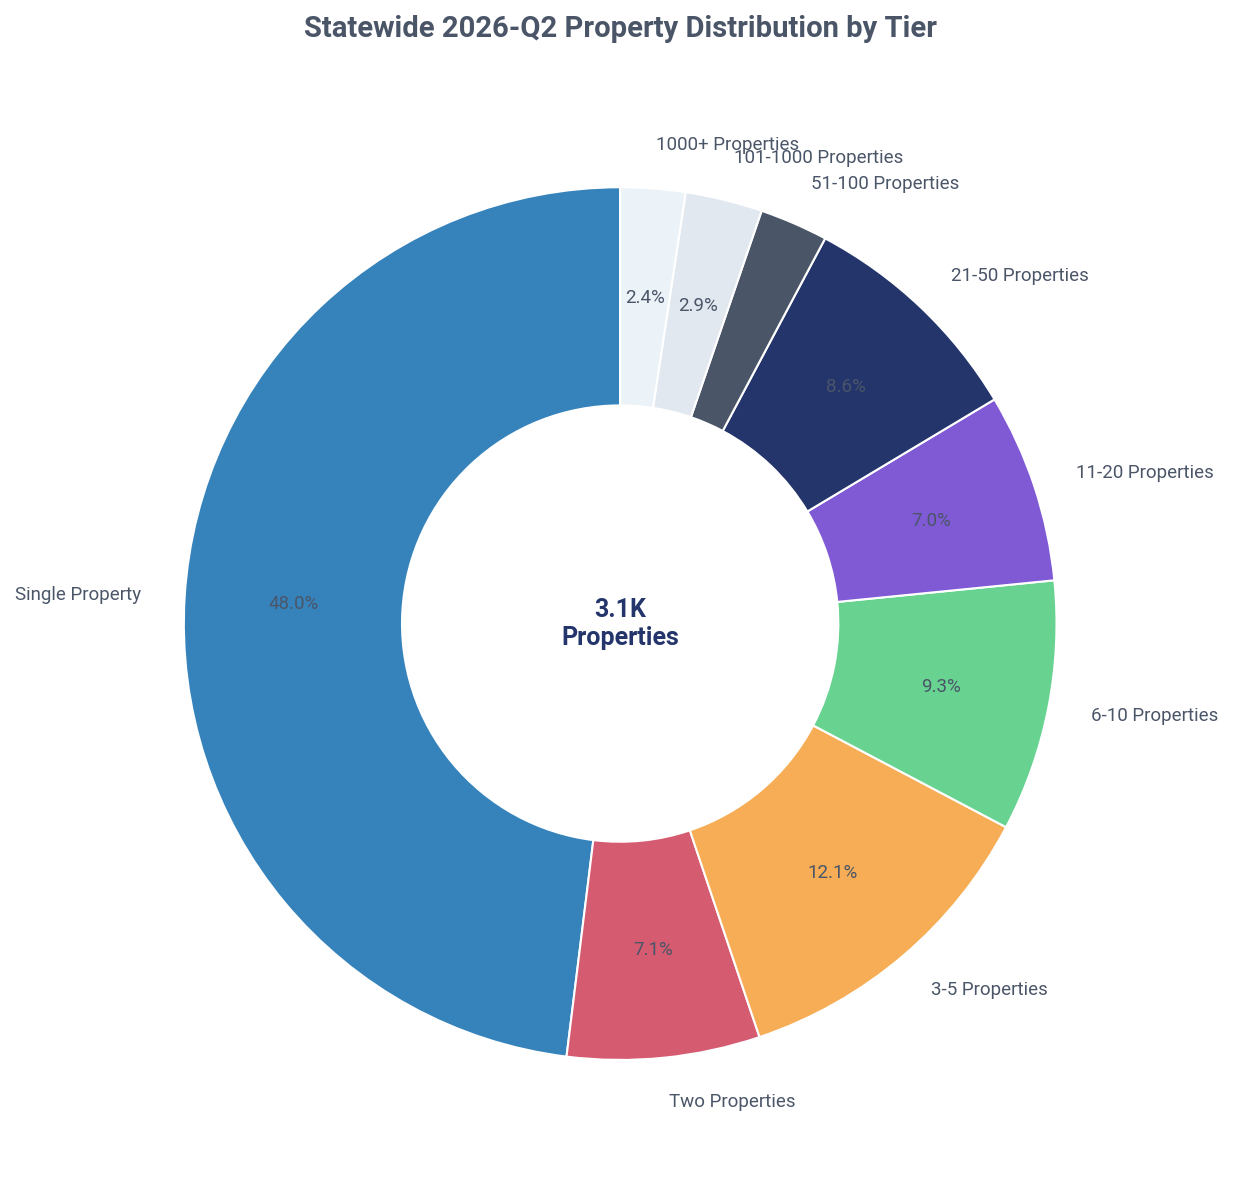
Oklahoma: purchased property share by tier, Q2 2026
Key Insight
Landlords acquired 20.2% of all single-family homes sold in Oklahoma during Q2 2026, totaling 3,021 properties.
Detailed Findings

Investors were a major force in the Oklahoma housing market in Q2 2026, purchasing 3,021 of the 14,944 single-family homes sold, capturing a 20.2% market share. This level of activity underscores their significant role in market liquidity and price setting.

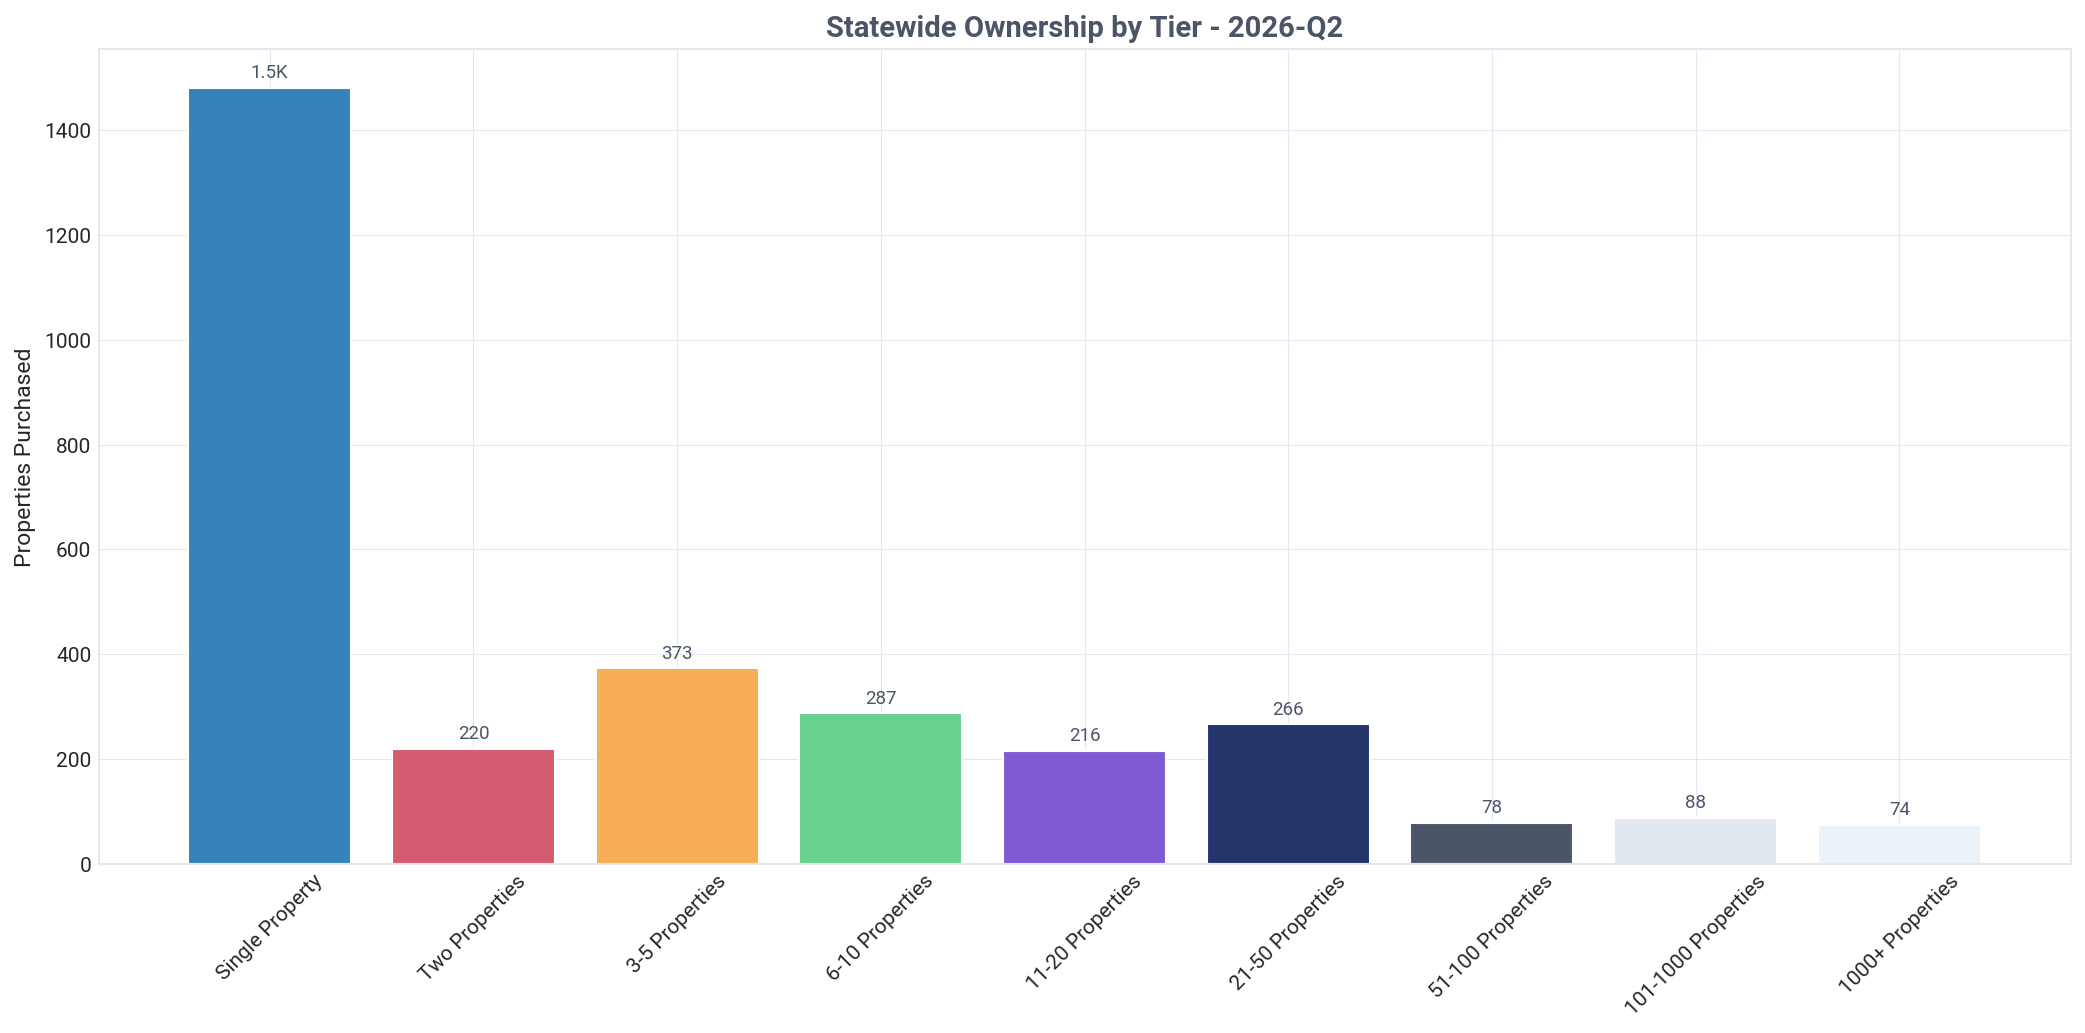
The acquisition landscape is dominated by small-scale investors. Mom-and-pop landlords (owning 1-10 properties) were responsible for 78.2% of all investor purchases (2,361 properties). This activity was led by the smallest investors, with those buying their first property accounting for 1,481 of these acquisitions.

A significant influx of new participants is entering the market. In Q2 2026 alone, 1,889 new landlord entities made their first purchase, signaling strong grassroots interest in real estate investment. These new entrants were the single most active group, responsible for 48.0% of all properties bought by investors using a property search.

In stark contrast, institutional-level activity was minimal. Investors in the 1,000+ property tier purchased only 74 properties, representing just 2.4% of the total investor buying volume. This data refutes the idea that large corporations are the primary drivers of acquisitions in Oklahoma's market.

The data paints a clear picture of a market driven from the bottom up. The energy, capital, and transaction volume are overwhelmingly concentrated in the hands of new and small-scale landlords, while large institutions play a relatively minor role in new acquisitions.

Ownership by Purchase Tier

Distribution of investor-owned properties across portfolio size tiers

Key Insight
Mom-and-pop landlords own a commanding 85.5% of Oklahoma's investor-held SFR housing, while institutions own just 1.0%.
Detailed Findings

The structure of rental property ownership in Oklahoma is definitively decentralized. Mom-and-pop investors, defined as those owning 1-10 properties, control a massive 85.5% of the entire investor-owned SFR portfolio. This widespread ownership pattern suggests a highly fragmented and competitive market rather than a consolidated one.

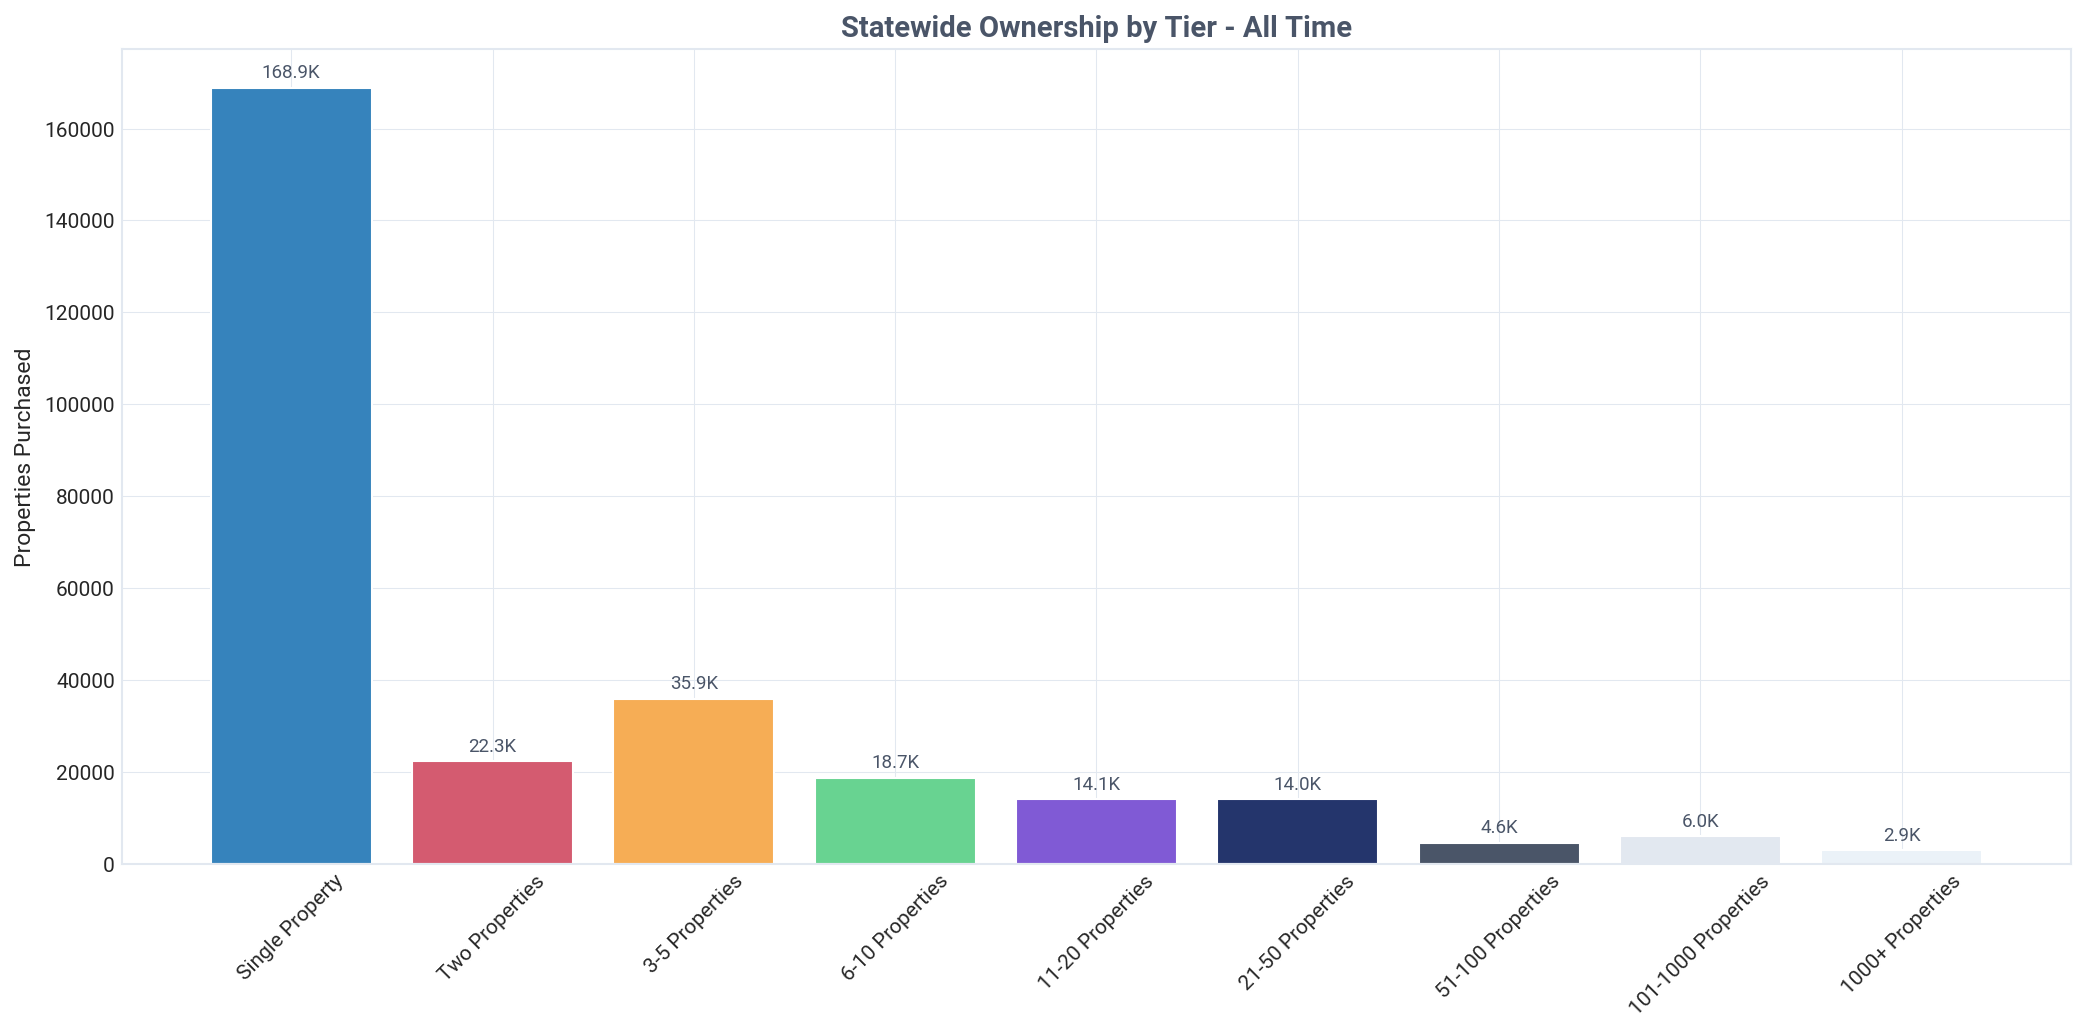
At the most granular level, single-property landlords form the bedrock of the market. This group alone owns 168,872 properties, which accounts for 58.8% of all investor-held housing. The sheer scale of this tier highlights the importance of small, individual investors in providing rental options across the state.

Institutional ownership is almost negligible in comparison. Investors in the 1,000+ property tier hold just 2,939 homes, representing a mere 1.0% of the market. This finding directly counters the public perception of Wall Street dominance in the single-family rental space, a topic often explored in property ownership by owner type reports.

Larger investors demonstrate greater purchasing power. In Q2 2026, institutional buyers paid an average of $203,971 per property. This is 9.4% less than the $225,213 average price paid by first-time, single-property buyers, indicating that scale and experience translate into significant cost savings on acquisitions.

The ownership distribution is heavily weighted towards the smaller end of the spectrum. The top four tiers (1-10 properties) comprise 85.5% of holdings, while the bottom five tiers (11+ properties) collectively own the remaining 14.5%. This underscores that the vast majority of rental housing is provided by local, small-scale operators.

Oklahoma: current ownership by purchase tier, Q2 2026
Oklahoma: properties purchased by tier, all time, Q2 2026
Oklahoma: properties purchased by tier this quarter, Q2 2026
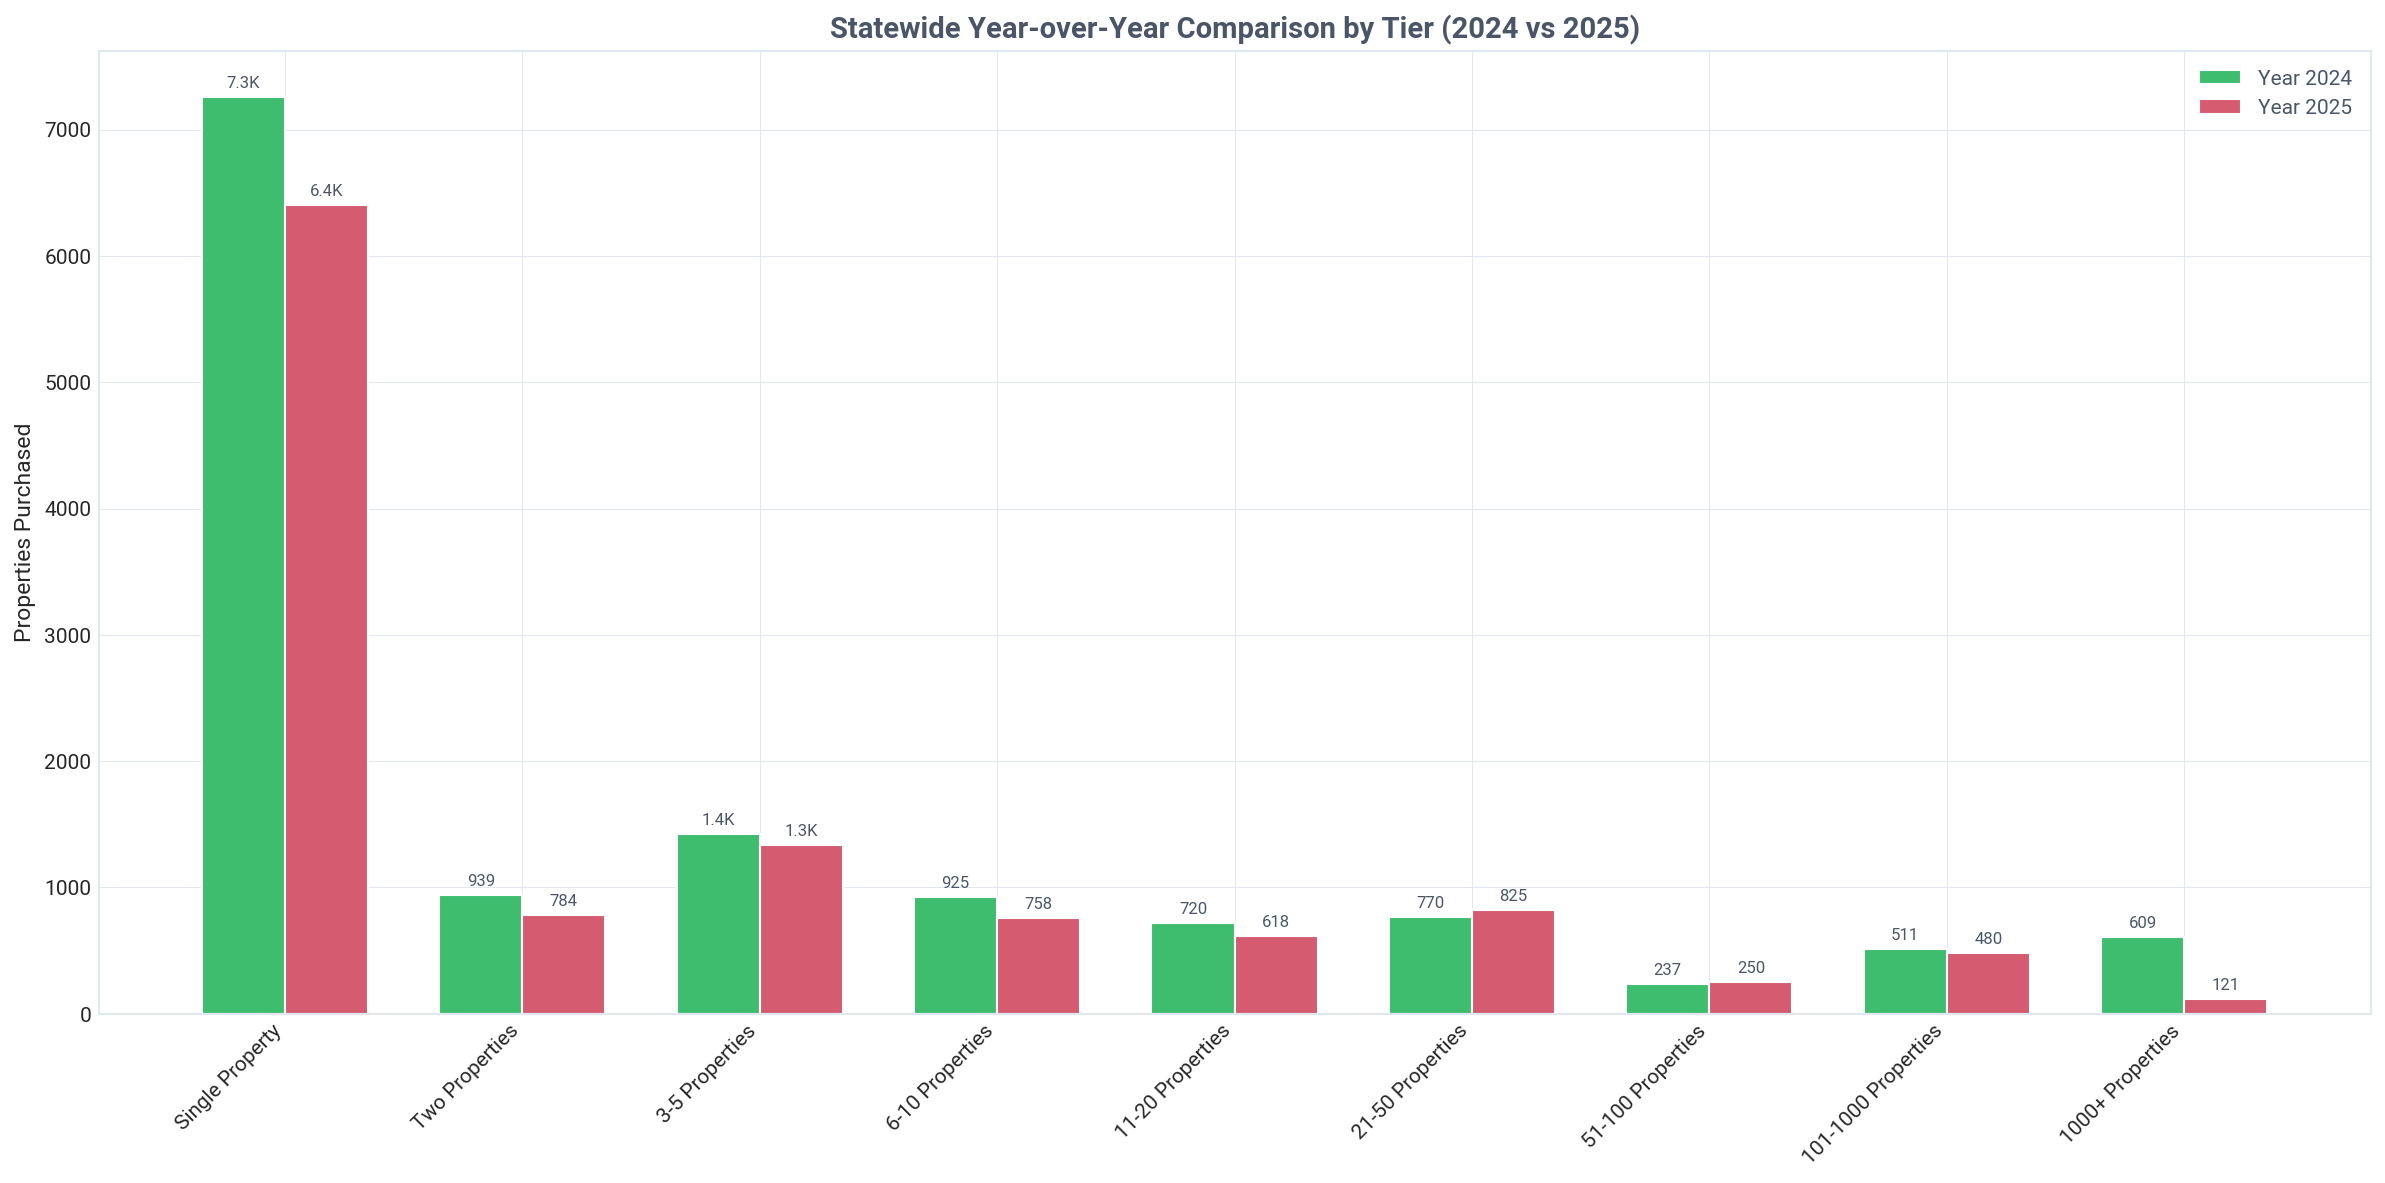
Oklahoma: properties purchased by tier year over year, Q2 2026

Need custom portfolio analysis based on these tier insights?

TALK TO AN EXPERT

Ownership by Tier & Owner Type

Breakdown of individual vs corporate ownership across portfolio tiers

Oklahoma: ownership by tier and owner type, Q2 2026
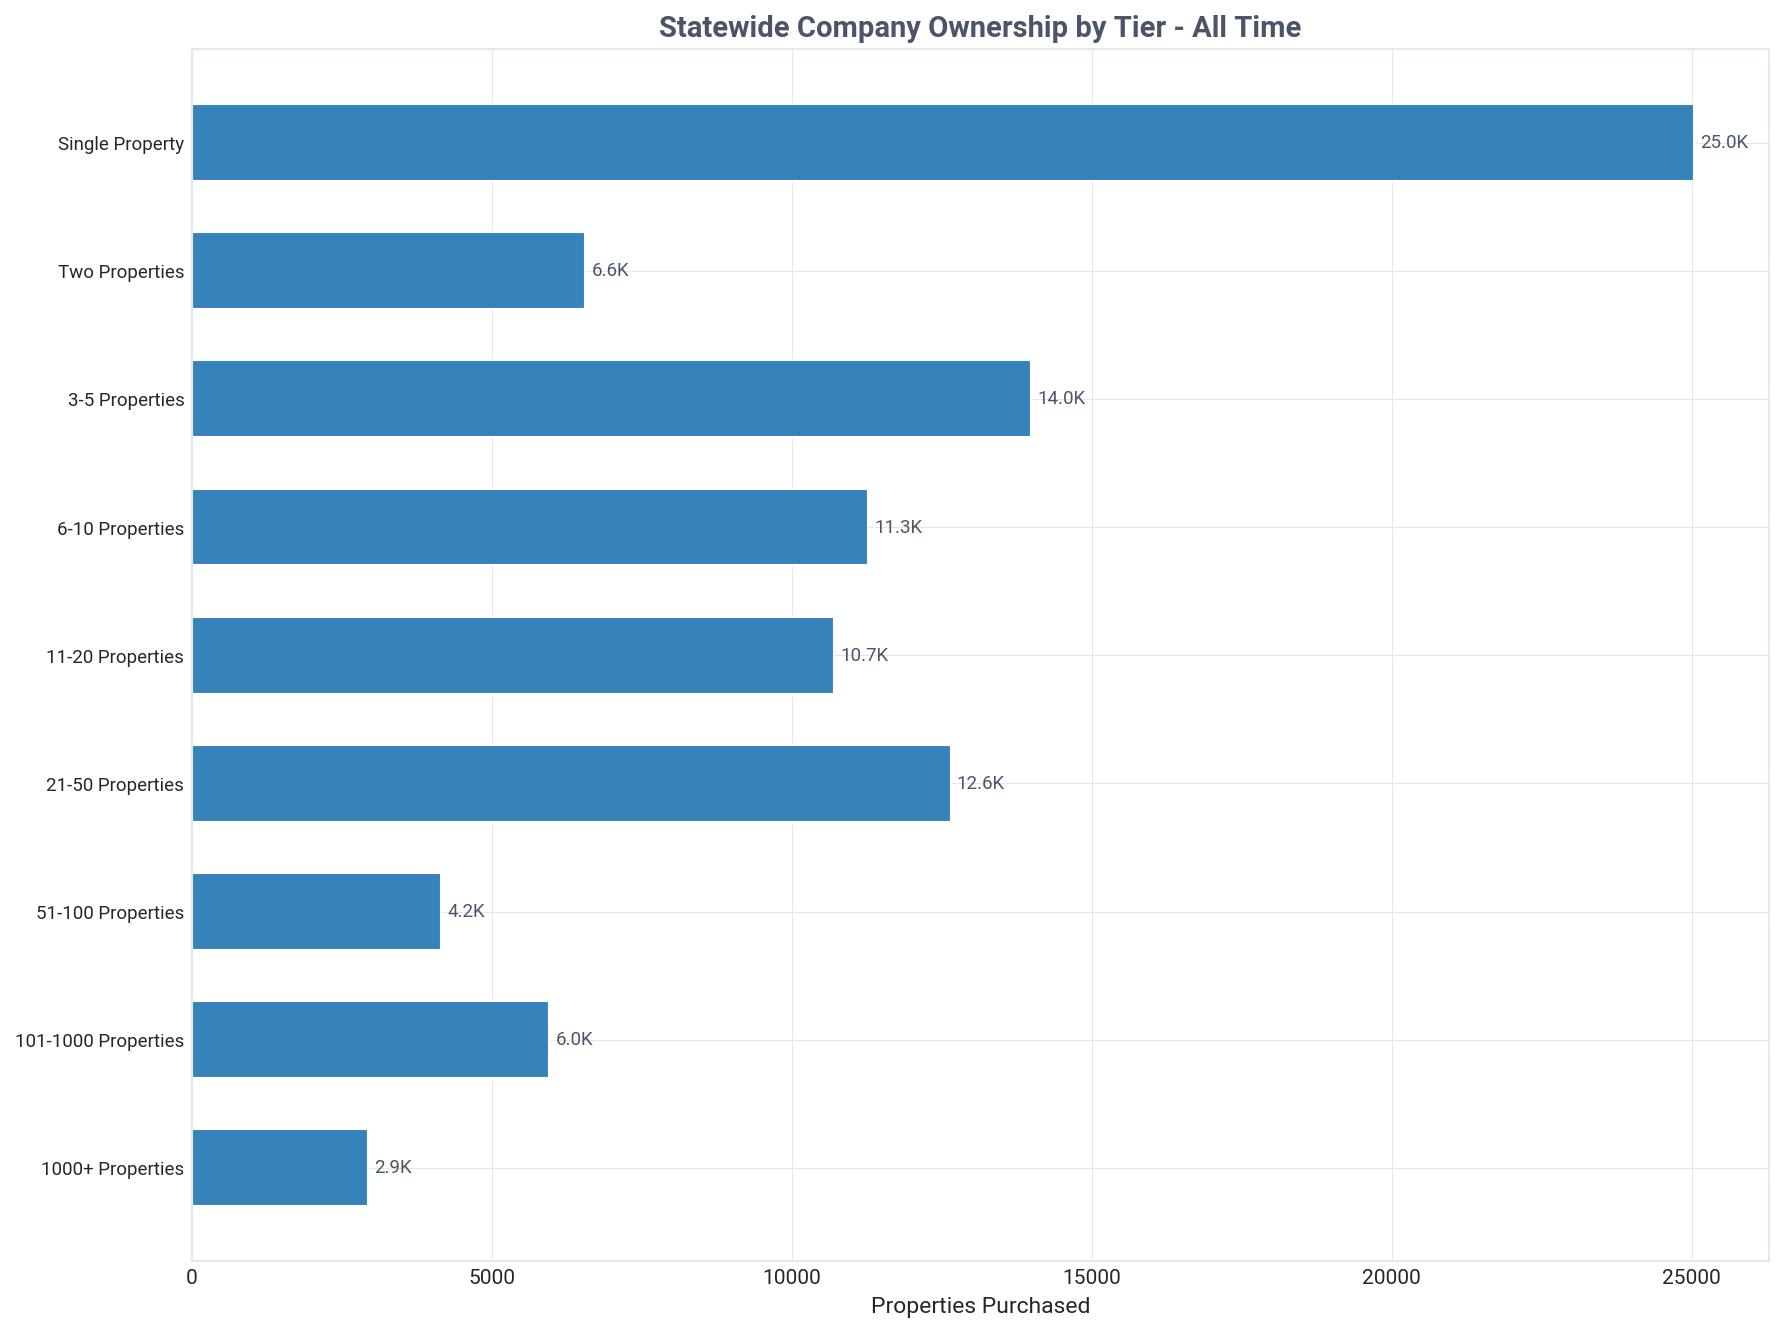
Oklahoma: company purchases by tier, all time, Q2 2026
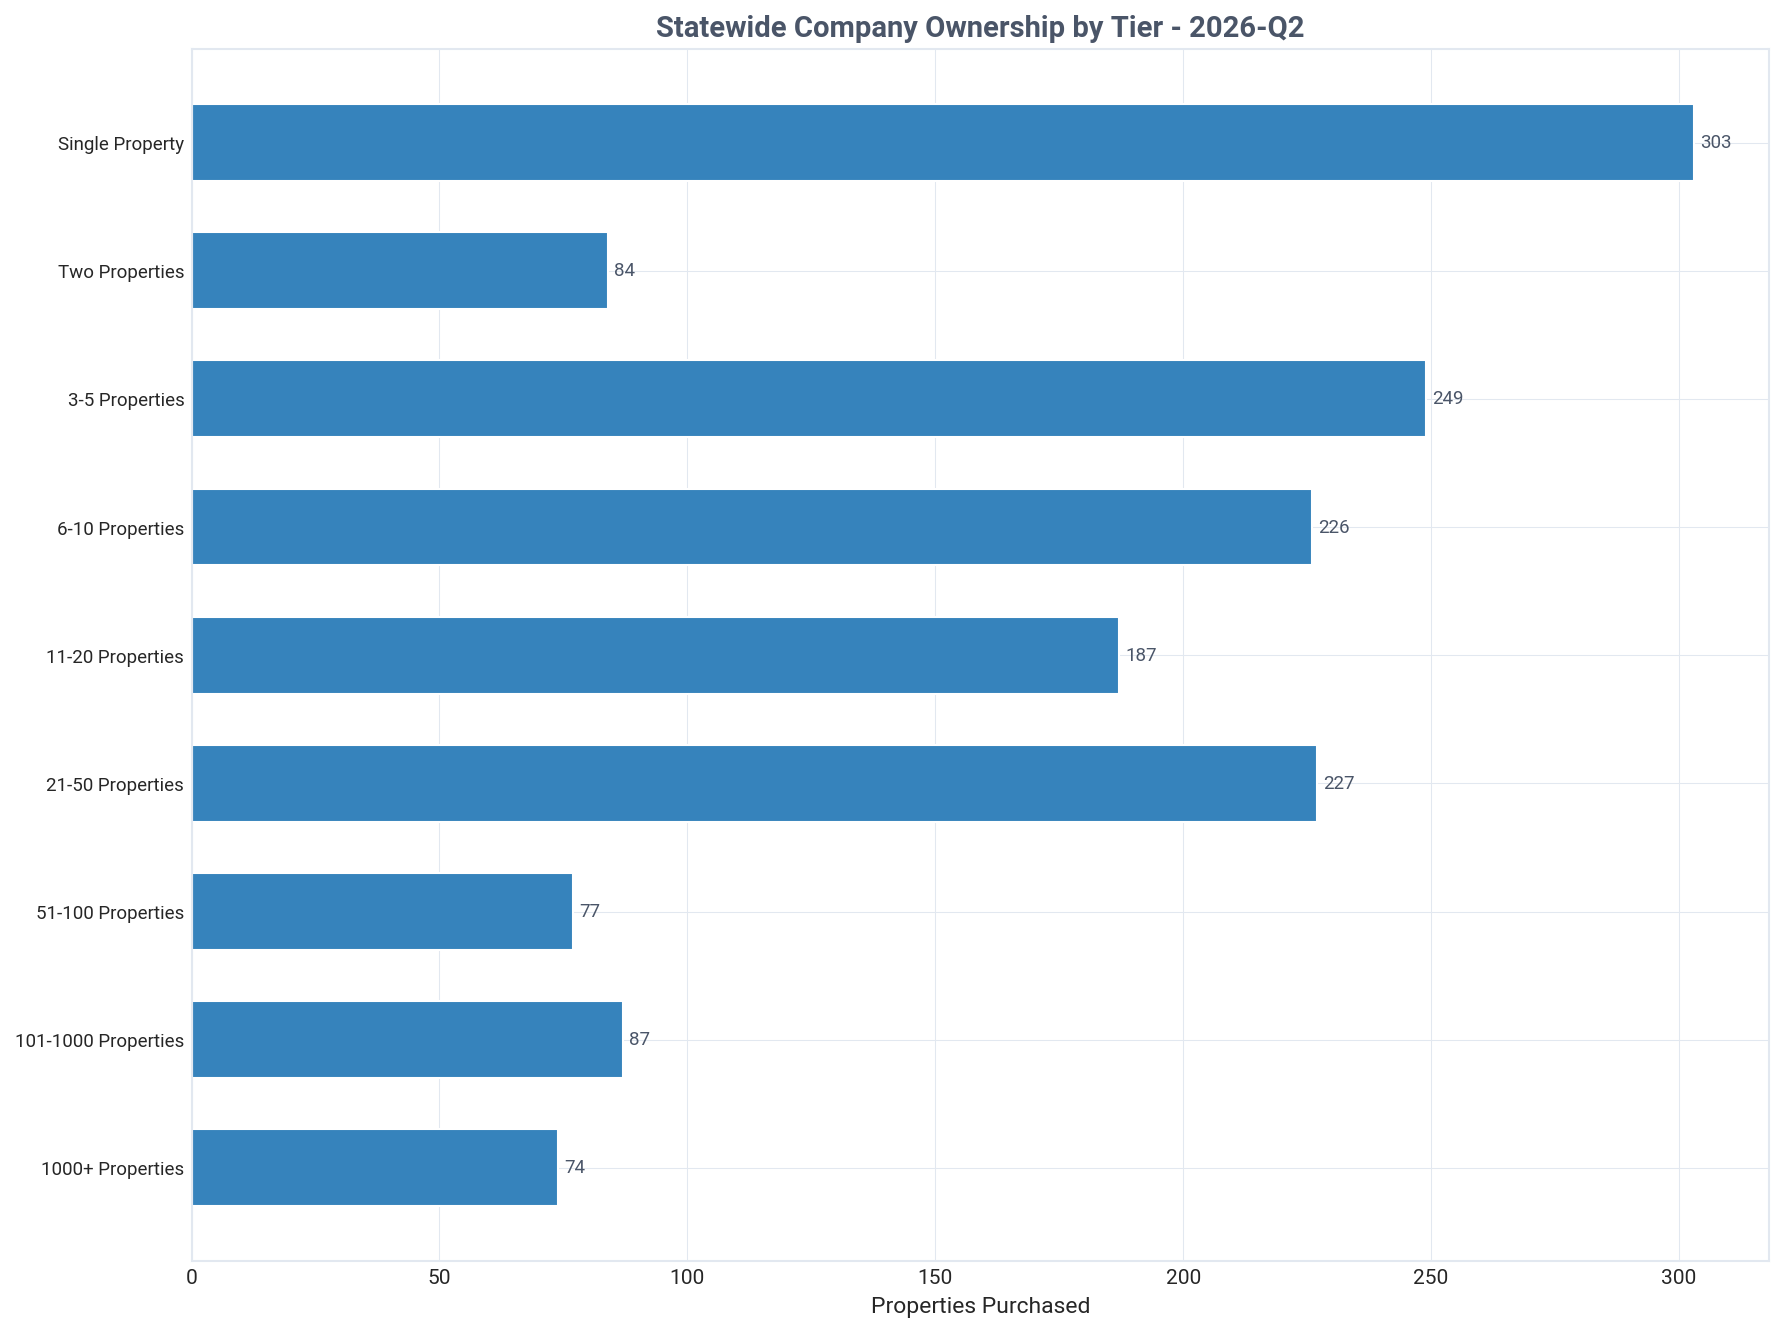
Oklahoma: company purchases by tier this quarter, Q2 2026
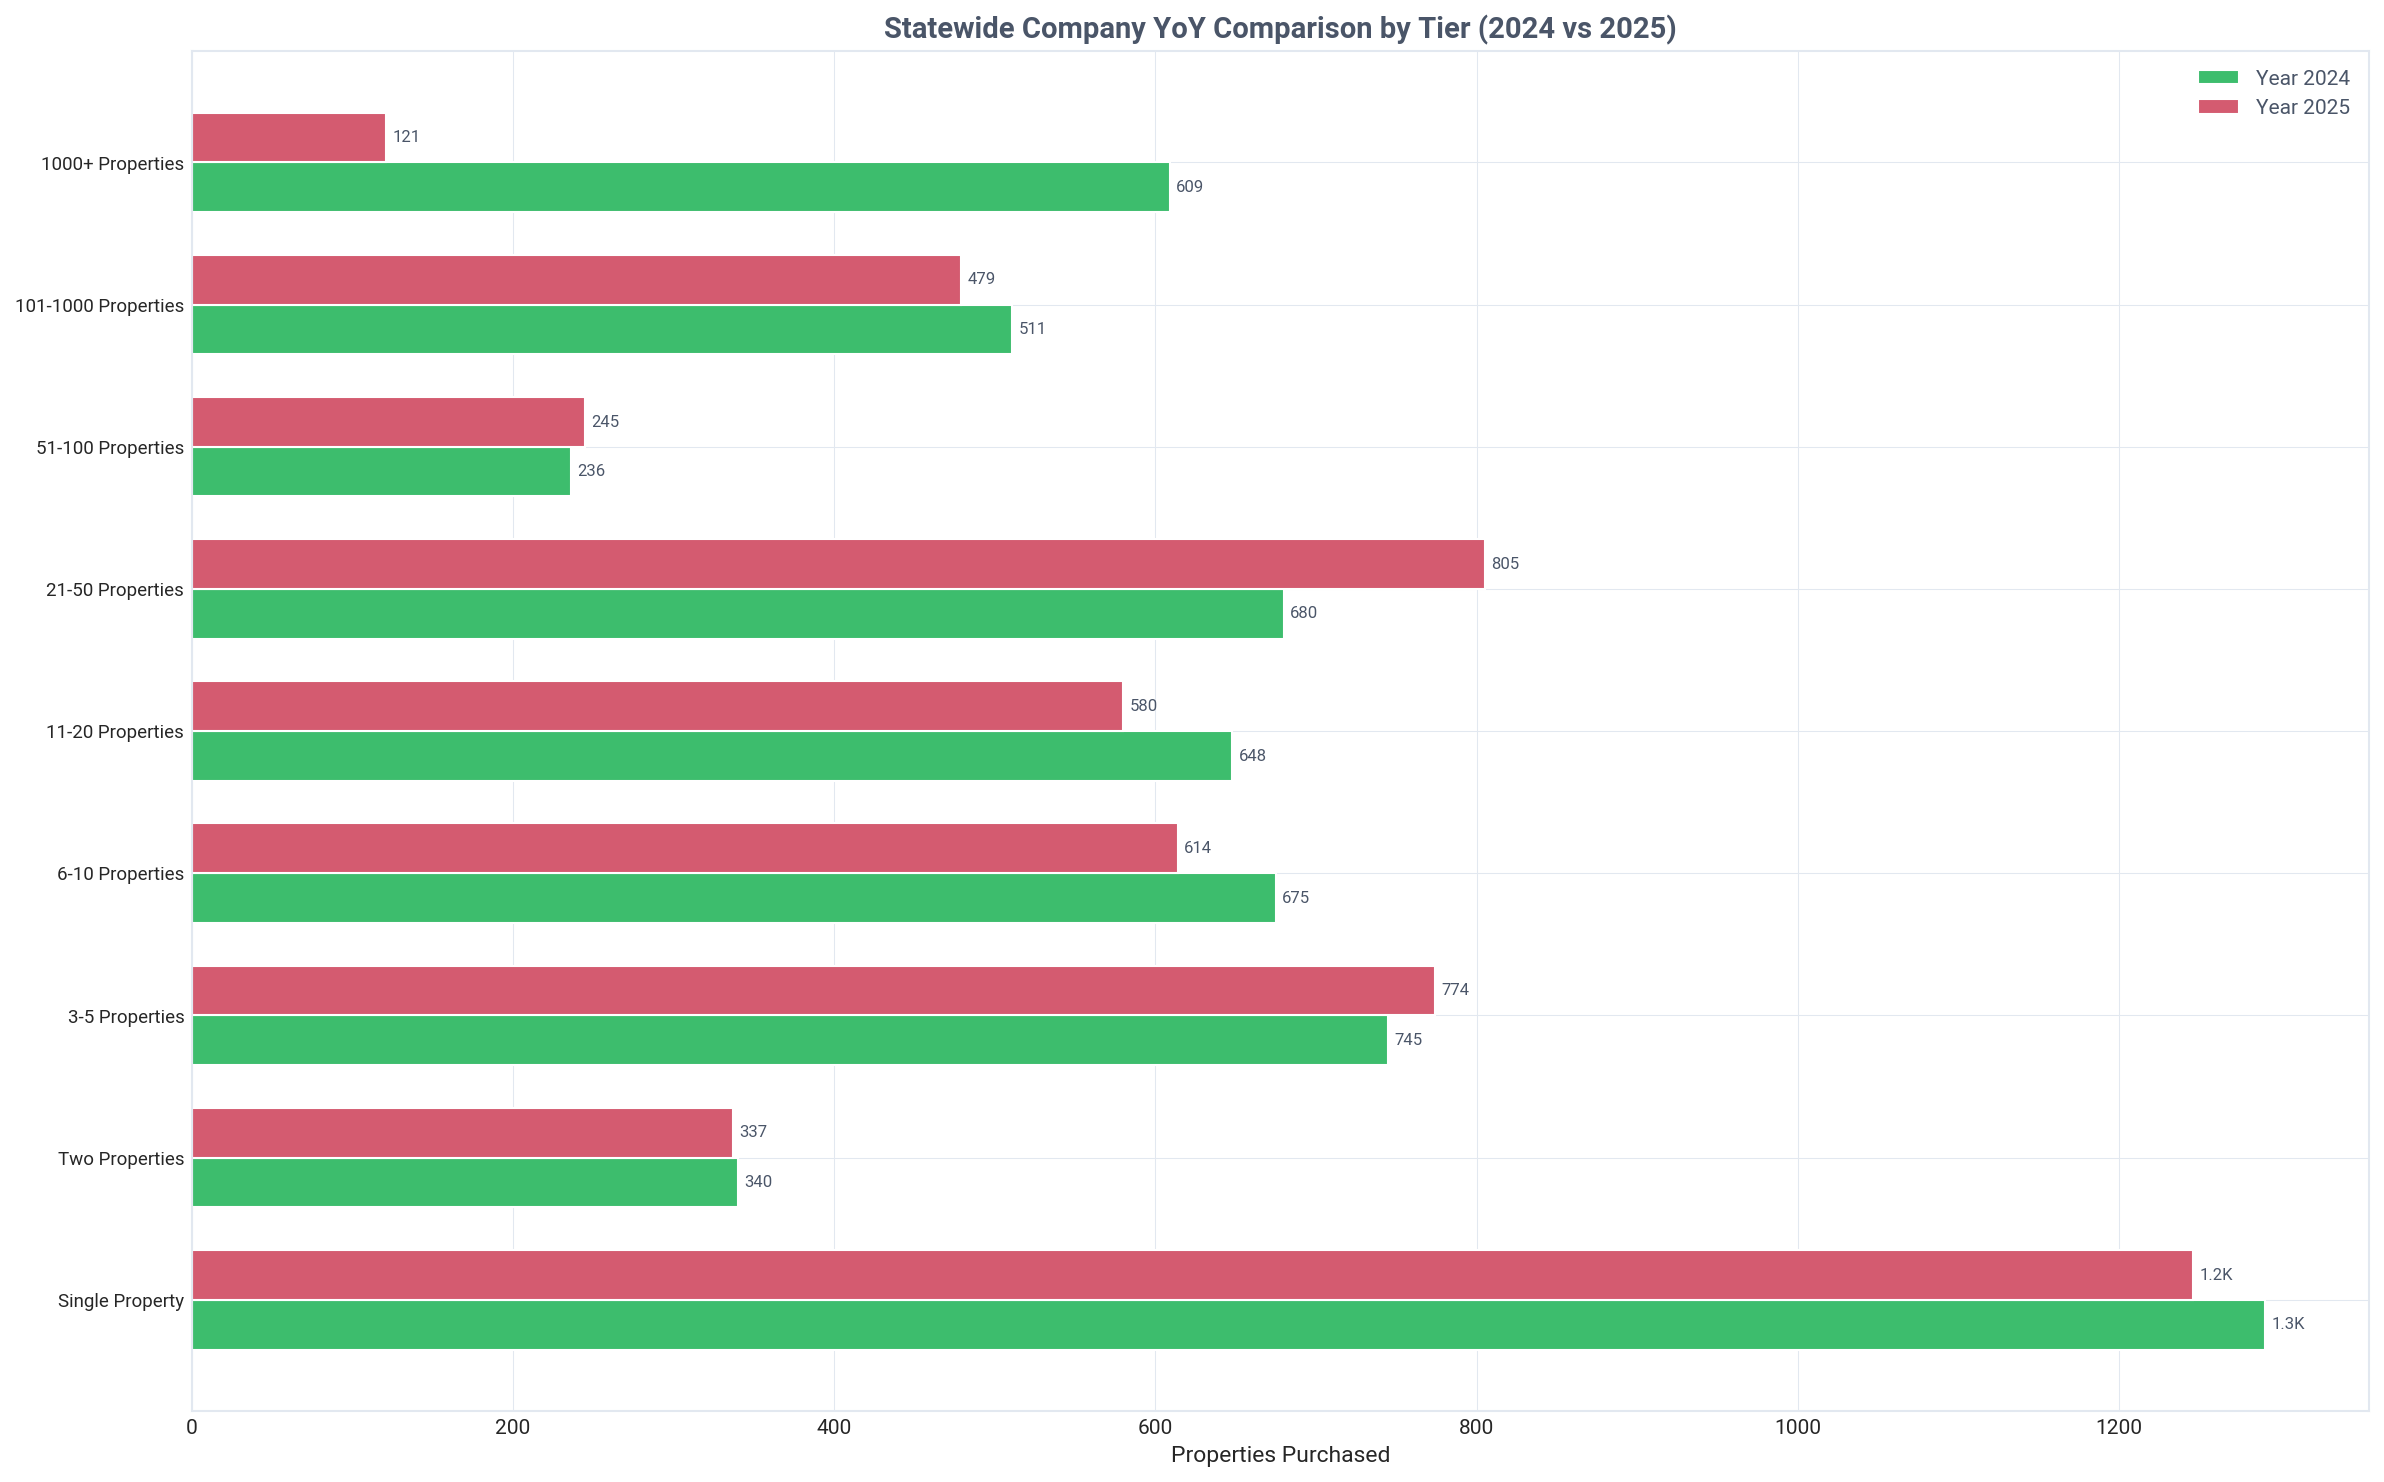
Oklahoma: company purchases by tier year over year, Q2 2026
Key Insight
Companies become the majority property owners at the 6-10 property tier, signaling a key professionalization point.
Detailed Findings

A distinct pattern emerges when analyzing ownership by entity type across portfolio sizes. Individual investors overwhelmingly dominate the entry-level tiers, owning 85.4% of single-property portfolios and 70.8% of two-property portfolios. This indicates that most investors begin their journey as individuals rather than corporate entities.

The transition from individual to corporate ownership occurs as portfolios grow. The critical crossover point is the 6-10 property tier, where companies first become the majority, holding 59.9% of properties compared to 40.1% for individuals. This suggests that as investors scale, they tend to formalize their operations under a corporate structure for liability and financial purposes.

At the largest scales, corporate ownership is nearly absolute. In portfolios of 101-1,000 properties, companies own 99.8% of the assets. The same pattern holds for the 21-50 property tier, where companies control 90.0% of the homes, often leveraging proptech platforms for management.

This trend reveals a clear professionalization ladder within the real estate investment industry. An investor's journey often starts with an individual purchase and evolves into a corporate structure as their portfolio and operational complexity increase.

Even in the mid-size tiers, the shift is apparent. For investors with 11-20 properties, companies already control a supermajority of 75.5% of the assets. This data illustrates that the move to a corporate structure happens relatively early in an investor's growth trajectory.

Geographic Distribution

Regional breakdown of investor activity and ownership patterns

Key Insight
Investor activity is concentrated in Oklahoma and Tulsa counties, which together hold 38.0% of all investor-owned SFRs.
Detailed Findings

Geographic analysis reveals that investor holdings in Oklahoma are heavily concentrated in its primary metropolitan hubs. Oklahoma County leads with 64,180 investor-owned properties, followed by Tulsa County with 40,633. Together, these two counties account for 104,813 properties, representing 38.0% of the state's entire investor portfolio.

Following the top two, other suburban and secondary metro counties like Cleveland (16,879 properties), Canadian (9,510), and Comanche (9,222) demonstrate significant, albeit smaller, concentrations of investor activity. This pattern highlights a strategy focused on areas with strong population density, job growth, and rental demand.

A completely different picture emerges when analyzing ownership as a percentage of the local market. The highest rates of investor penetration are found in rural counties. Cimarron County tops the state with 52.6% of its SFR housing owned by investors, with Harper (44.4%) and McCurtain (42.4%) also showing extremely high concentrations.

The divergence between leaders in raw count versus ownership rate points to two distinct investment strategies. One focuses on high-volume acquisition in large, liquid urban markets, while the other aims for high market control in smaller, potentially less competitive rural areas. Investors can review various market reports to identify these trends.

Notably, the top counties by percentage are completely different from the top counties by count. This indicates that there is no single definition of an 'investor hotspot' in Oklahoma; instead, different market types attract different strategic approaches.

Oklahoma: landlord ownership map, Q2 2026
Oklahoma: top 15 areas by landlord-owned properties, Q2 2026
Oklahoma: top 15 areas by landlord ownership share, Q2 2026

Historical Transactions

Buy/sell transaction trends over time for all landlords and institutional investors

Oklahoma: landlord buy and sell transactions, Q2 2026
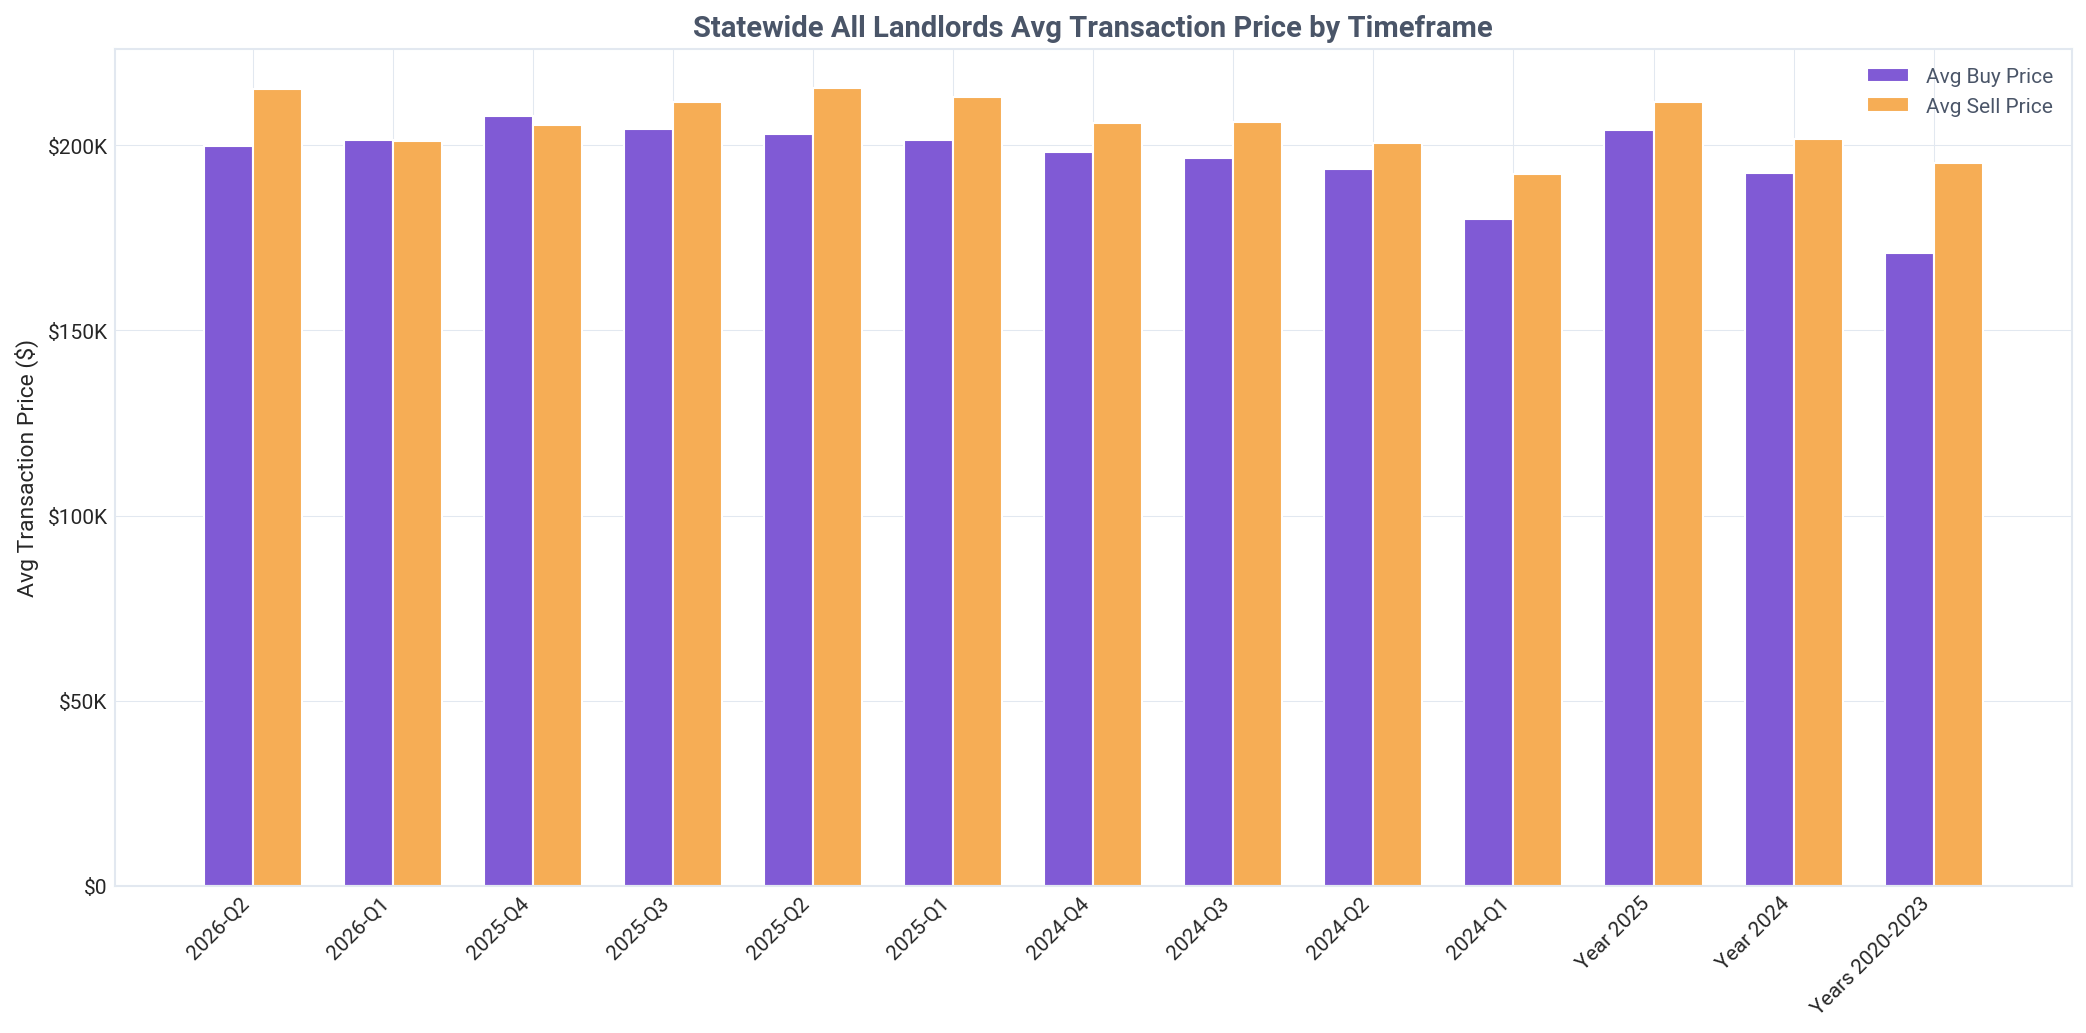
Oklahoma: landlord average buy and sell prices, Q2 2026
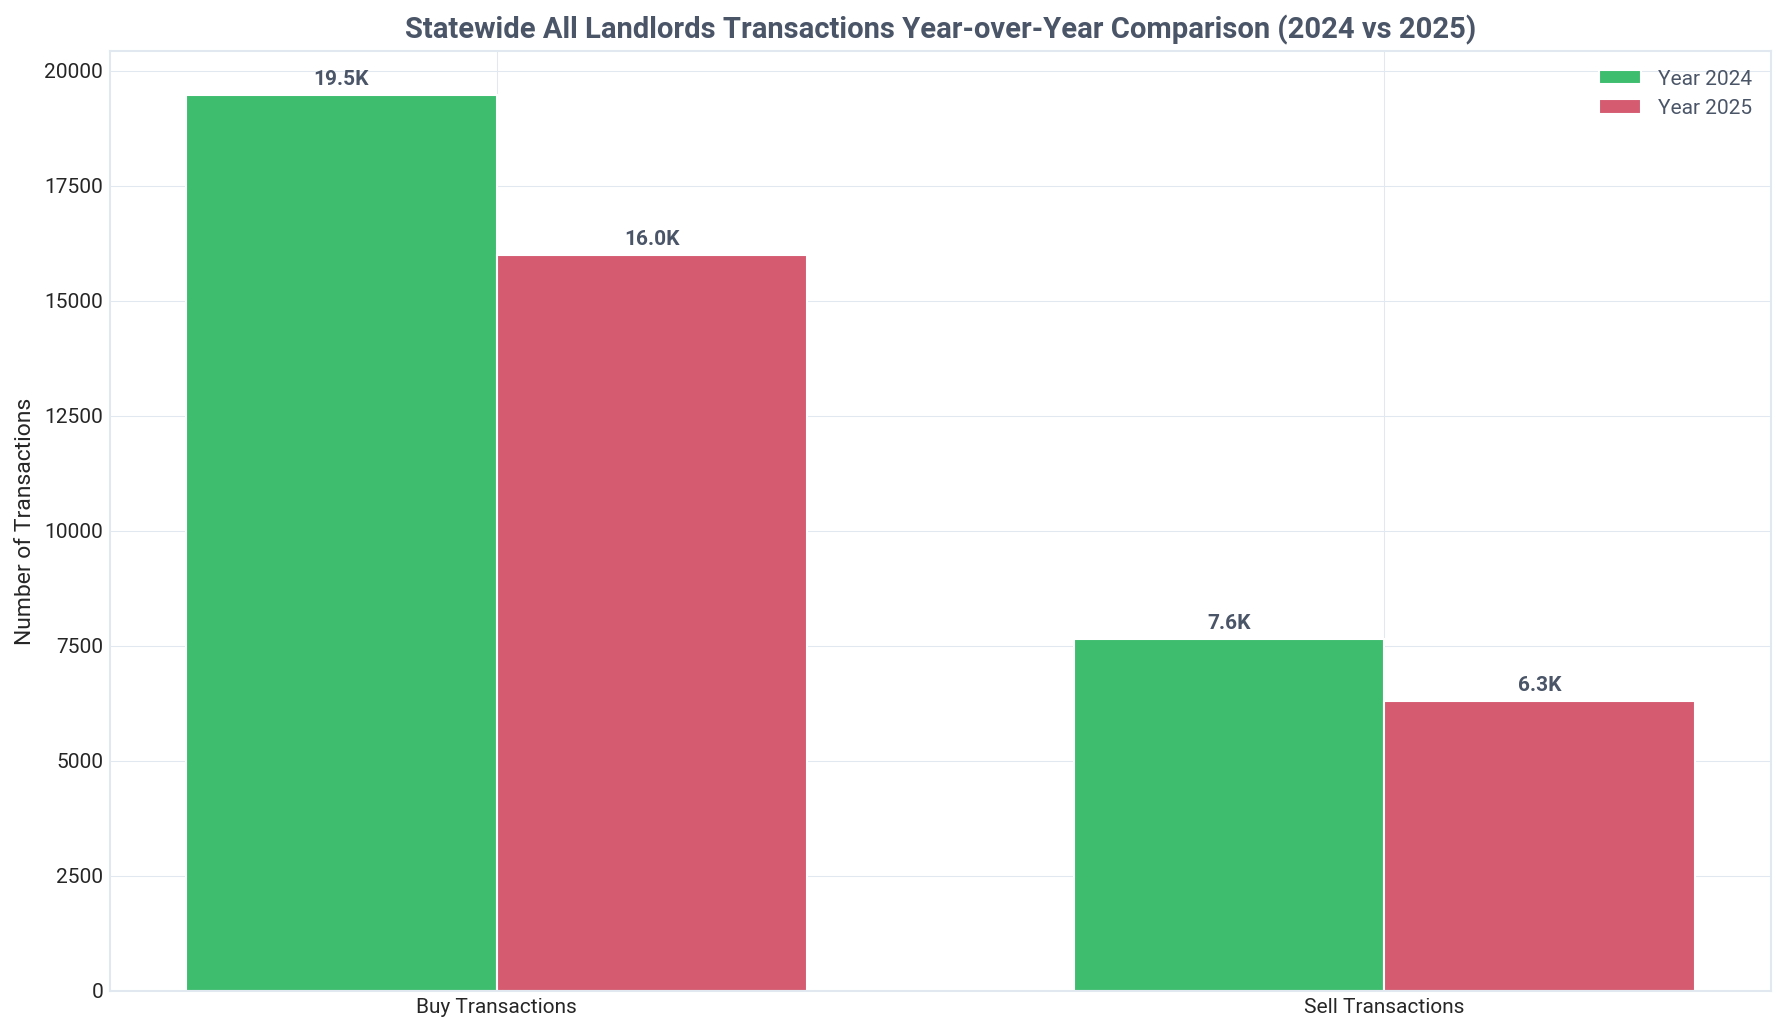
Oklahoma: landlord transactions year over year, Q2 2026
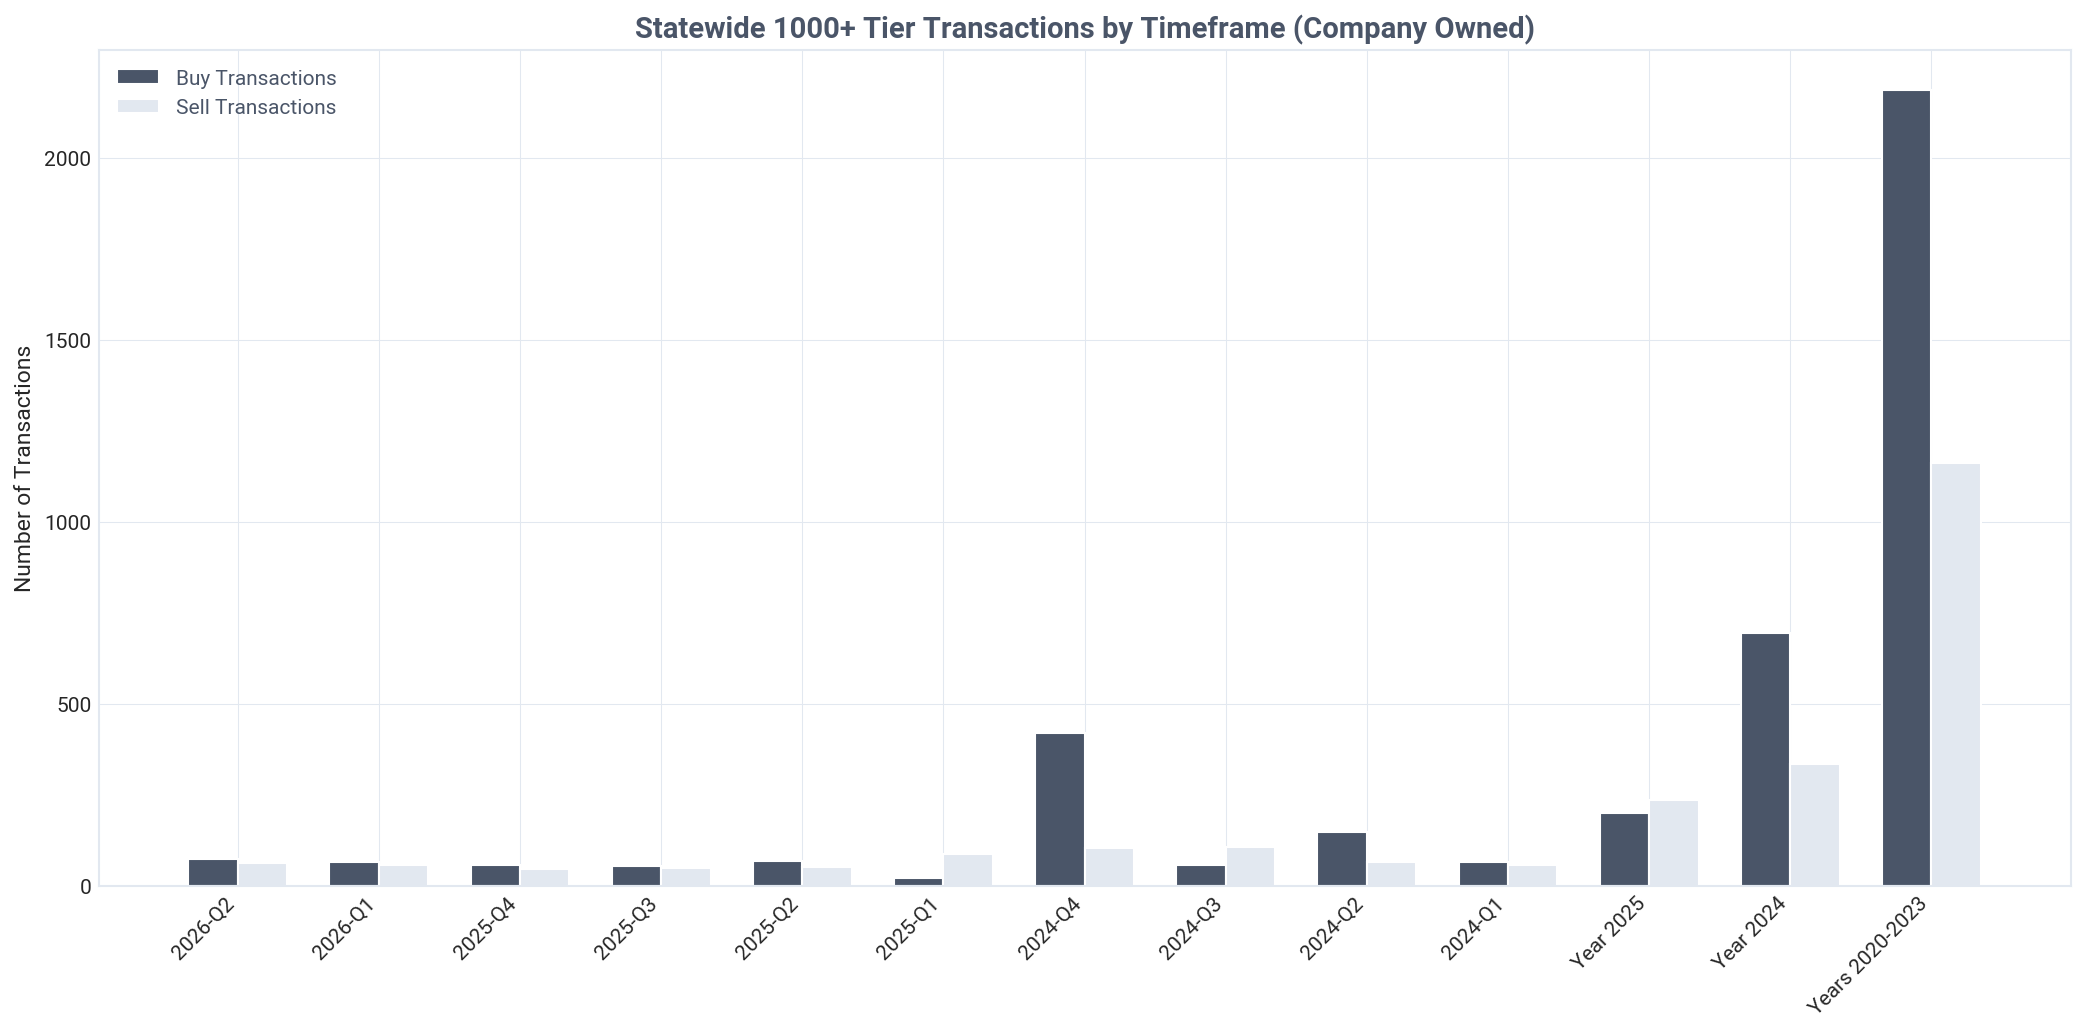
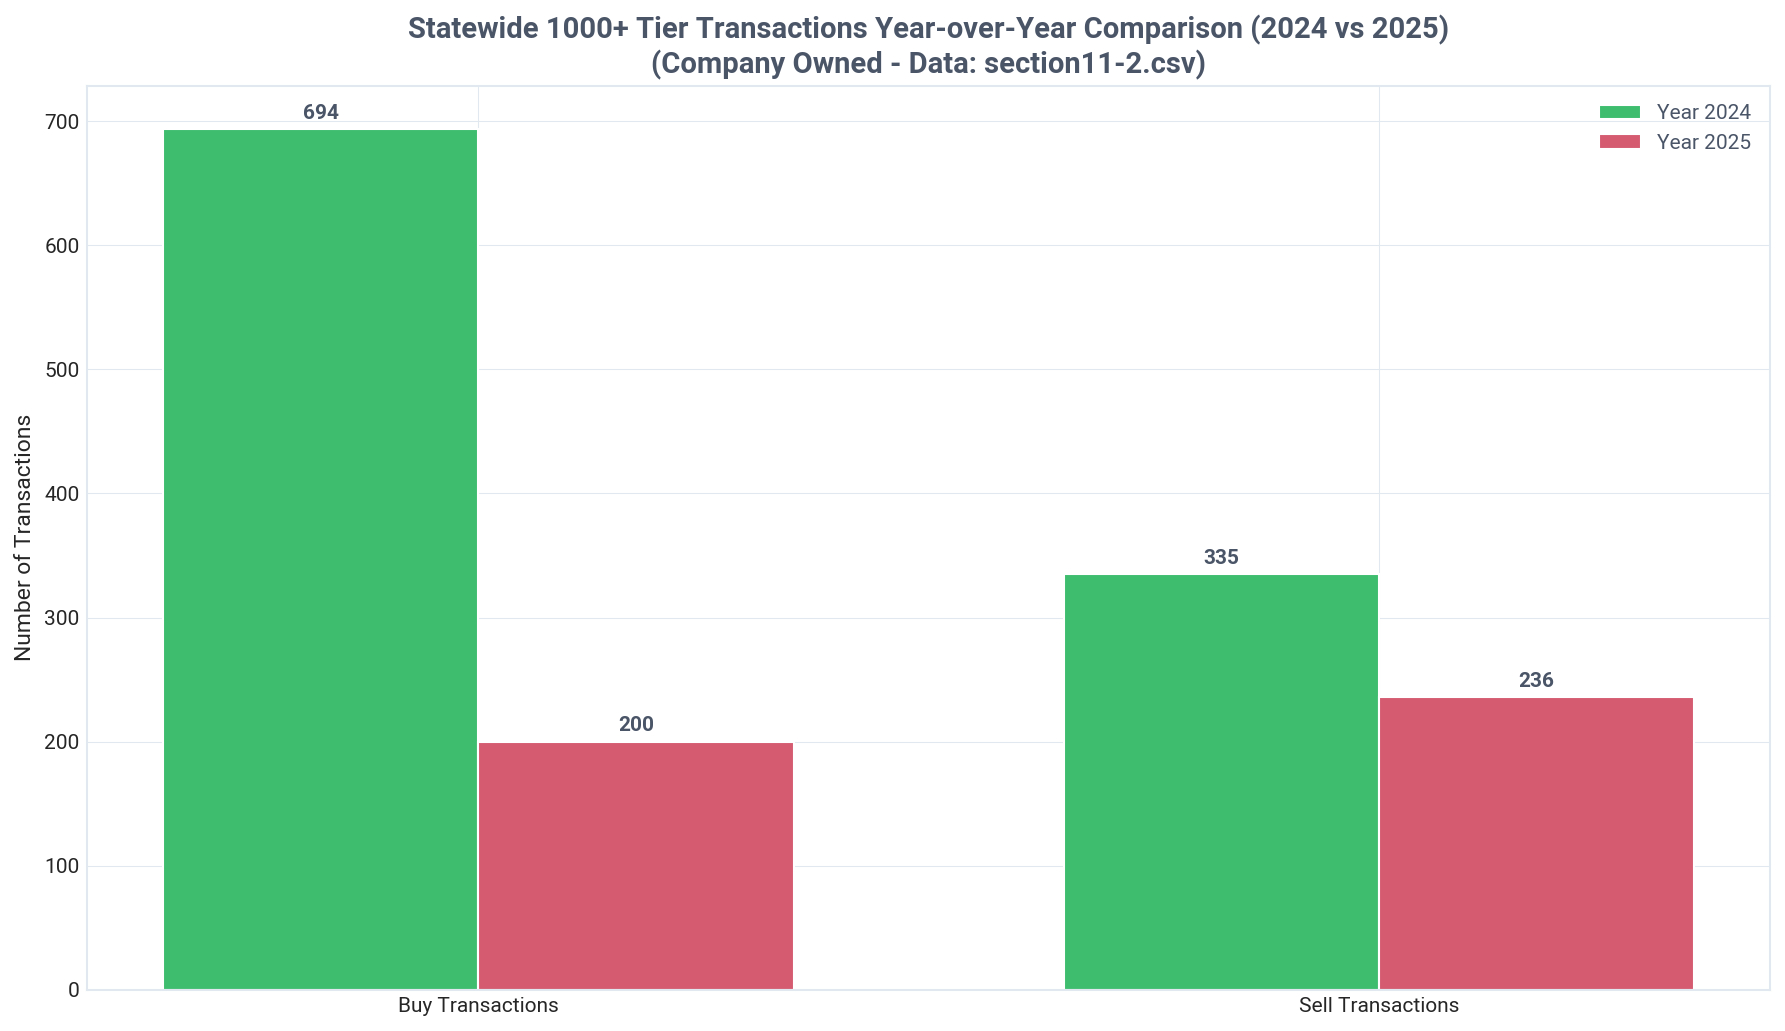
Oklahoma: 1000+ tier company transactions, Q2 2026
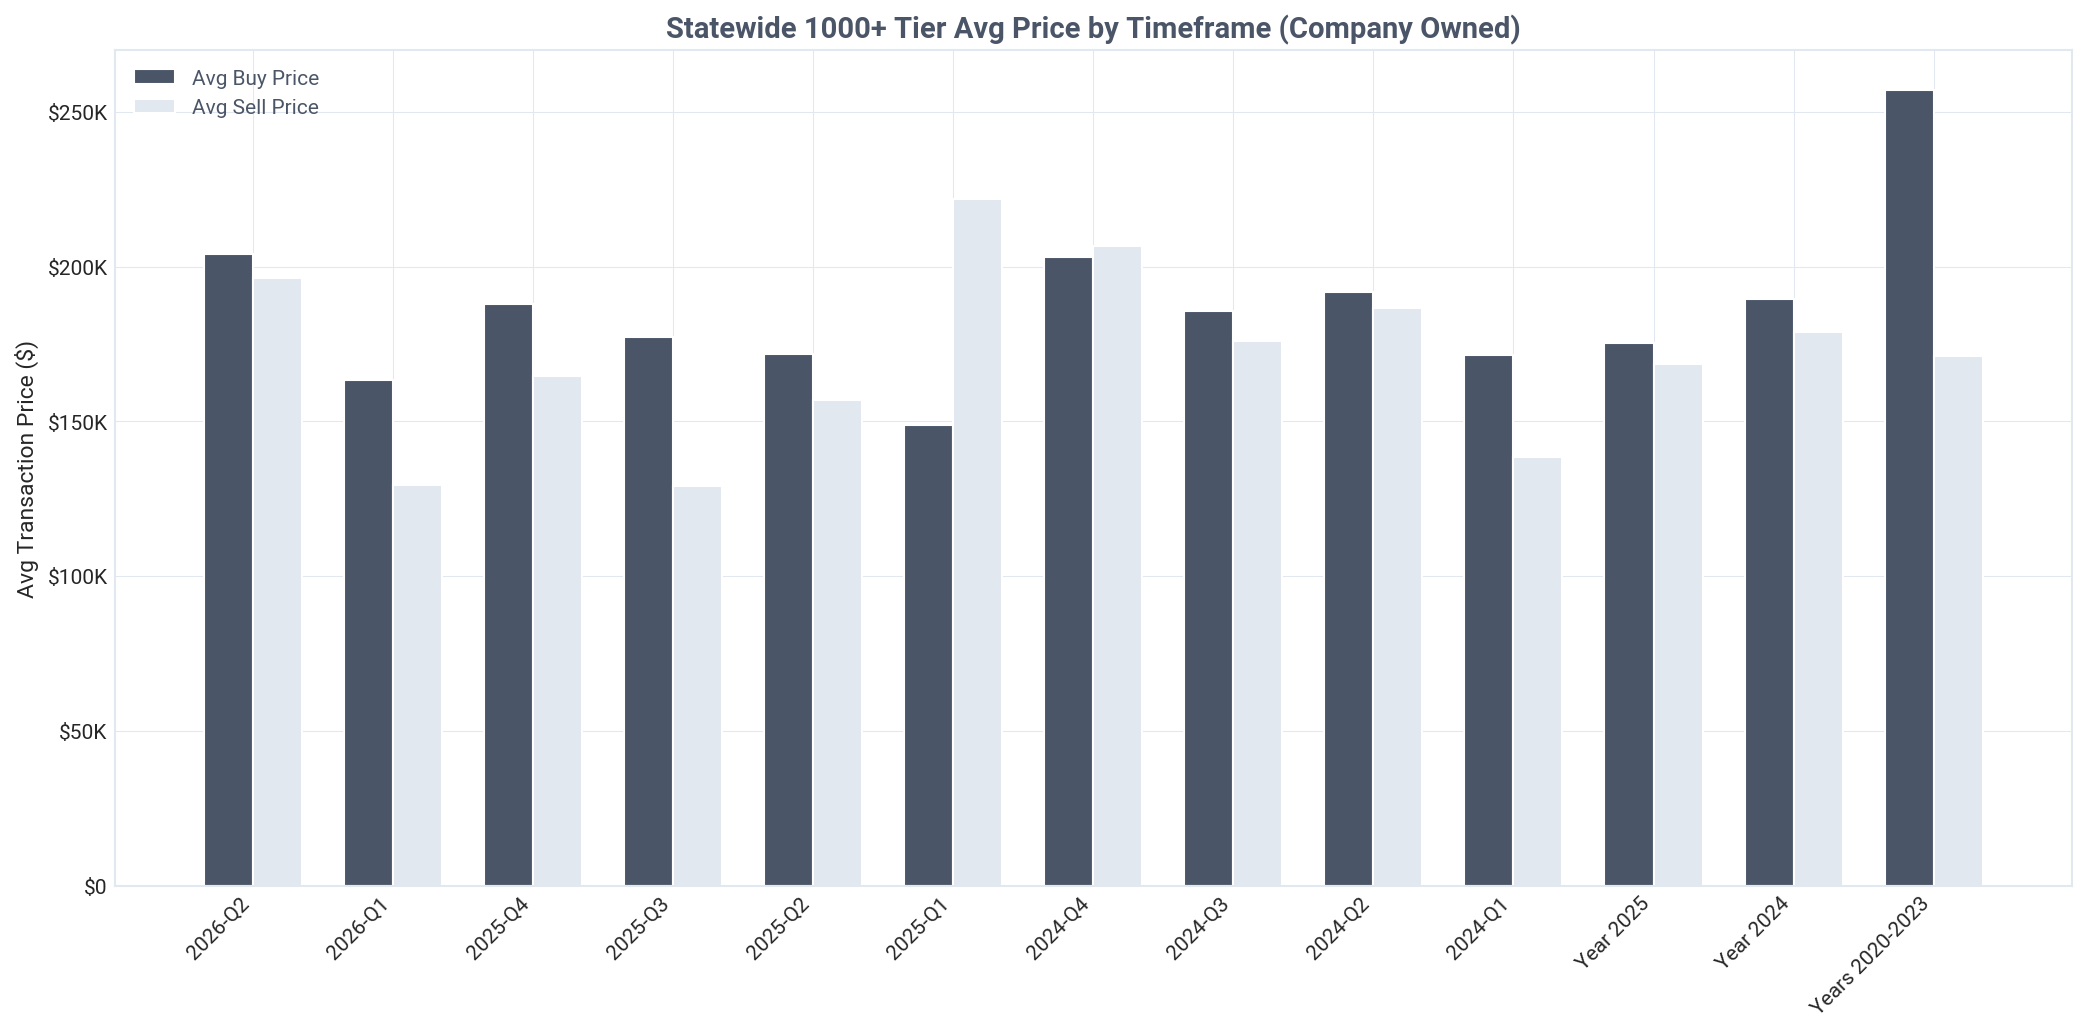
Oklahoma: 1000+ tier company average prices, Q2 2026
Oklahoma: 1000+ tier transactions year over year, Q2 2026
Key Insight
Oklahoma landlords are strong net buyers, acquiring 2.57 properties for every one sold in Q2 2026.
Detailed Findings

The Oklahoma real estate investor market is firmly in an expansion phase. In Q2 2026, landlords collectively purchased 3,664 properties while selling only 1,424, resulting in a net gain of 2,240 properties and a strong buy-to-sell ratio of 2.57. This indicates a high level of confidence and a collective strategy of portfolio growth.

This net buyer stance is a consistent, long-term trend. The positive net acquisition has been maintained through Q1 2026 (+1,693), Q4 2025 (+2,225), and for the full years of 2025 (+9,696) and 2024 (+11,819). The market has demonstrated a sustained appetite for accumulation over an extended period.

Institutional investors (1,000+ properties) have recently pivoted their strategy. After being net sellers for the full year of 2025 (selling 36 more properties than they bought), they have returned to growth in 2026. They were net buyers in both Q1 (+7 properties) and Q2 (+11 properties), signaling a renewed interest in the Oklahoma market.

This institutional shift contrasts with their aggressive buying in 2024, when they had a net gain of 359 properties. Their recent activity, while positive, is more measured, suggesting a cautious but optimistic outlook. This data could be uncovered using a platform with smart search capabilities.

Overall, the transaction data shows a healthy and growing market. Both small and large investors are actively acquiring more properties than they are selling, contributing to the increasing investor ownership rate across the state.

Current Quarter Transactions

Q2 2026 transaction analysis by tier, price, and inter-landlord activity

Key Insight
Landlords participated in 17.9% of all SFR transactions in Q2 2026, with single-property buyers paying the highest prices.
Detailed Findings

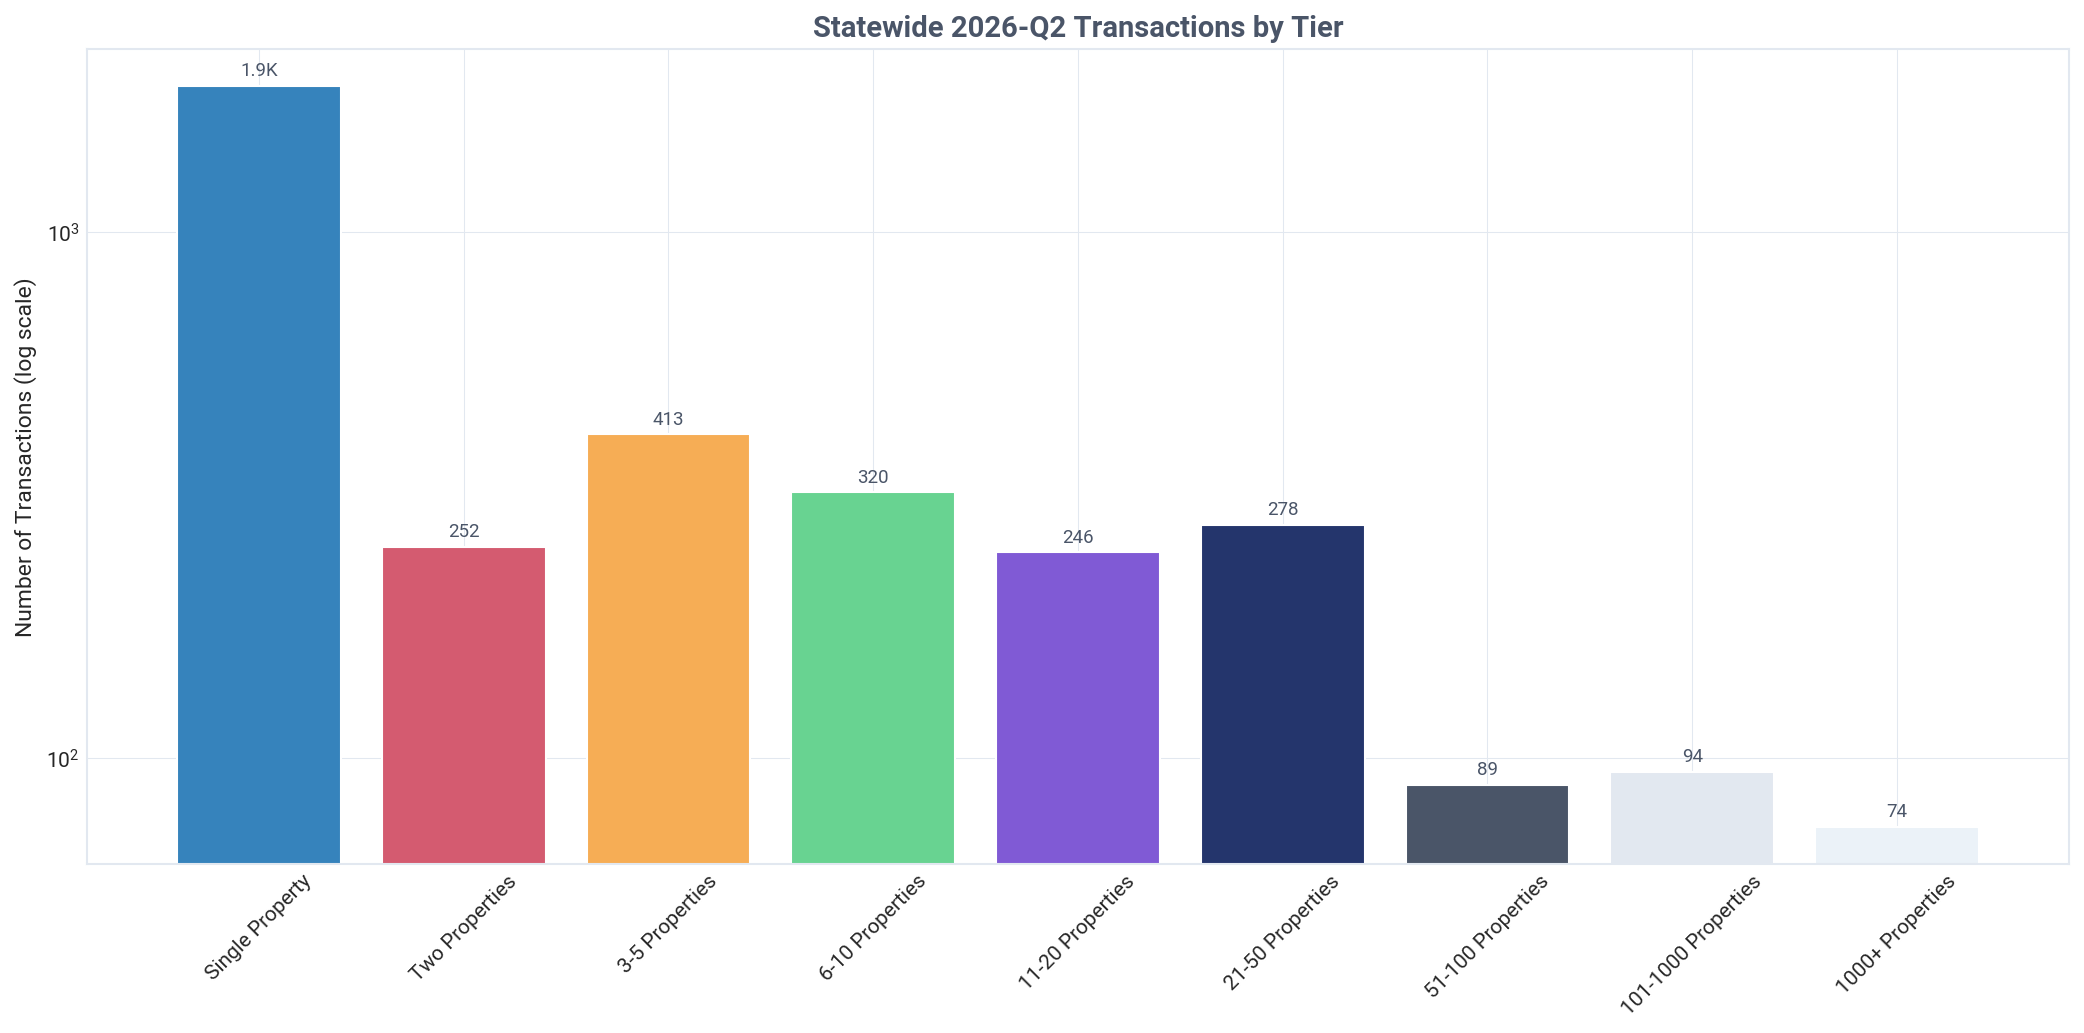
In Q2 2026, landlord activity was a component in 3,664 of the 20,495 total SFR transactions, giving them a 17.9% share of market-wide transactional volume. This activity was heavily concentrated among smaller investors, with mom-and-pop tiers (1-10 properties) accounting for 2,883 of those transactions.

A distinct pricing disadvantage for new investors is evident in the Q2 data. First-time, single-property buyers paid the highest average price of any tier at $225,213. This suggests they are more likely to be buying on-market properties at retail prices, possibly confirmed by looking at public assessor data.

In contrast, larger, more experienced investors achieved significant discounts. Institutional investors paid an average of $203,971, or 9.4% less than their single-property counterparts. The deepest discounts were secured by the 51-100 property tier, who paid an average of just $101,013, likely by targeting specific types of distressed or off-market assets.

Inter-landlord trading is a key strategy for mid-size investors. The 51-100 property tier sourced 37.1% of their Q2 acquisitions from other landlords, more than any other group. This indicates a focus on acquiring established rental properties, potentially with tenants already in place.

For smaller investors (1-10 properties), the reliance on purchasing from other landlords is much lower, ranging from 10.3% to 12.3%. This suggests they are more often competing with traditional homebuyers for inventory on the open market, which contributes to their higher average purchase prices.

Oklahoma: landlord share of transactions, Q2 2026
Oklahoma: transactions by tier this quarter, Q2 2026
Oklahoma: average purchase price by tier, Q2 2026

Ready to leverage this data for your real estate investment decisions?

TALK TO AN EXPERT

Executive Summary

Oklahoma's SFR market is defined by small investors, who own 85.5% of the portfolio and are expanding as strong net buyers.
Holdings
Investors own 275,483 SFR properties, representing 23.1% of Oklahoma's total market. The portfolio is dominated by individual investors who hold 187,734 properties (68.1%), while companies own the remaining 92,389 (33.5%).
Pricing
In Q2 2026, landlords secured properties at a massive 29.2% discount compared to traditional homeowners, paying an average of $215,407 versus the homeowner's $304,118, a savings of $88,711 per home.
Activity
Landlords purchased 20.2% of all homes sold in Q2 2026, with 1,889 new single-property landlords entering the market. Mom-and-pop investors drove this activity, accounting for 78.2% of all investor acquisitions.
Market Share
Small mom-and-pop landlords (1-10 properties) control 85.5% of all investor-owned housing in Oklahoma. In stark contrast, institutional investors (1,000+ properties) own just 1.0% of the portfolio.
Ownership Type
Individual investors form the base of the market, but companies become the majority owners once a portfolio grows to the 6-10 property tier. This signals a clear trend of professionalization as investors scale their operations.
Transactions
Landlords are in a strong accumulation phase, acting as net buyers with a 2.57x buy-to-sell ratio in Q2 2026 (3,664 buys vs 1,424 sells). After being net sellers in 2025, institutional investors have returned to being net buyers in 2026.
Market Narrative

The single-family residential market in Oklahoma is profoundly shaped by investor activity, as detailed in these Investor Pulse reports. Investors now own 275,483 properties, constituting 23.1% of the state's entire SFR housing stock. The defining characteristic of this market is its decentralized nature. Individual investors own a commanding 68.1% of these properties (187,734 homes), and small 'mom-and-pop' landlords (1-10 properties) control a staggering 85.5% of the total investor portfolio. In sharp contrast, large institutional firms (1,000+ properties) have a minimal footprint, owning just 1.0% of the inventory. This structure demonstrates that the Oklahoma rental market is overwhelmingly supplied by local, small-scale operators, not large corporations.
Investor behavior in Q2 2026 reveals sophisticated and aggressive acquisition strategies. Landlords purchased 20.2% of all homes sold, and they did so at a remarkable 29.2% discount compared to traditional homeowners, saving an average of $88,711 per property. This buying activity is fueled by a constant influx of new participants, with 1,889 new single-property landlords entering the market this quarter alone. The entire investor segment is in a strong growth phase, collectively buying 2.57 properties for every one sold. Even institutional investors, who were divesting in 2025, have pivoted back to being net buyers in 2026, signaling renewed confidence in the market. This often involves detailed due diligence, including skip tracing to find off-market deals and analyzing mortgage transaction data.

The key takeaway from this data is that Oklahoma's SFR investment landscape is a dynamic and growing ecosystem dominated by individuals and small businesses. The narrative of institutional takeover does not apply here; instead, the market's health and expansion are driven by local entrepreneurs. These investors are adept at finding value, consistently purchasing properties far below retail prices. Their continued net-positive acquisition trend indicates a strong, long-term belief in Oklahoma real estate, ensuring a steady supply of rental housing but also adding a highly competitive element to the purchasing market. This valuable market intelligence can be accessed through bulk data delivery for deeper analysis.

About This Report

Report Methodology

This report analyzes BatchData's Investor Pulse dataset, covering single-family residential (SFR) investor activity across the United States.

Data is extracted from 15 CSV files covering ownership, transactions, and pricing trends, then analyzed using AI-powered insights.

Property Counting Methodology:

Distinct Counts: All headline totals represent distinct properties. If 2+ landlords co-own the same property, it's counted only once. This provides accurate market representation.

Category Breakdowns: When analyzing by tier (01-09), owner type (Individual/Corporate), or occupancy status, properties with co-ownership across categories are counted once per category. This causes breakdowns to sum 2-4% higher than totals, and percentages may sum to 100-104%. This is expected and reflects co-ownership patterns.

Tier Properties Category
01-041-10Mom-and-Pop
05-0711-100Mid-Size
08101-1000Large
091000+Institutional
About BatchData

BatchData provides comprehensive real estate data and analytics, offering insights into property ownership, investor activity, and market trends across the United States.

The Investor Pulse dataset tracks single-family residential (SFR) investor behavior at national, state, county, and MSA levels.

For more information, visit batchdata.io or explore our API documentation.

Data Freshness
Report Generated October 29, 2026 at 12:28 AM
Data Period Q2 2026
Geography Level State
Geography Oklahoma
×
Chart Section2 Coverage
Oklahoma: SFR vs other property coverage, Q2 2026
×
Chart Section3 Ownership Donut
Oklahoma: SFR ownership share, company vs individual, Q2 2026
×
Chart Section3 Ownership Bar
Oklahoma: SFR properties by owner type, Q2 2026
×
Chart Section4 Distribution
Oklahoma: company vs individual landlords, Q2 2026
×
Chart Section5 Holdings
Oklahoma: landlord SFR holdings by type, Q2 2026
×
Chart Section6 Prices
Oklahoma: properties purchased by timeframe, Q2 2026
×
Chart Section6 Prices Alt
Oklahoma: average acquisition price by timeframe, Q2 2026
×
Chart Section6 Yoy Comparison
Oklahoma: average acquisition price year over year, Q2 2026
×
Chart Section6 Trends
Oklahoma: average acquisition price by buyer type, Q2 2026
×
Chart Section7 Purchases
Oklahoma: purchases by tier, Q2 2026
×
Chart Section7 Tiers
Oklahoma: purchased property share by tier, Q2 2026
×
Chart Section8 Distribution
Oklahoma: current ownership by purchase tier, Q2 2026
×
Chart Section8 Prices
Oklahoma: properties purchased by tier, all time, Q2 2026
×
Chart Section8 Prices Q4
Oklahoma: properties purchased by tier this quarter, Q2 2026
×
Chart Section8 Prices 2020
Oklahoma: properties purchased by tier, historical, Q2 2026
×
Chart Section8 Yoy Comparison
Oklahoma: properties purchased by tier year over year, Q2 2026
×
Chart Section9 Ownership
Oklahoma: ownership by tier and owner type, Q2 2026
×
Chart Section9 Growth
Oklahoma: company purchases by tier, all time, Q2 2026
×
Chart Section9 Growth Q4
Oklahoma: company purchases by tier this quarter, Q2 2026
×
Chart Section9 Yoy Comparison
Oklahoma: company purchases by tier year over year, Q2 2026
×
Chart Section10 Top Regions
Oklahoma: top 15 areas by landlord-owned properties, Q2 2026
×
Chart Section10 Top Pct
Oklahoma: top 15 areas by landlord ownership share, Q2 2026
×
Chart Section10 Map
Oklahoma: landlord ownership map, Q2 2026
×
Chart Section11 Buysell
Oklahoma: landlord buy and sell transactions, Q2 2026
×
Chart Section11 Buysell Price
Oklahoma: landlord average buy and sell prices, Q2 2026
×
Chart Section11 Yoy All Landlords
Oklahoma: landlord transactions year over year, Q2 2026
×
Chart Section11 Institutional
Oklahoma: 1000+ tier company transactions, Q2 2026
×
Chart Section11 Institutional Price
Oklahoma: 1000+ tier company average prices, Q2 2026
×
Chart Section11 Yoy Institutional
Oklahoma: 1000+ tier transactions year over year, Q2 2026
×
Chart Section12 Transactions
Oklahoma: landlord share of transactions, Q2 2026
×
Chart Section12 Prices
Oklahoma: transactions by tier this quarter, Q2 2026
×
Chart Section12 Prices Detail
Oklahoma: average purchase price by tier, Q2 2026

Licensing & Usage Rights

This report, data, and all visual analyses are the property of BatchData © 2026 BatchService, Inc. and are licensed under Creative Commons Attribution-NonCommercial-NoDerivatives 4.0 International (CC BY-NC-ND 4.0).

You MAY: Download, share, or excerpt this content for personal or non-commercial purposes, provided you give clear attribution to BatchData with a link back to this original page.

You MAY NOT: Use this data commercially, resell or redistribute it as your own, or publish modified versions.

For commercial licensing: batchdata.io/contact-sales

Creative Commons BY-NC-ND 4.0 - creativecommons.org/licenses/by-nc-nd/4.0/

How to cite this report

BatchData. (2026). Q2 2026 OK State Report. BatchService, Inc. Retrieved from https://reports.batchdata.io/investorpulse-reports/2026-q2-state-ok/. Licensed under CC BY-NC-ND 4.0.