Maine Investor Pulse Report (2026-Q2)

Real Estate comprehensive investment analysis of investor activity in the Maine single-family residential housing market. Discover ownership trends, transaction patterns, and market insights.

Market Overview

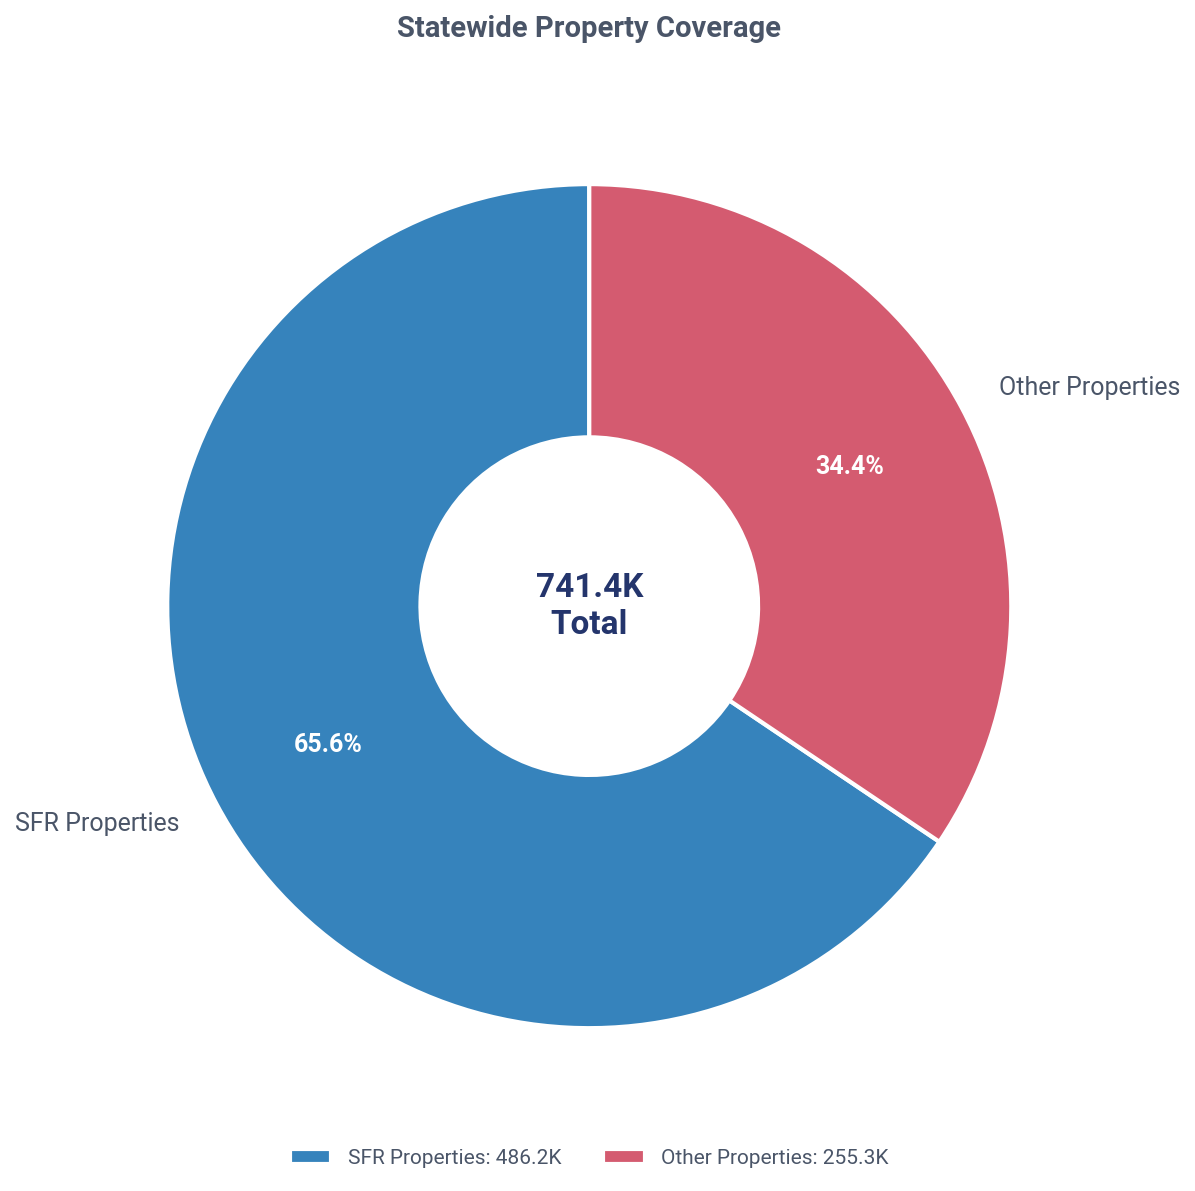
Total SFR Properties in Maine
486,154
Total Investors in Maine
212,287
Investor Owned SFR in Maine
150,332(30.9%)
Individual Landlords
Landlords
194,852
SFR Owned
135,771
Corporate Landlords
Landlords
17,435
SFR Owned
19,666
Understanding Property Counts

Distinct Count Methodology: The total 150,332 represents distinct properties - if 2+ landlords co-own the same property, it's counted only once. This provides the most accurate representation of investor-owned SFR properties.

Why totals don't sum: When broken down by Individual vs Corporate ownership (or by tier), properties with co-ownership across categories are counted once per category. For example, if a property is co-owned by an individual AND a corporate landlord, it appears in both counts. This is why Individual + Corporate totals may exceed the distinct total by 2-4%, and percentages may sum to 100-104%.

Market Visualization

Maine: SFR vs other property coverage, Q2 2026
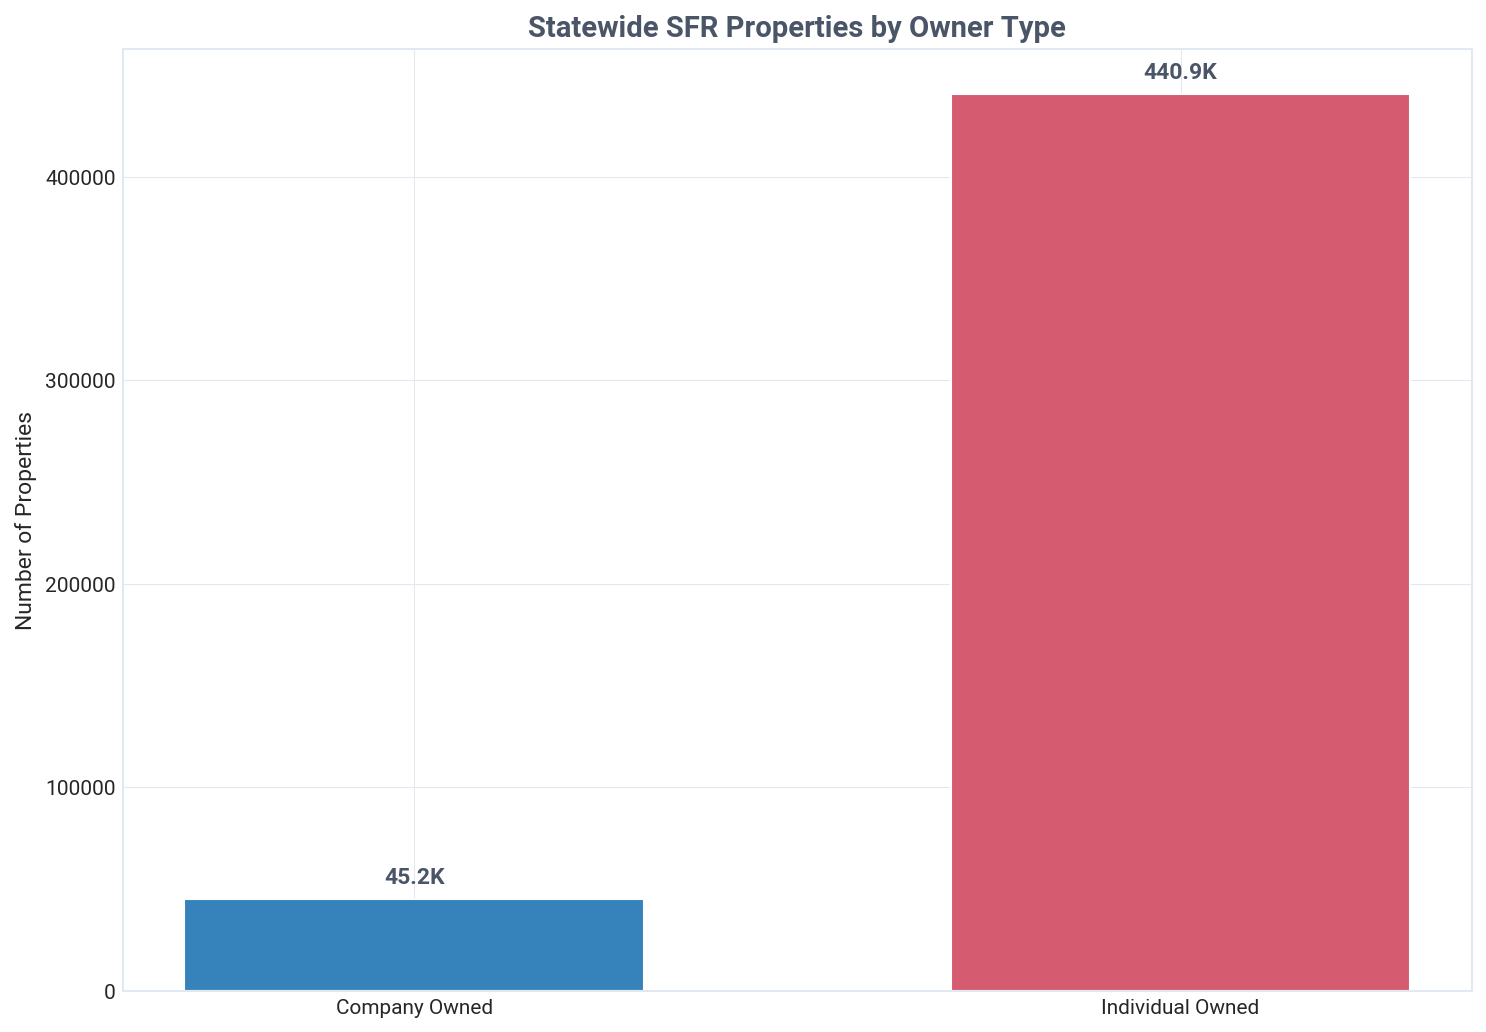
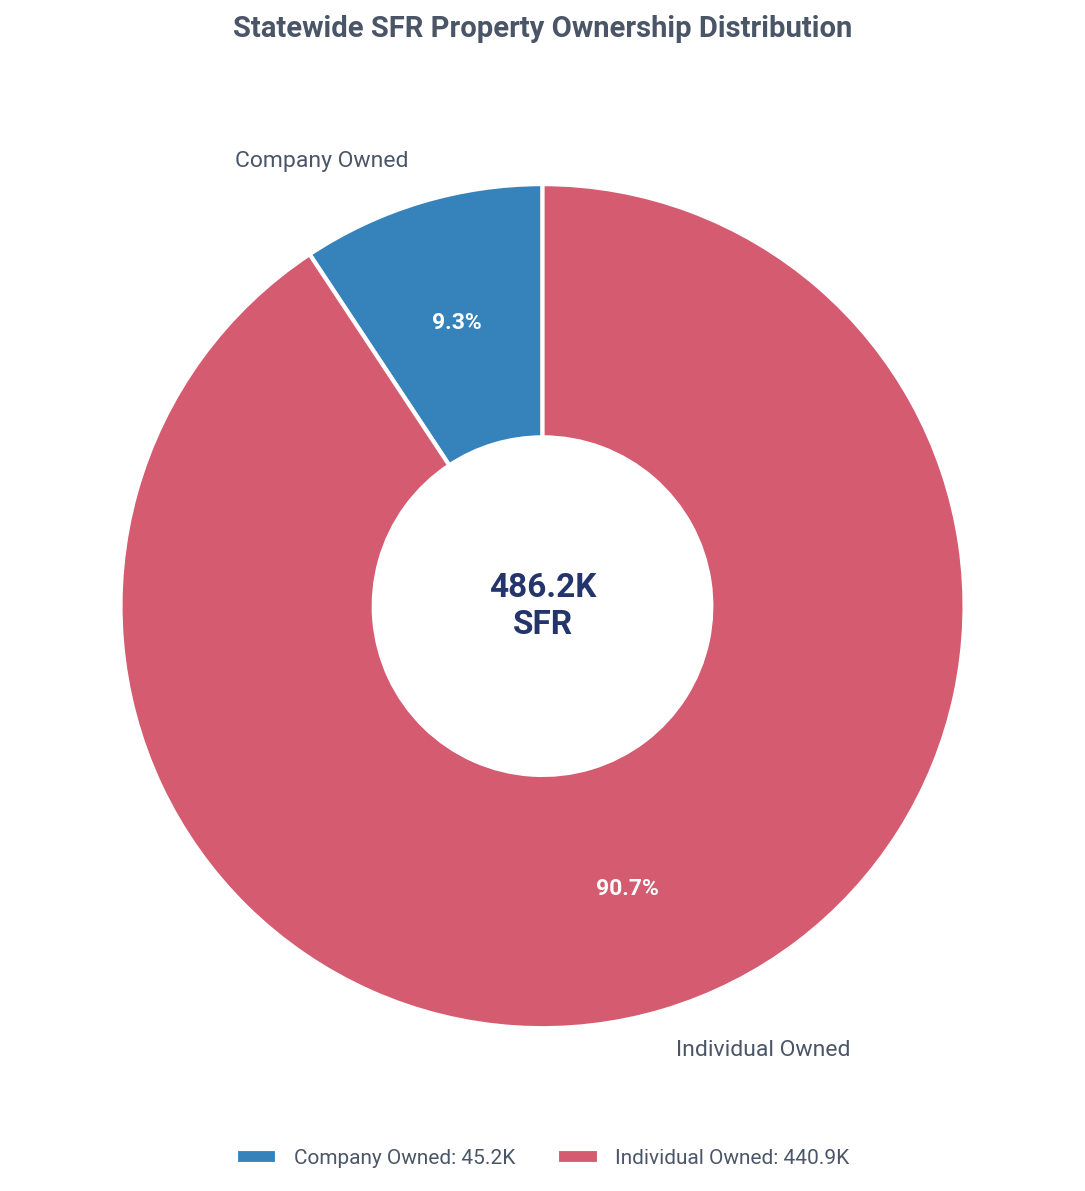
Maine: SFR ownership share, company vs individual, Q2 2026
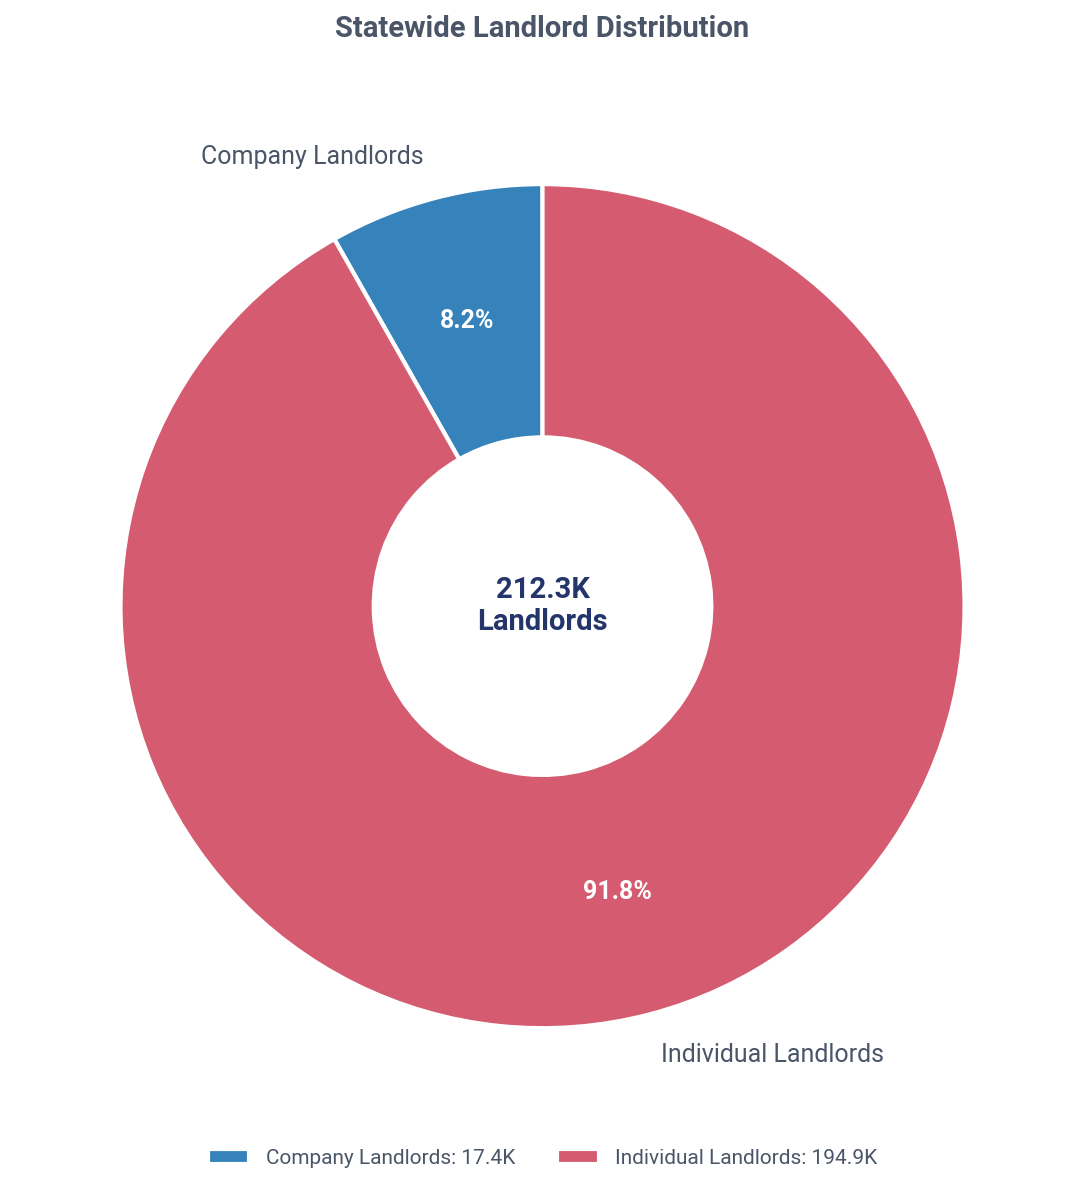
Maine: company vs individual landlords, Q2 2026

Key Market Insights

Maine's Real Estate Market is Dominated by Small Landlords, Capturing 59.6% of Q2 Home Sales
Investors own 150,332 SFR properties in Maine, representing 30.9% of the total market. This landscape is overwhelmingly controlled by mom-and-pop landlords (99.4% of holdings), with individuals owning 90.3% of the portfolio. In Q2 2026, investors were aggressive net buyers, purchasing 59.6% of all available properties at an 8.3% discount compared to traditional homeowners.
Landlord Owned Current Holdings
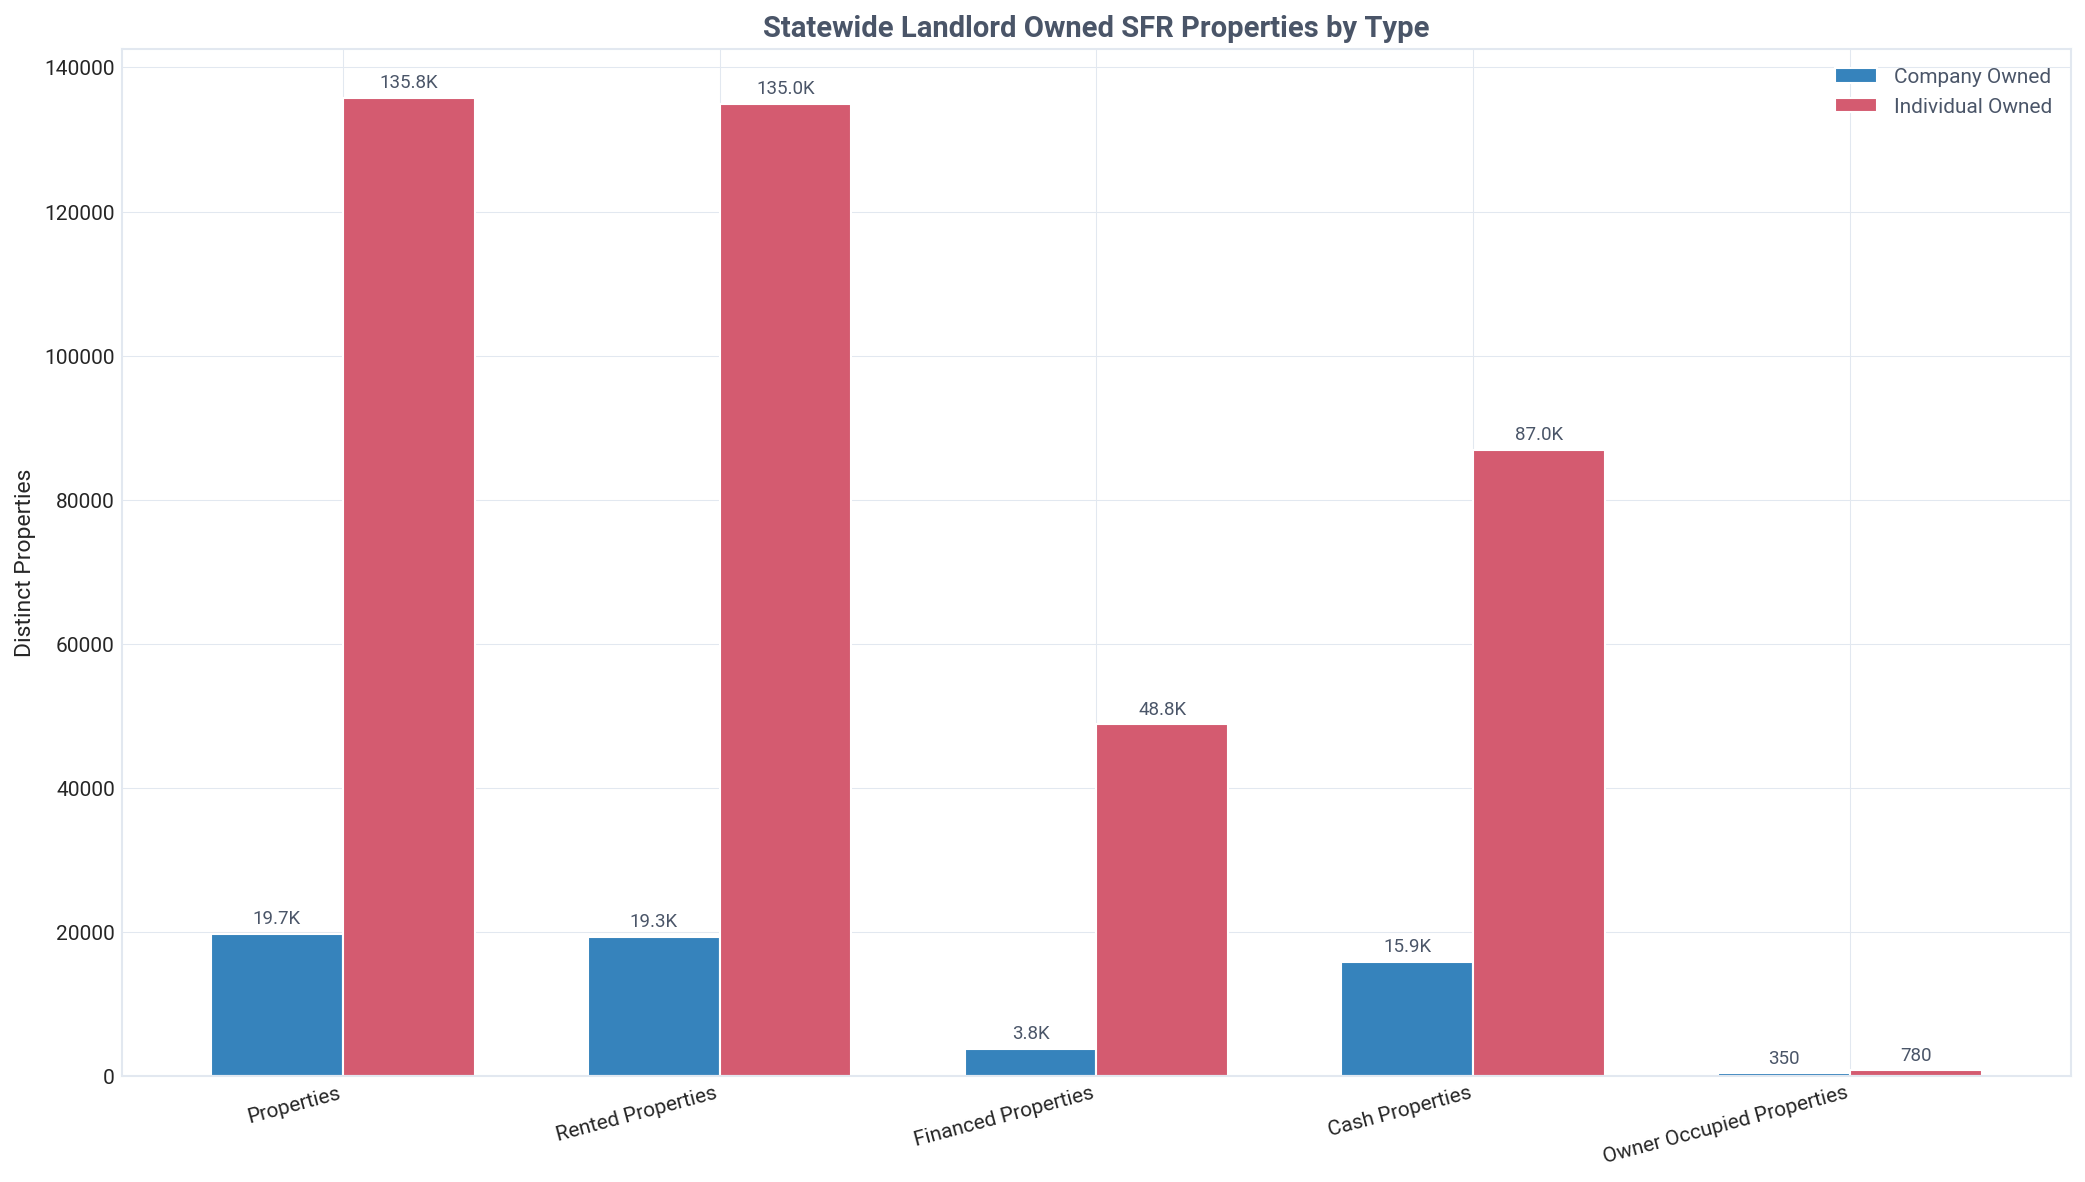
Investors own 150,332 properties in Maine, with individuals holding a dominant 90.3% share.
Of these holdings, 98,506 properties (65.5%) are owned free-and-clear with cash, compared to 51,826 that are financed. The portfolio is highly rental-focused, with 149,209 properties (99.2%) classified as non-owner-occupied.
Landlord vs Traditional Homeowners
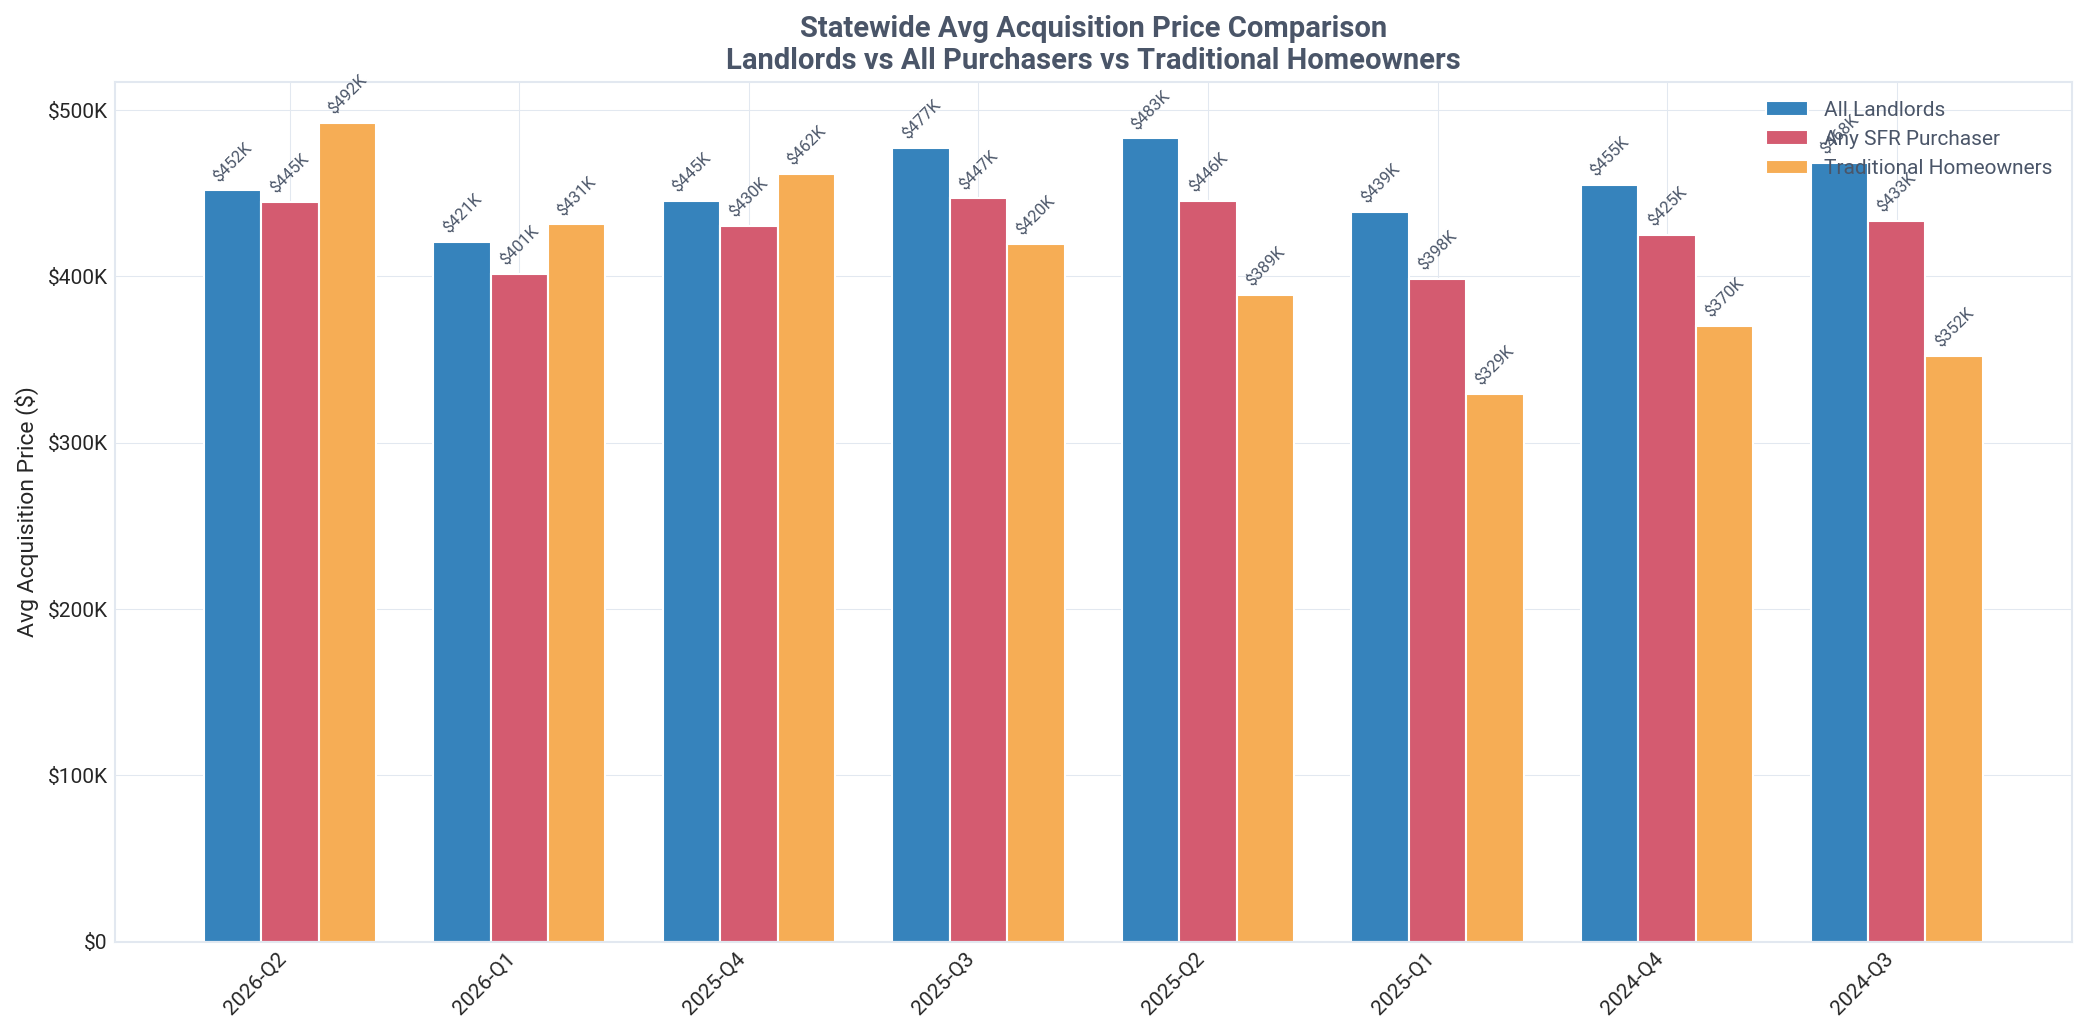
Landlords paid 8.3% less than homeowners in Q2 2026, a discount of $40,708 per property.
This price gap has widened significantly from Q1 2026, when the discount was only 2.5% ($10,663). Interestingly, in Q3 2025 landlords paid a 13.7% premium over homeowners, showing significant volatility in purchasing strategy.
Current Quarter Purchases
Investors captured an immense 59.6% share of all Maine home purchases in Q2 2026.
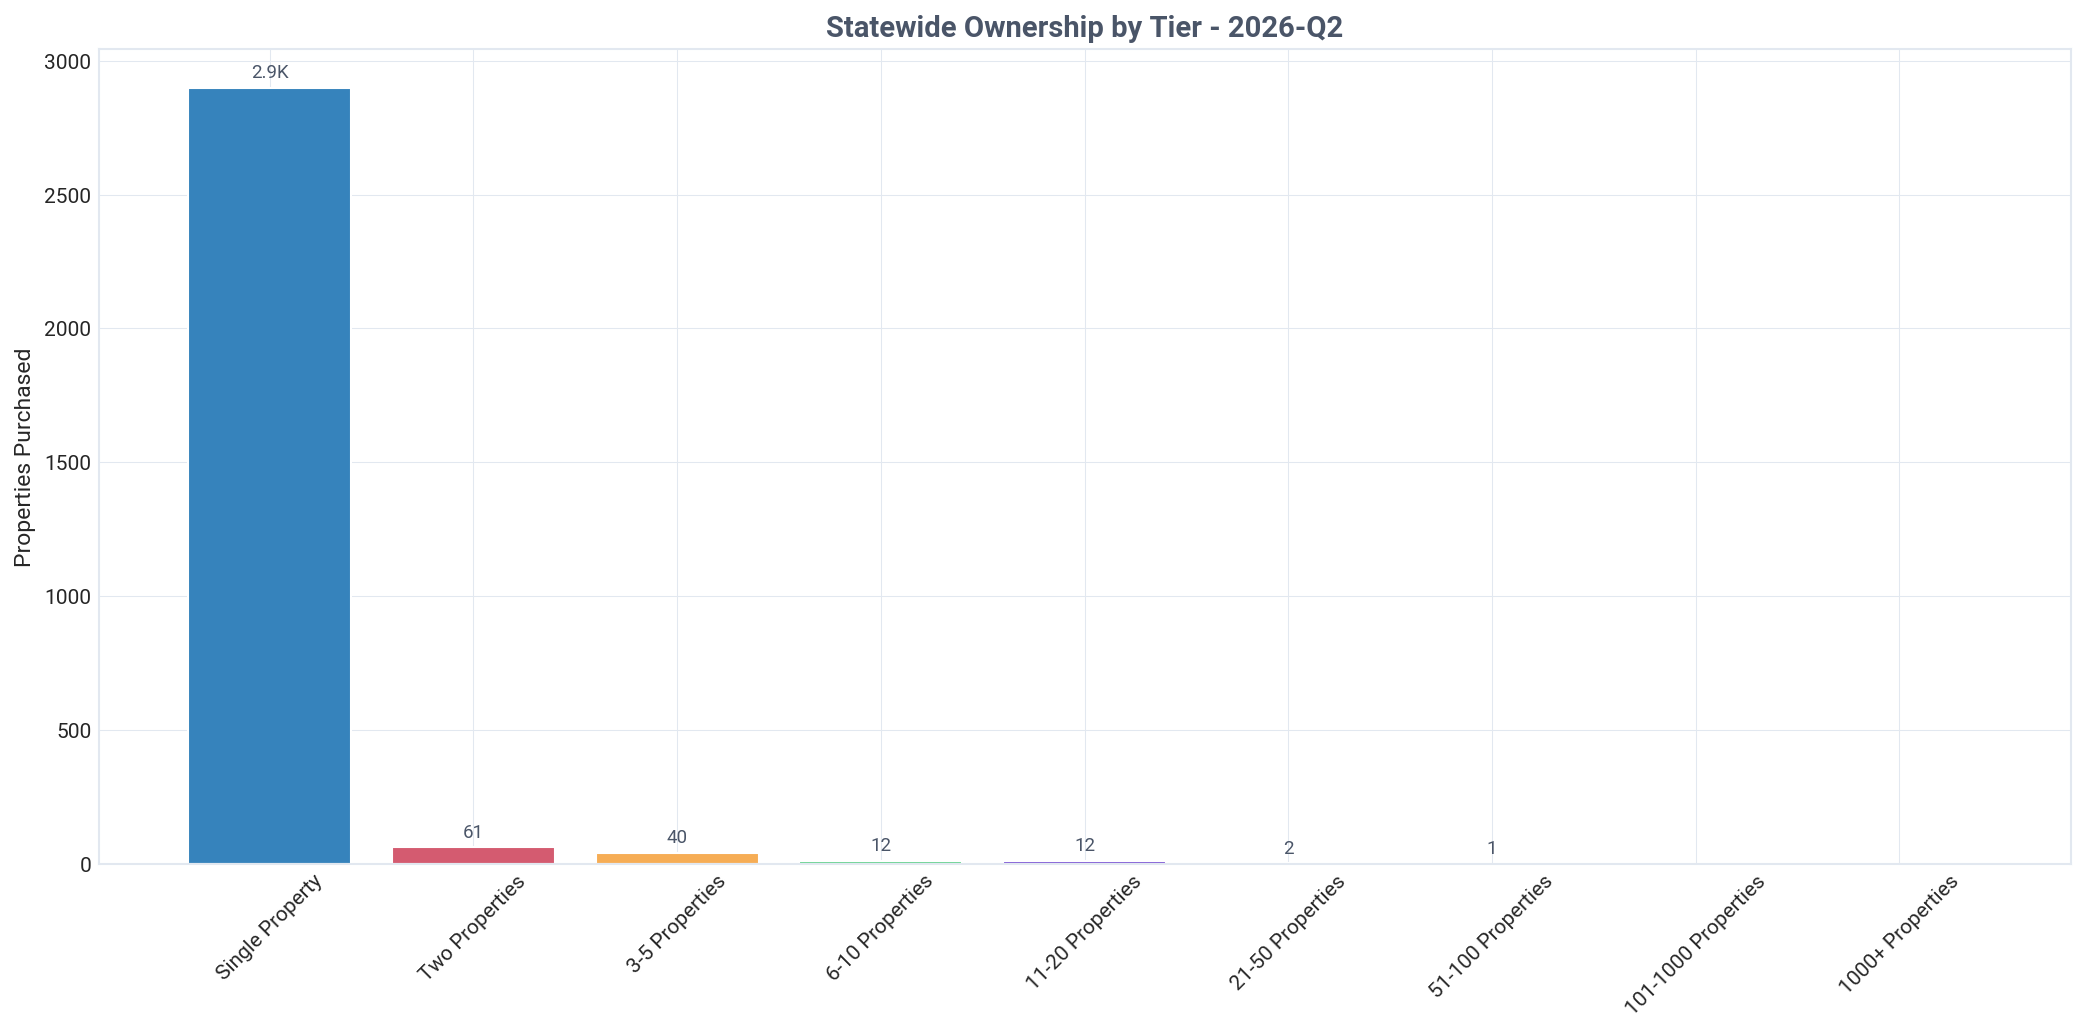
Mom-and-pop landlords (1-10 properties) were responsible for 99.5% of these investor purchases. In contrast, institutional investors with over 1,000 properties made zero acquisitions during the quarter.
Ownership by Tier
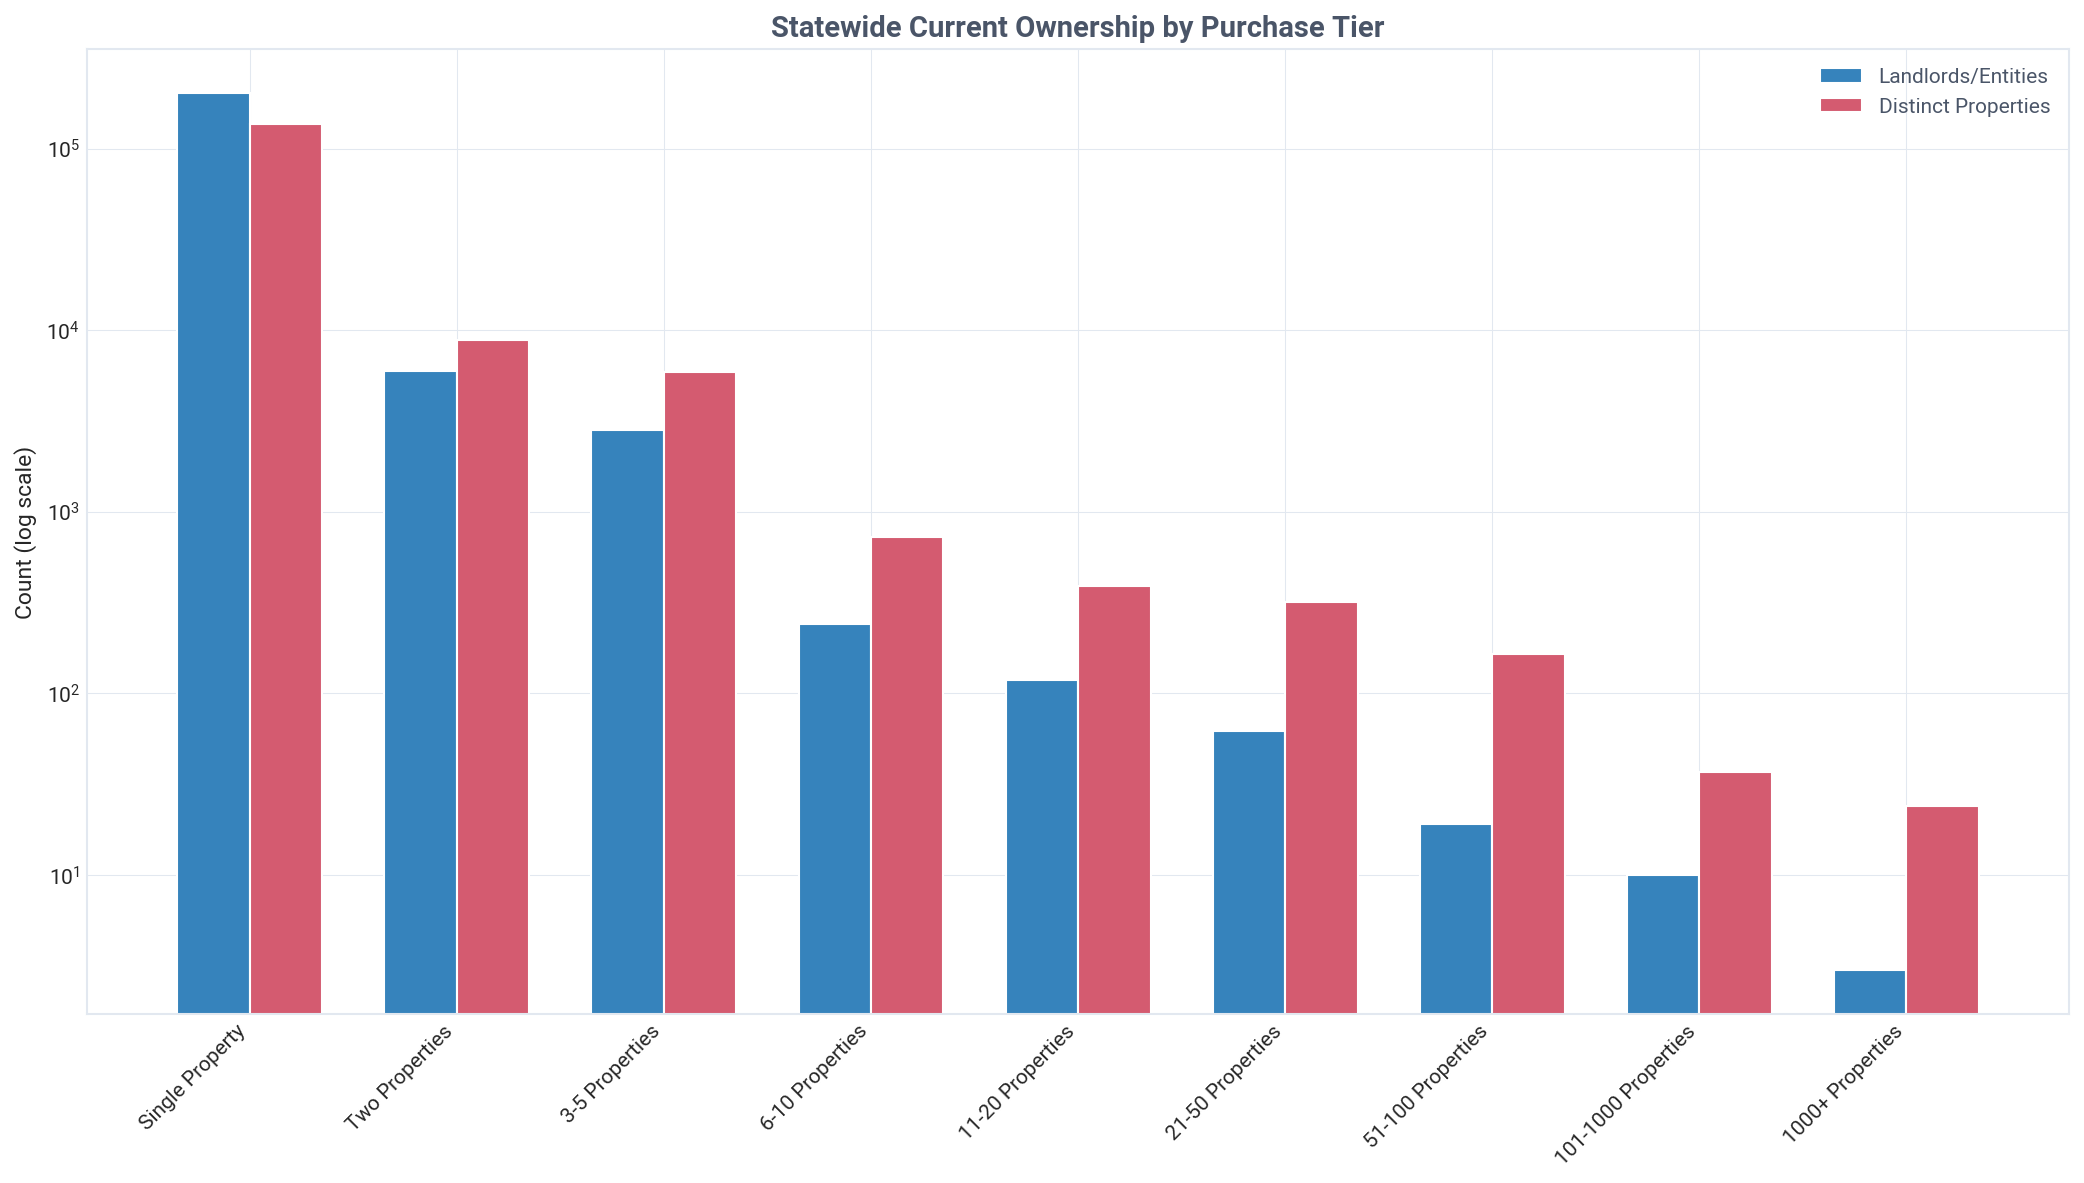
Mom-and-pop landlords (1-10 properties) overwhelmingly control 99.4% of Maine's investor-owned SFRs.
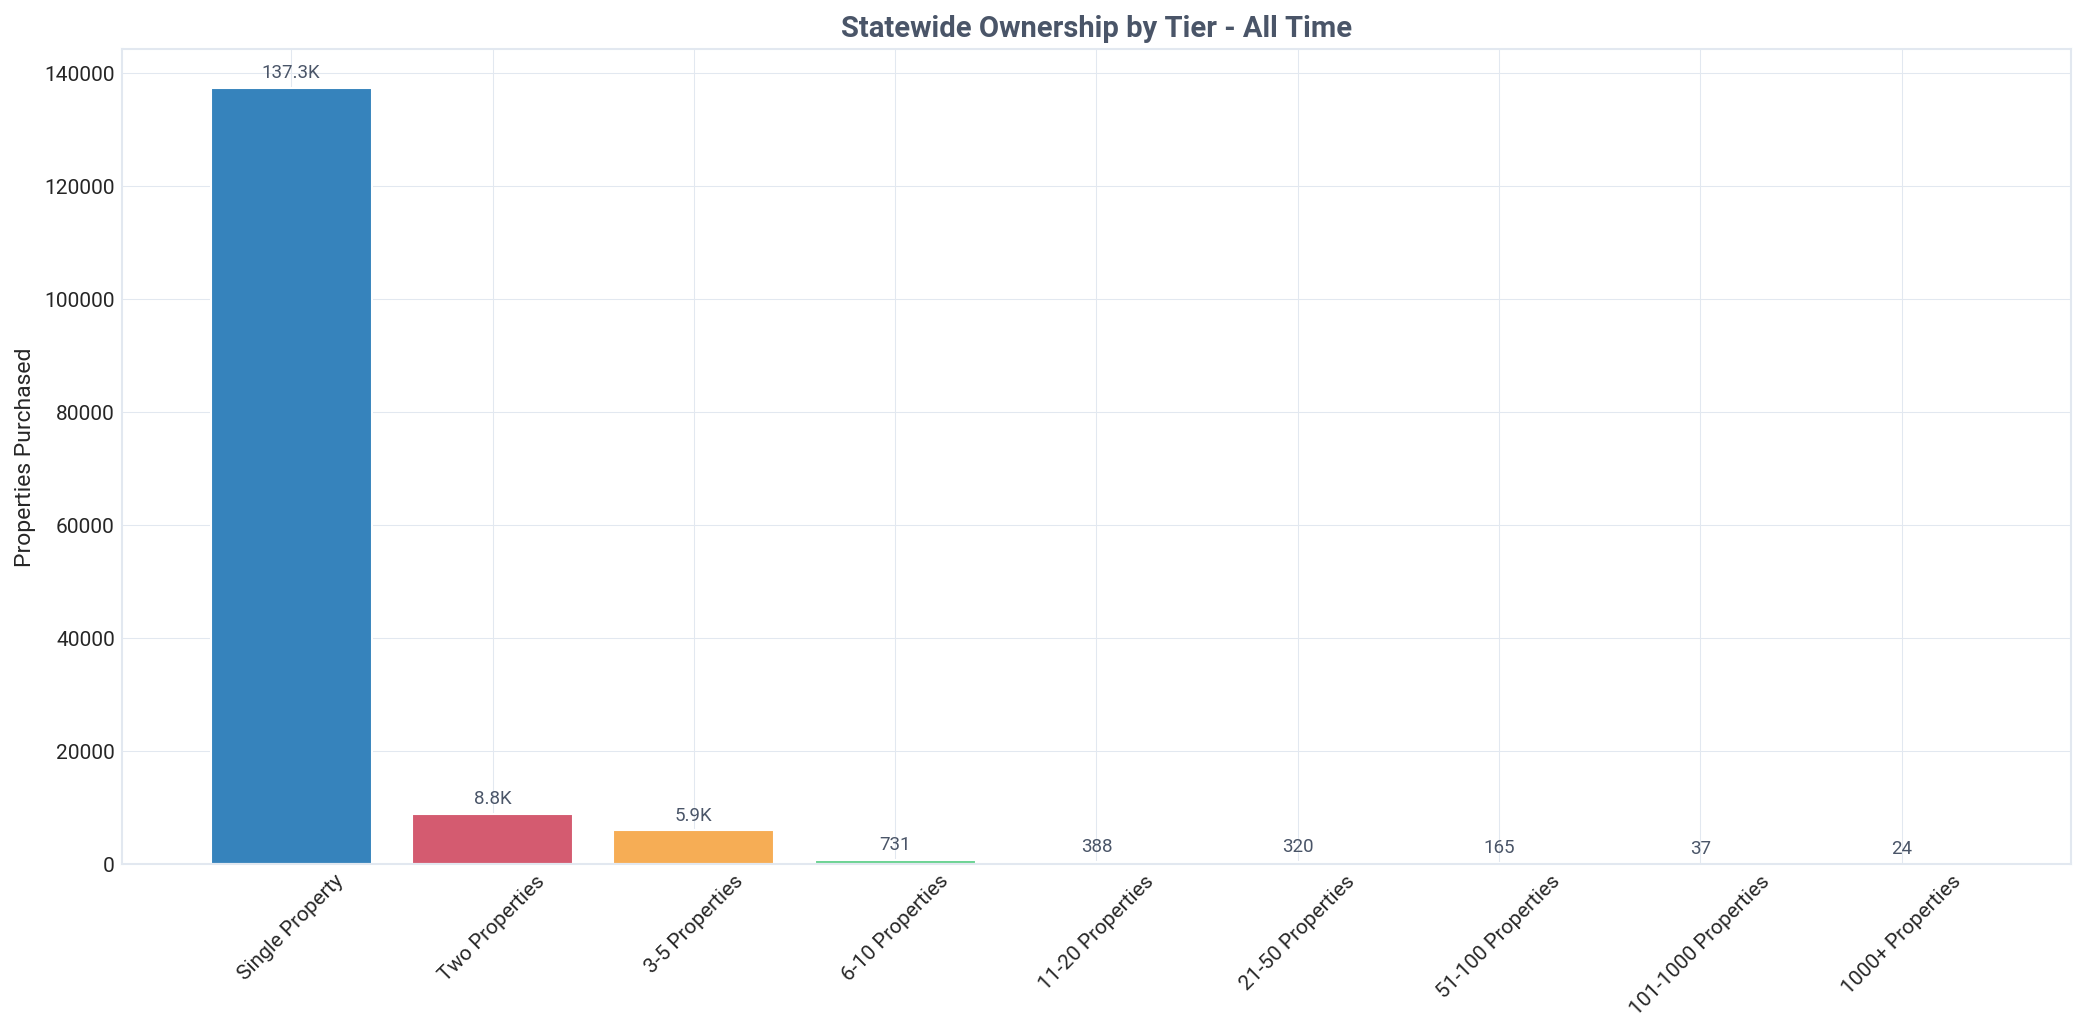
Institutional investors with 1,000+ properties have a negligible presence, owning just 24 properties, which rounds to 0.0% of the market. The single-property tier alone accounts for 89.3% of all investor-owned homes, totaling 137,336 properties.
Ownership by Tier & Type
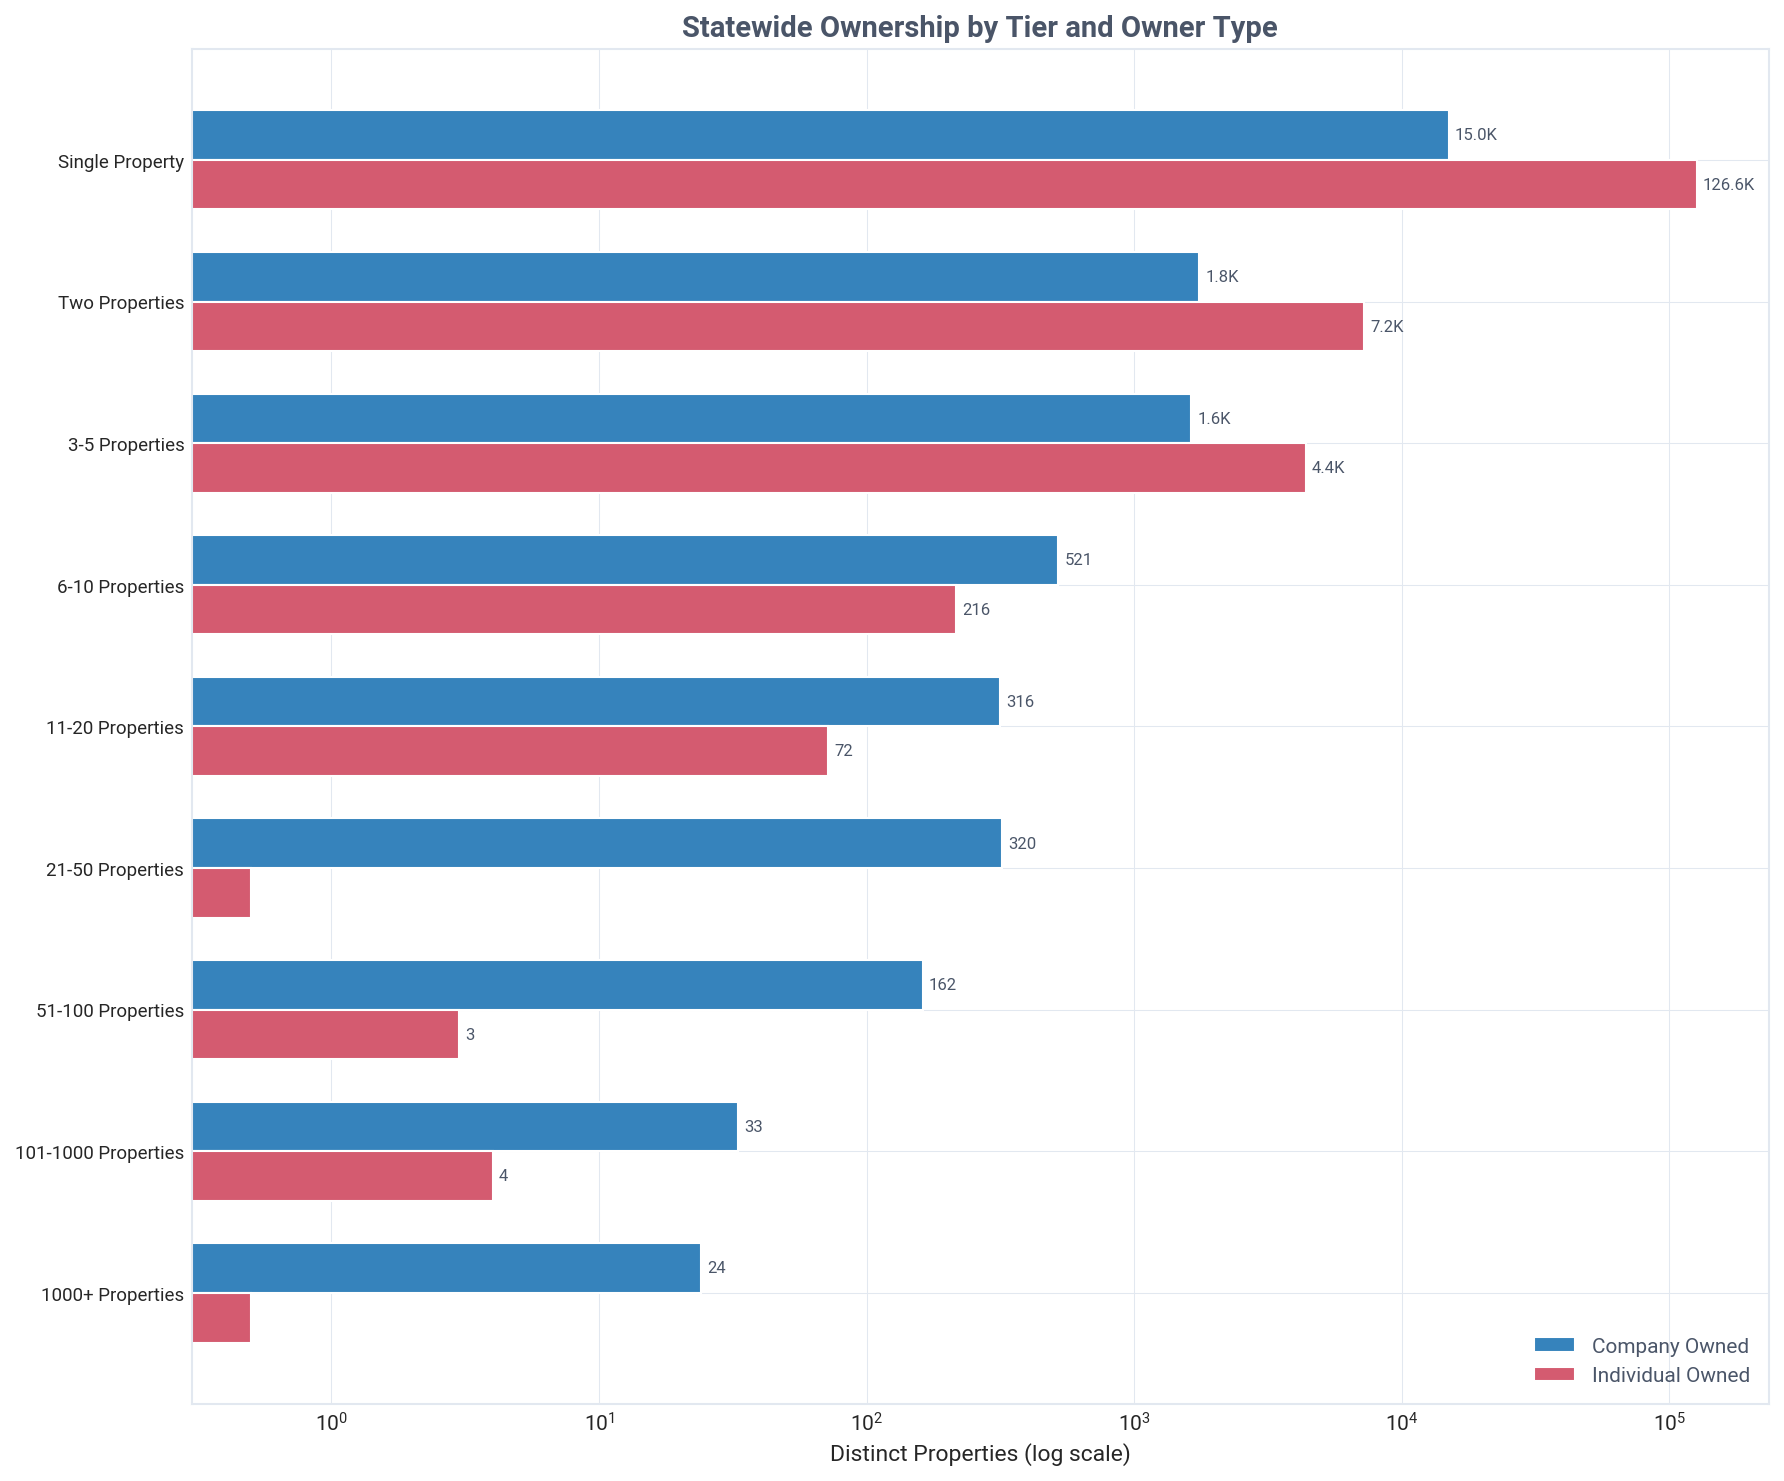
Companies become the majority owners at the 6-10 property tier, signaling a key scaling threshold.
While individuals own 89.4% of single-property portfolios, companies control 70.7% of portfolios in the 6-10 property range. This trend accelerates in larger tiers, with companies owning 98.2% of portfolios in the 51-100 property category.
Geographic Distribution
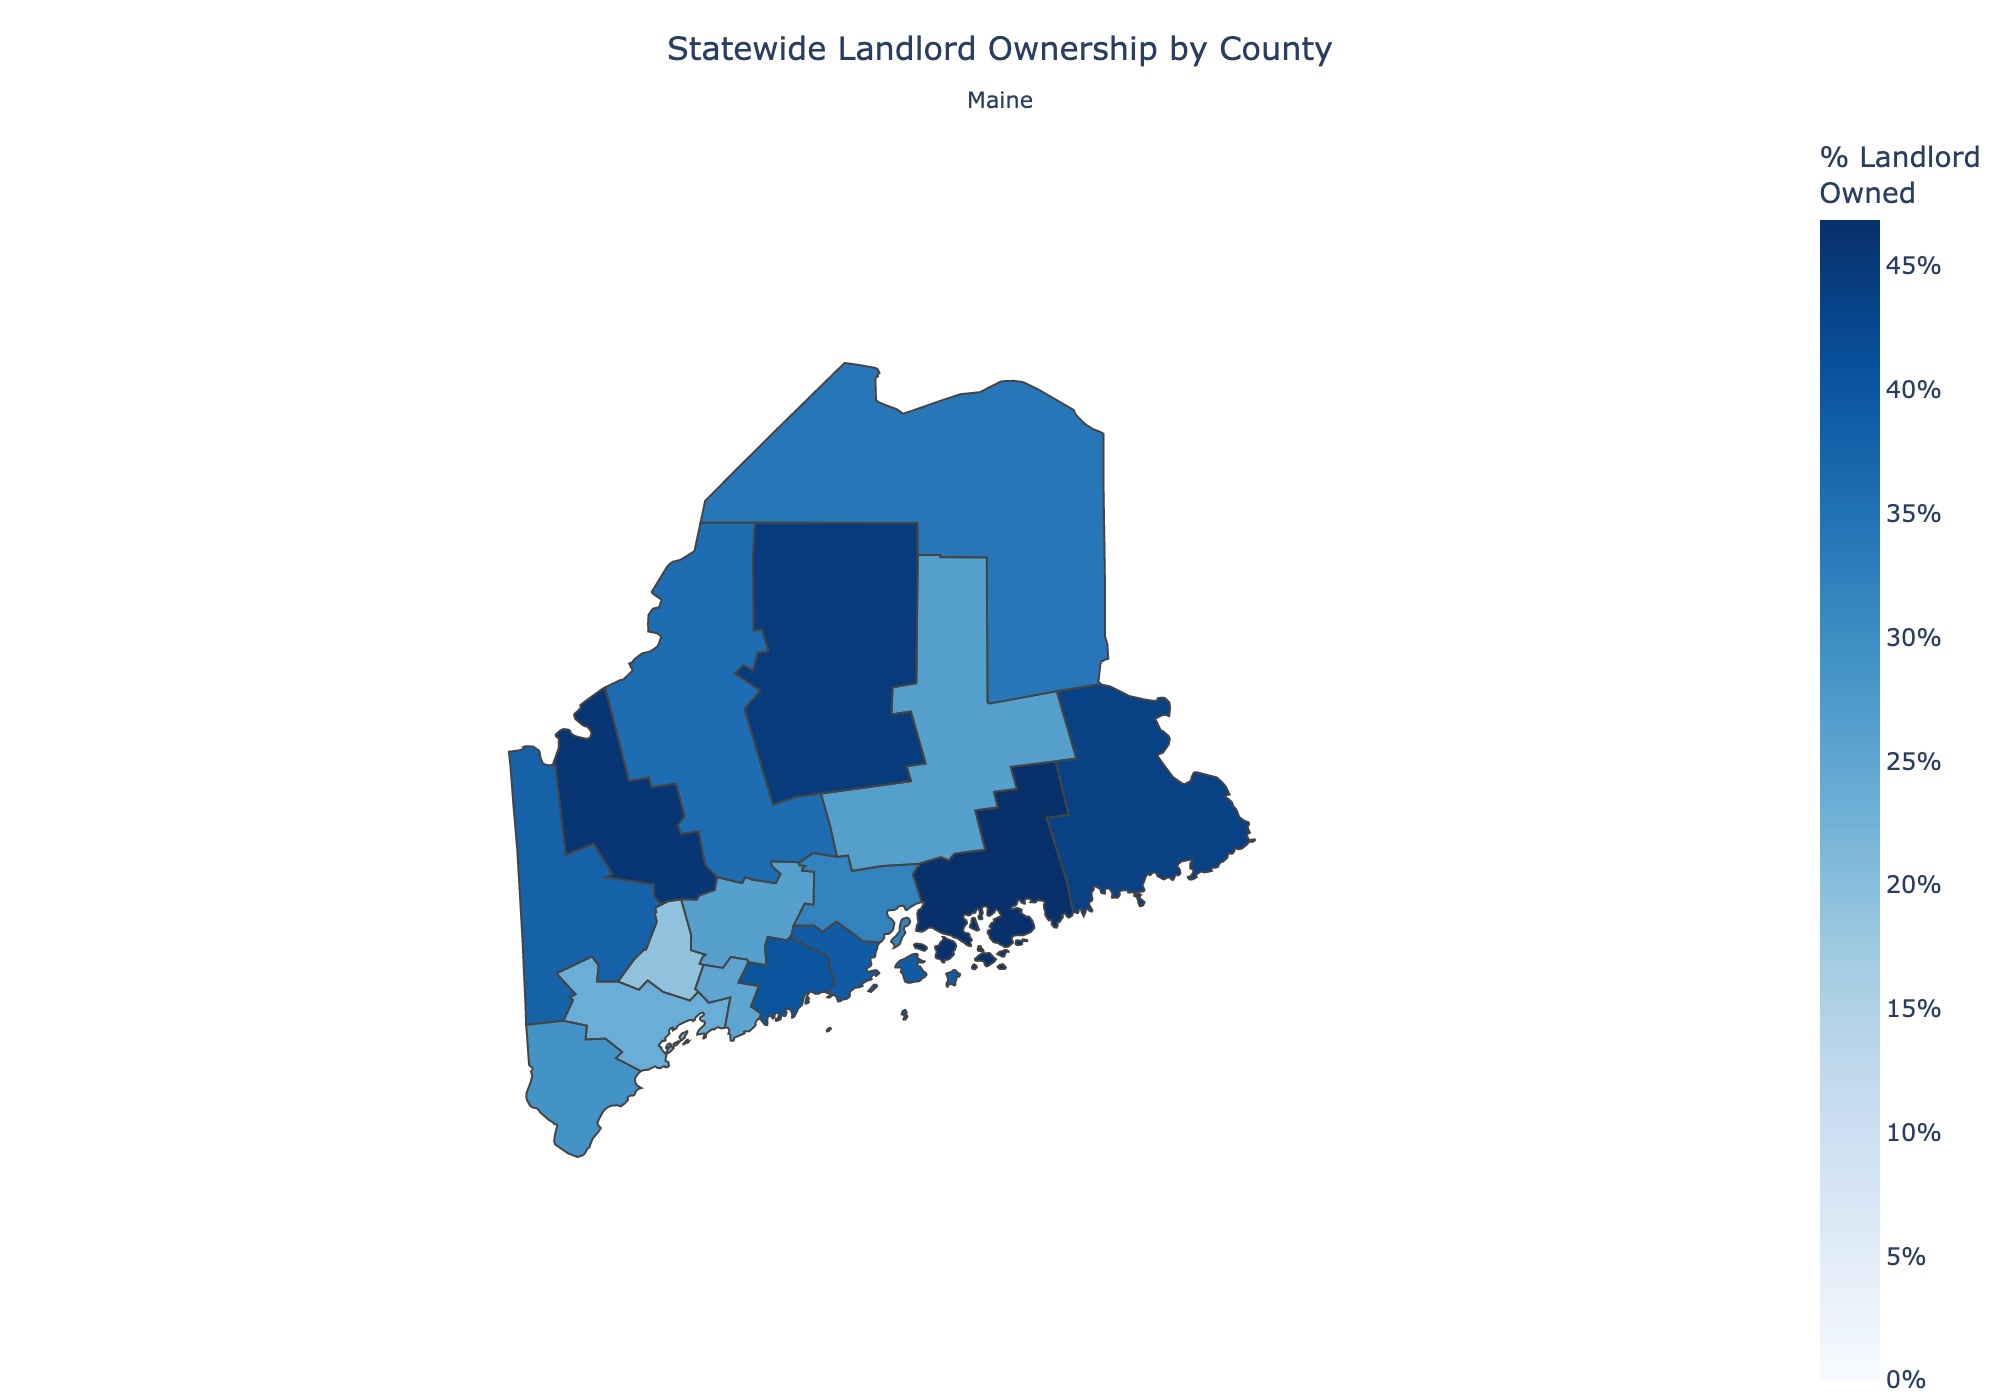
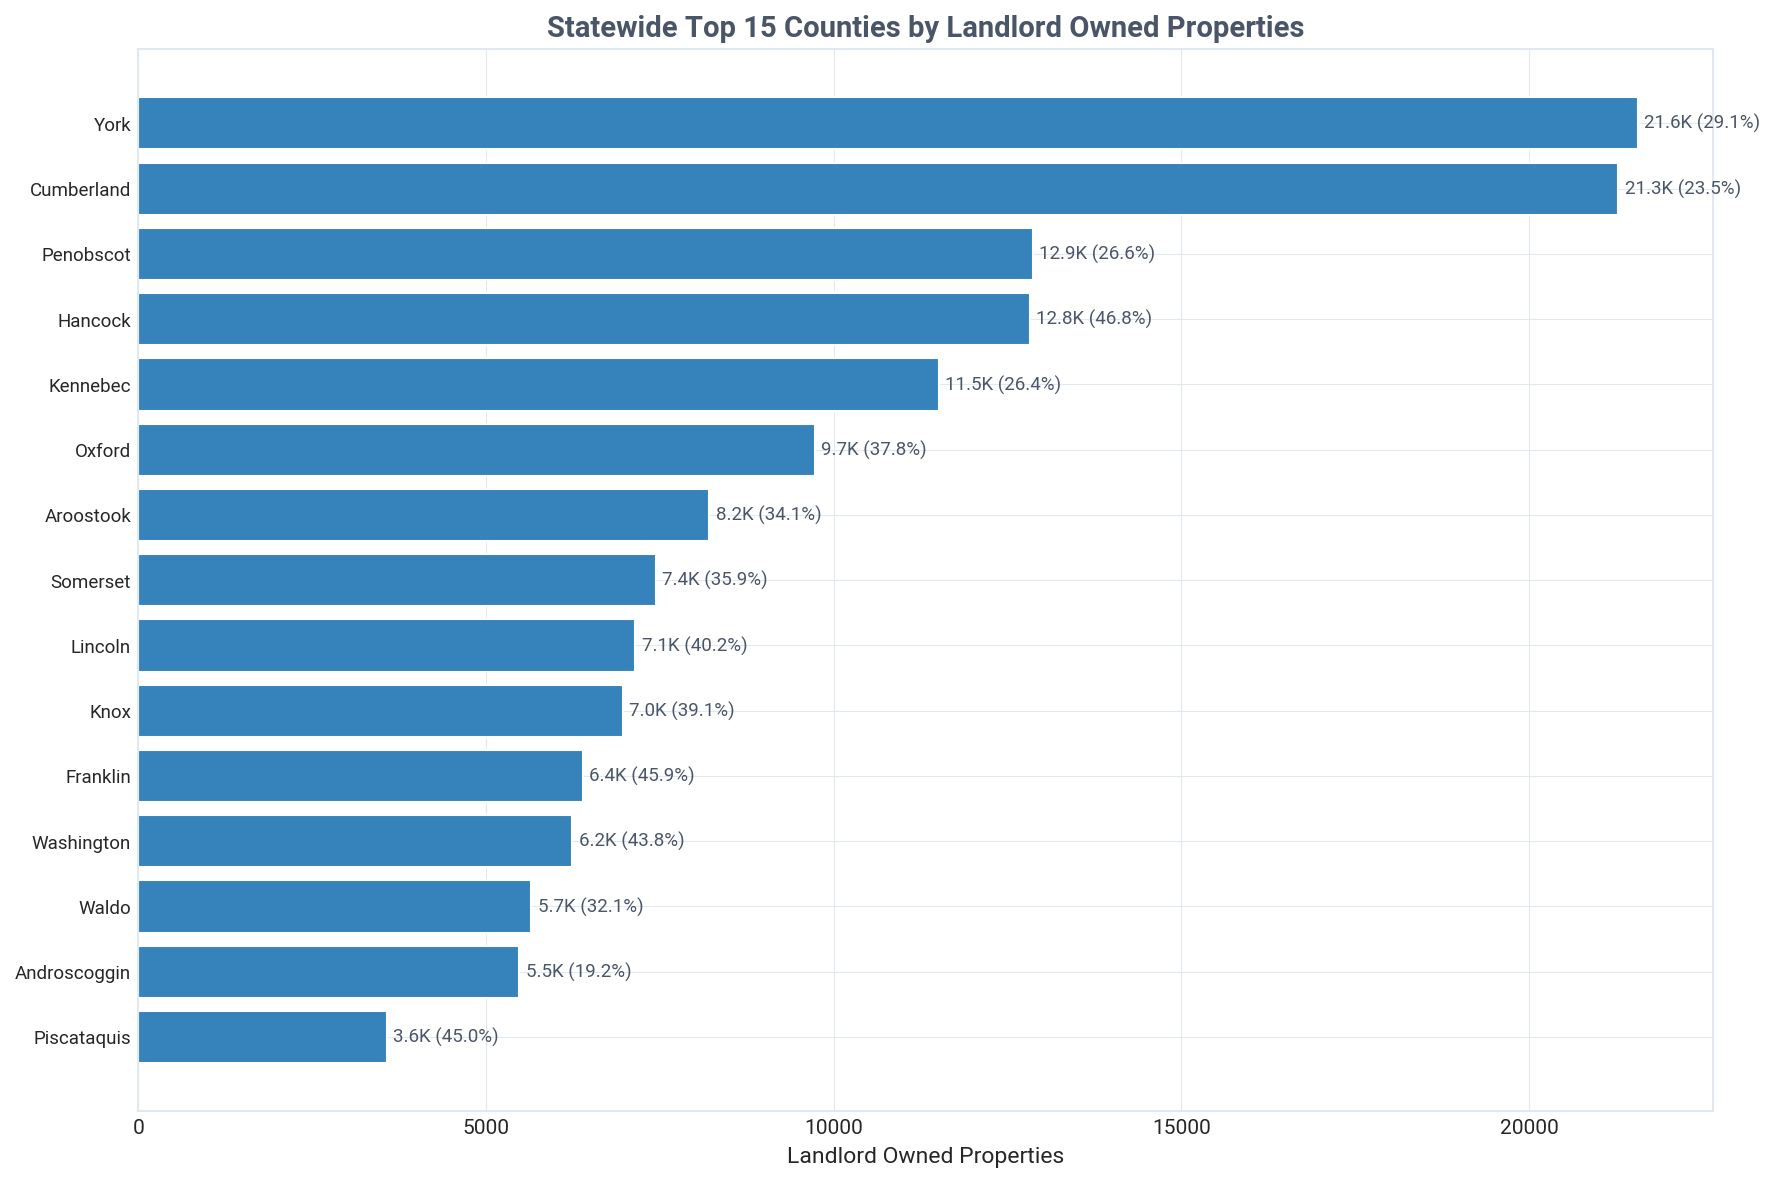
York and Cumberland counties lead investor activity with over 21,000 properties each.
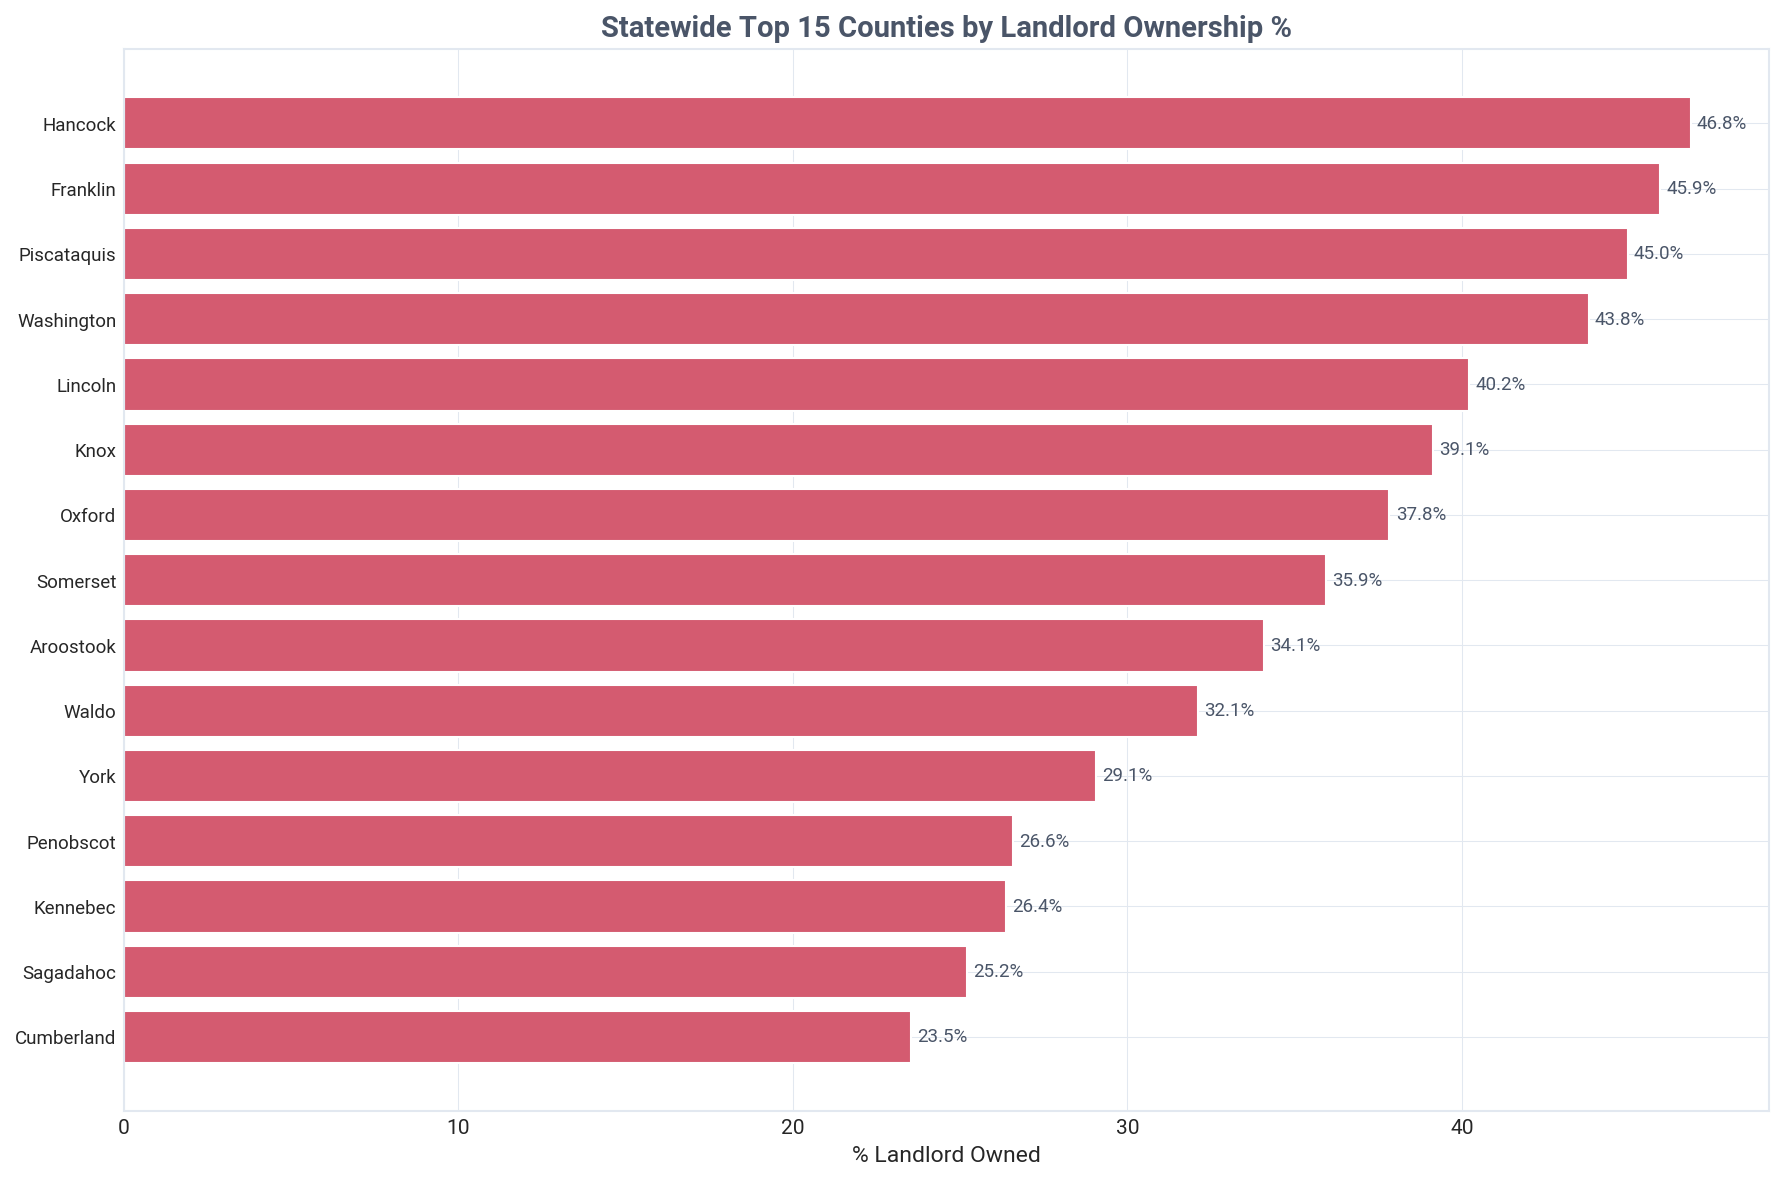
However, counties like Hancock and Franklin have the highest investor penetration rates at 46.8% and 45.9%, respectively. This indicates a split between high-volume urban centers and high-concentration rural or vacation areas.
Historical Transactions
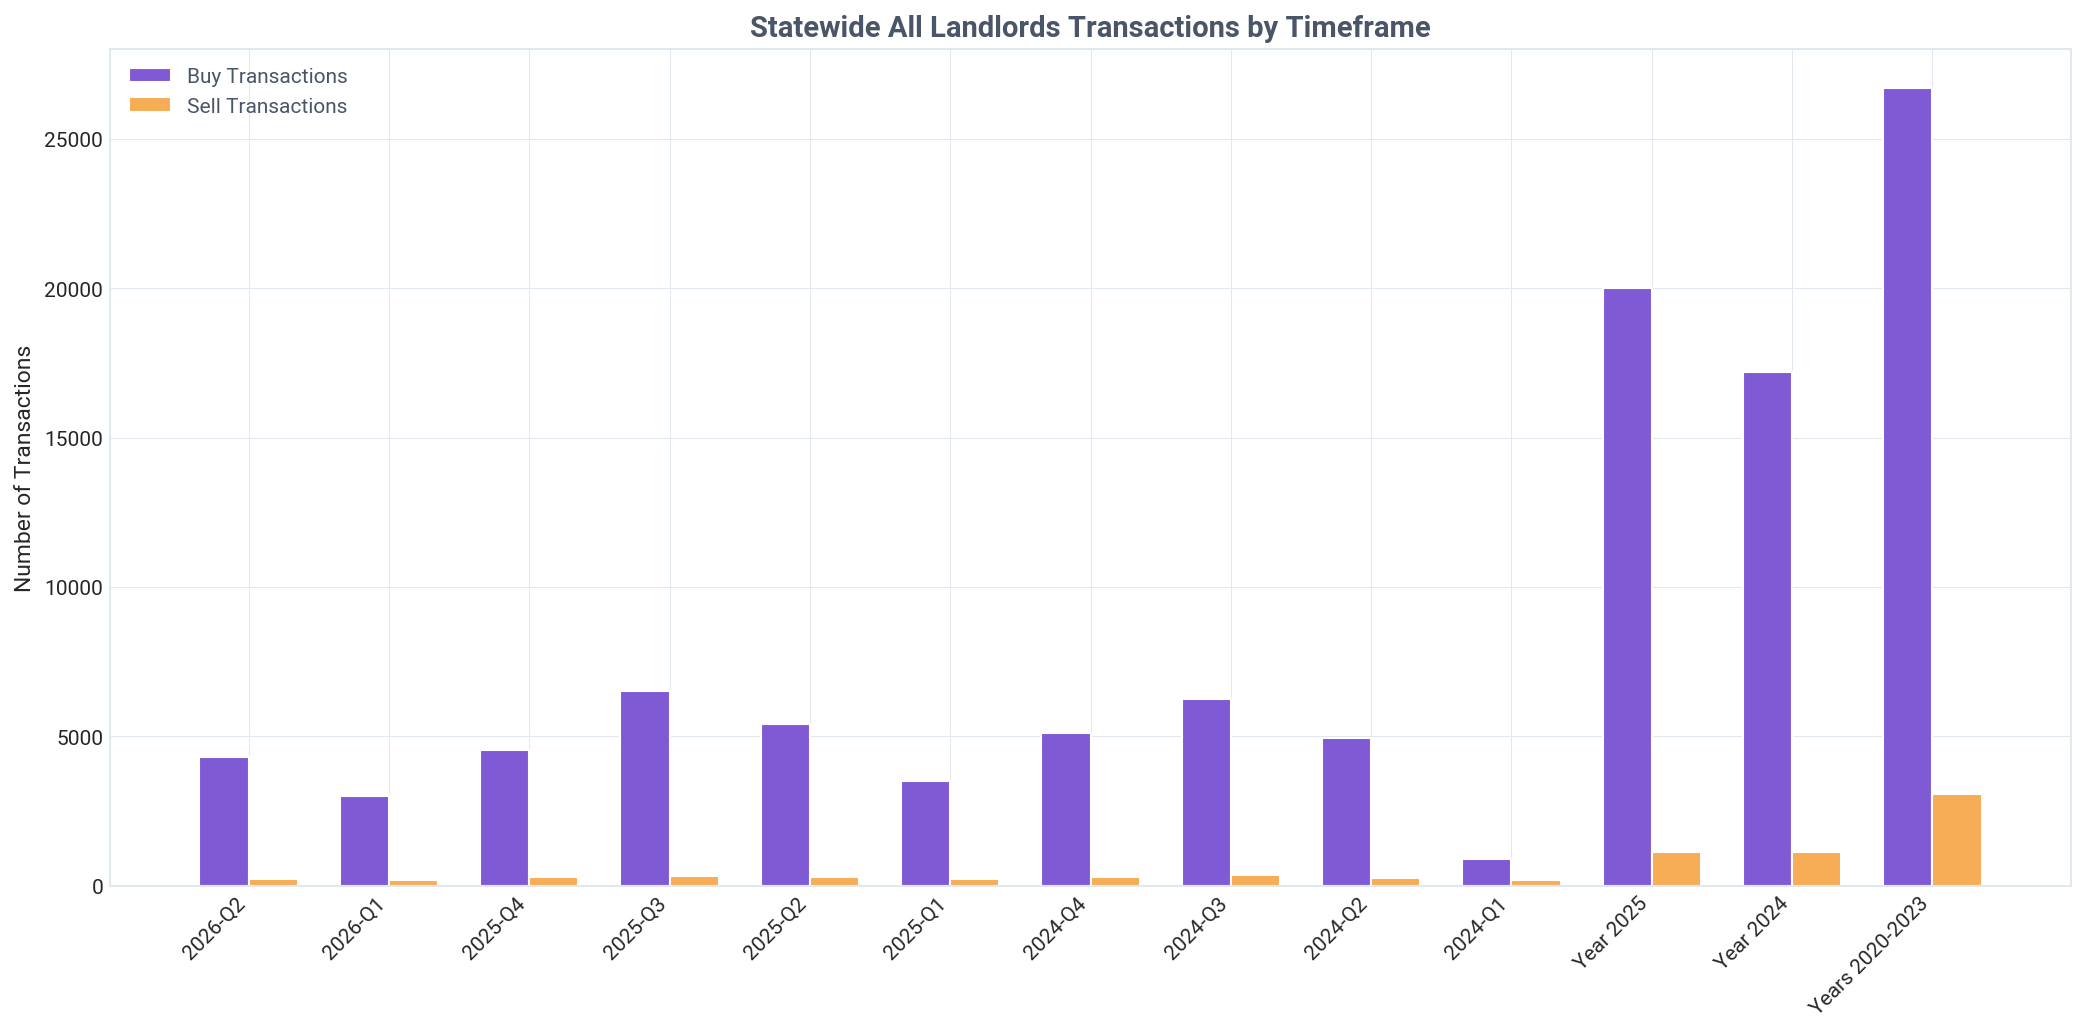
Maine landlords are aggressive net buyers, acquiring 18 properties for every one they sold in Q2 2026.
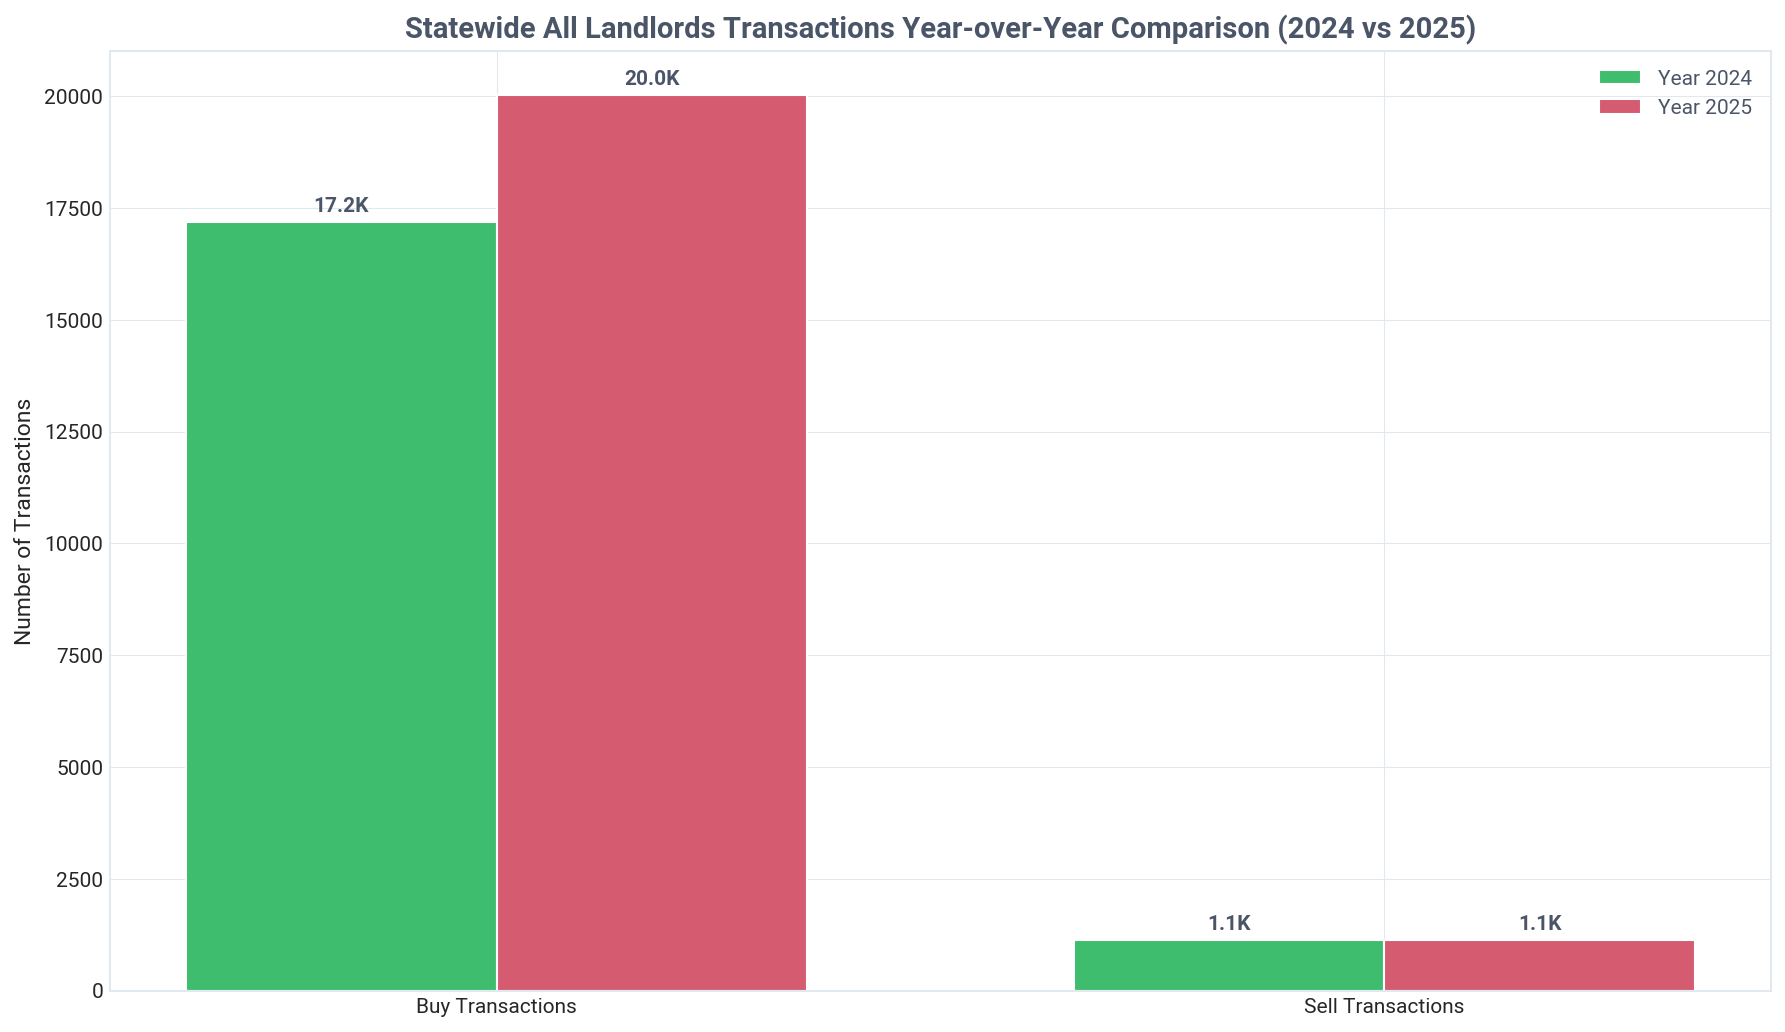
This trend has been consistent, with landlords purchasing 20,016 properties in 2025 while selling only 1,141. Institutional investors, despite low volume, have also been net buyers, adding a handful of properties in 2024 and 2025.
Current Quarter Transactions
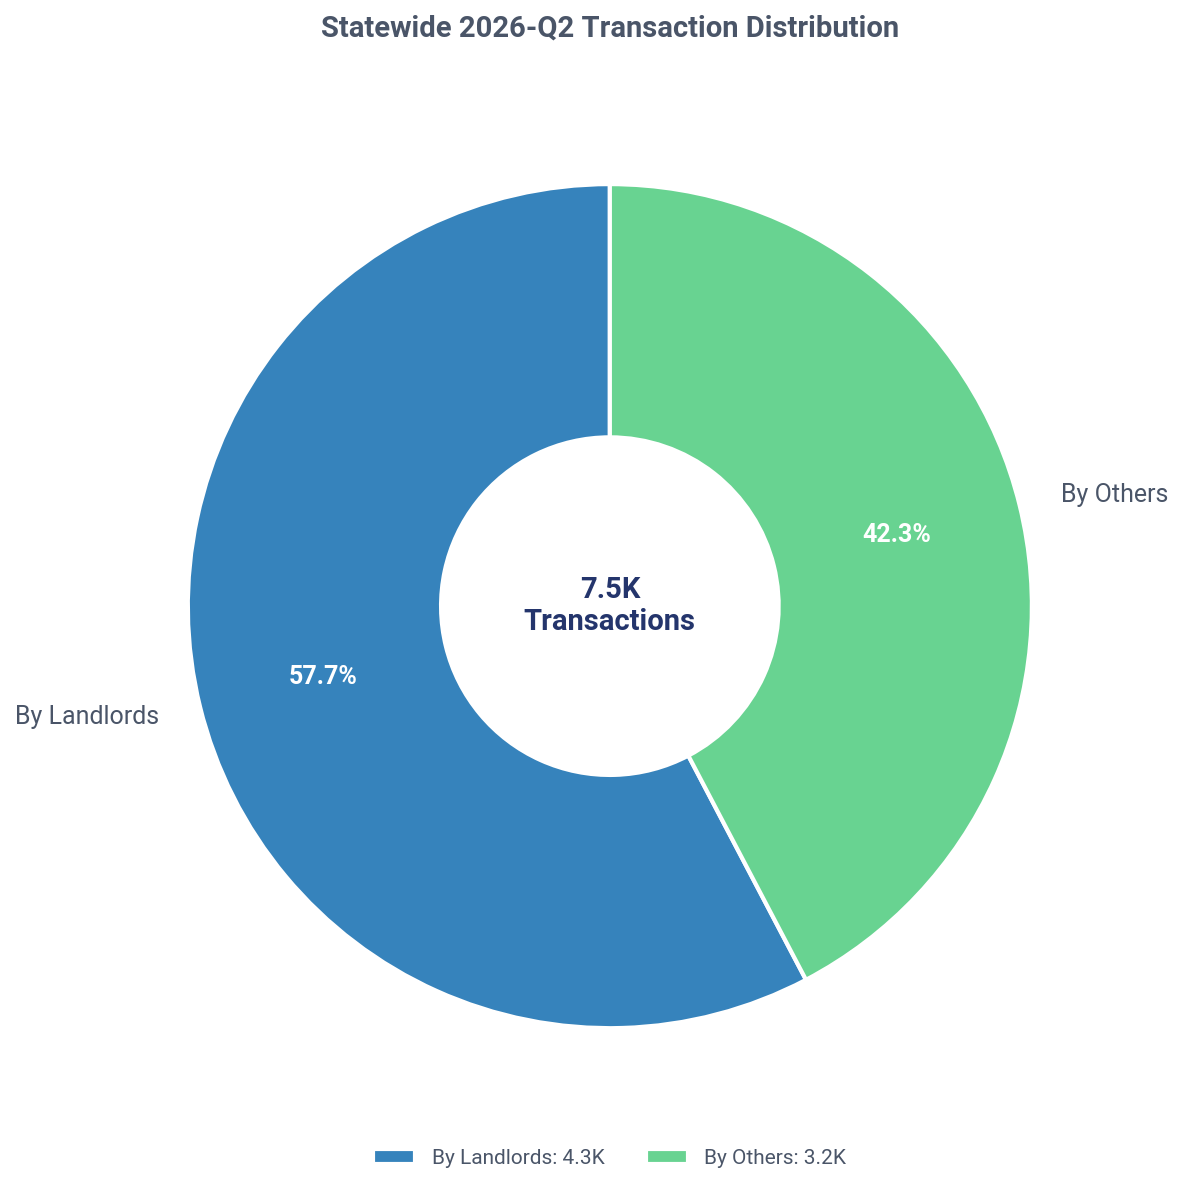
Investors were involved in 57.7% of all Maine's real estate transactions in Q2 2026.
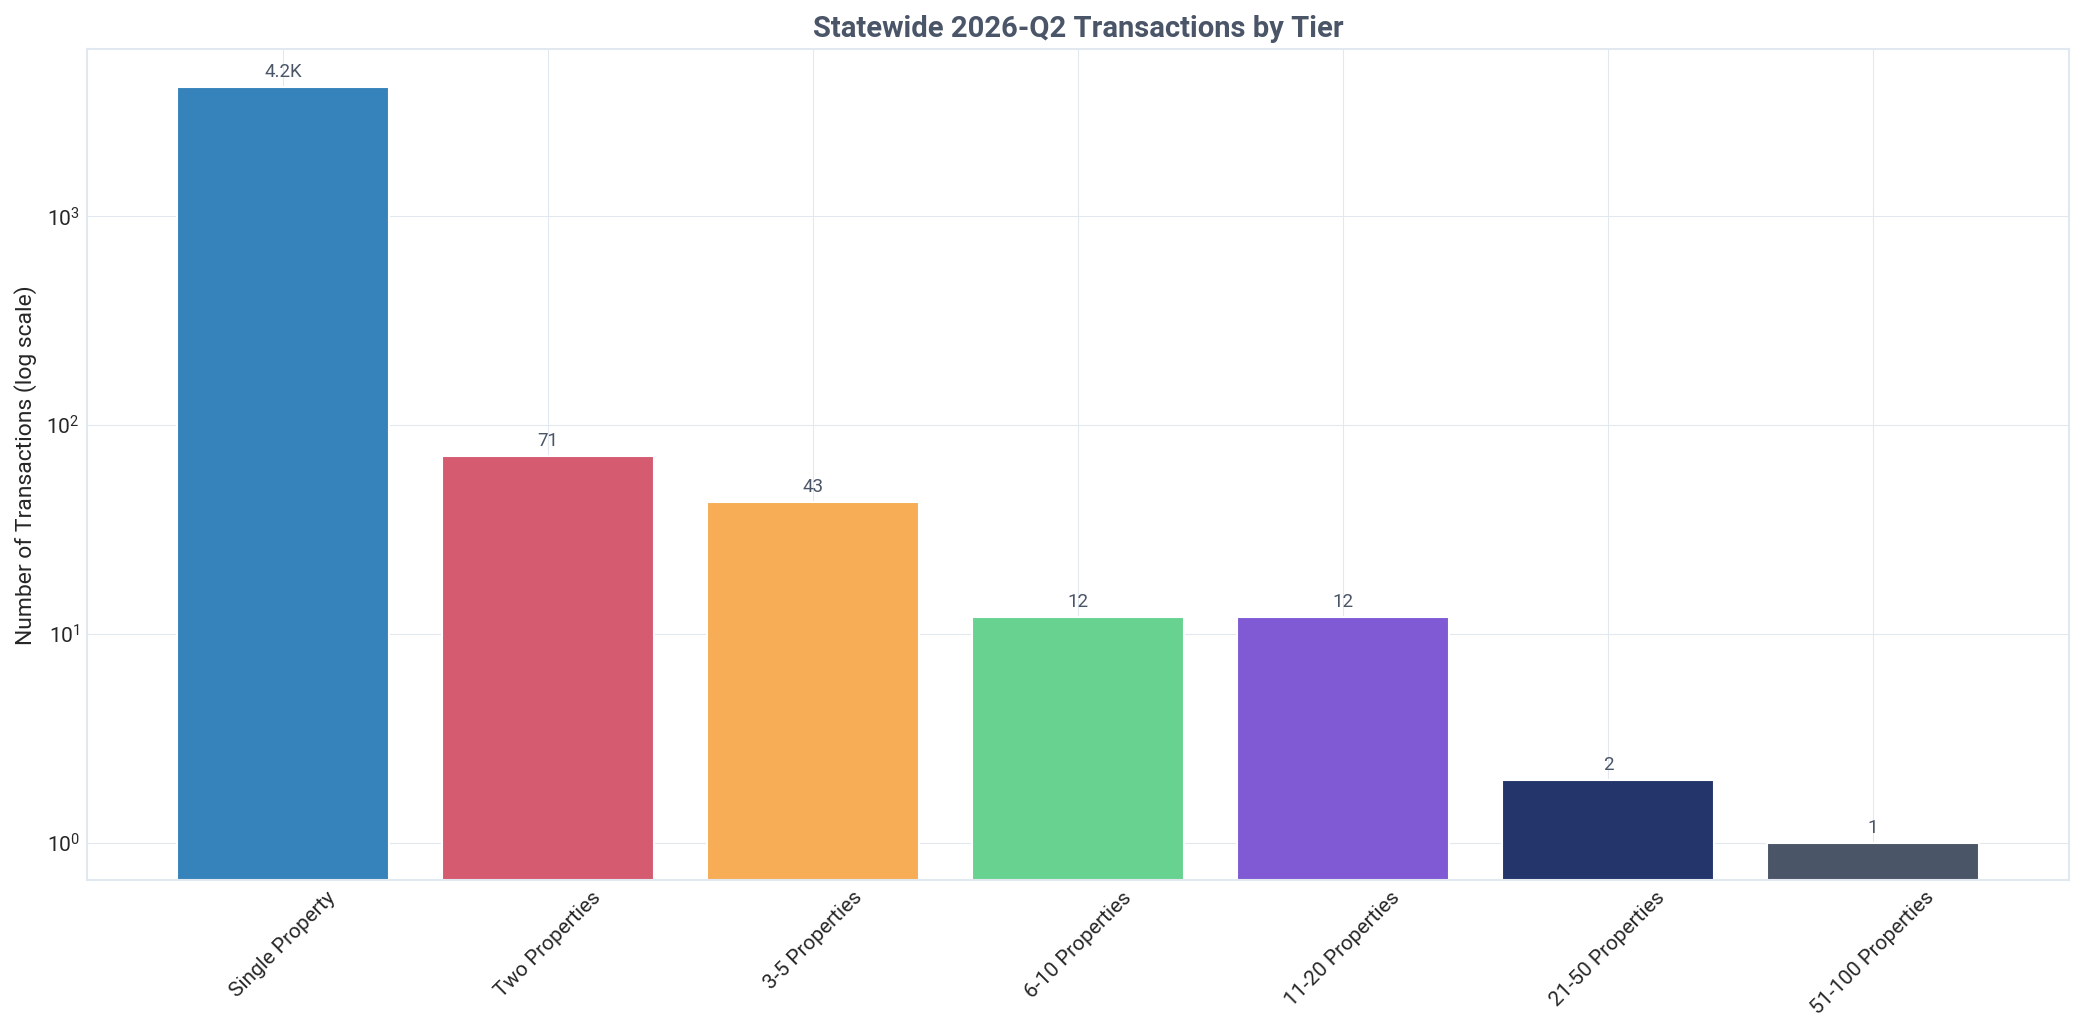
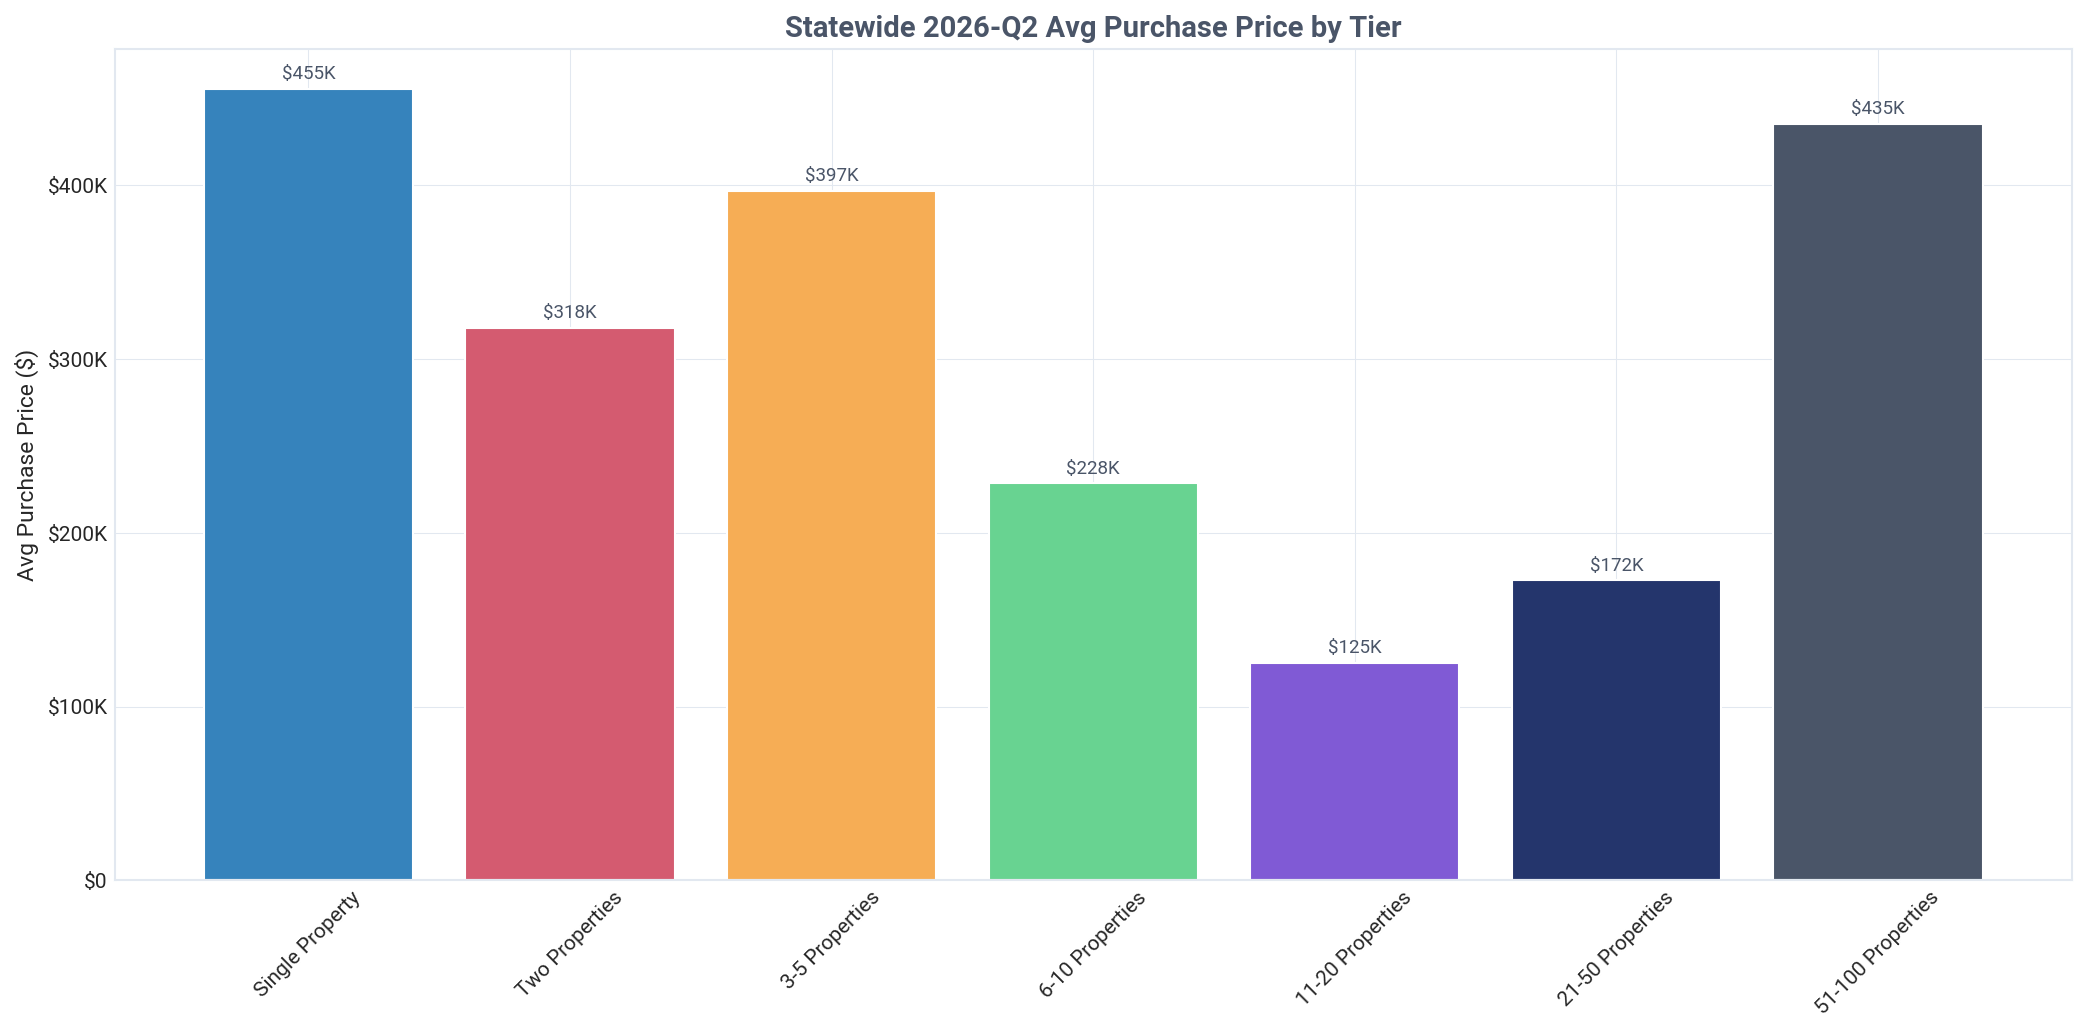
Single-property landlords dominated this activity, accounting for 4,160 transactions and paying the highest average price at $455,287. Inter-landlord trading was minimal, with only 5.0% of purchases by this top tier coming from other landlords.

Want deeper insights tailored to your investment strategy?

TALK TO AN EXPERT

Current Holdings Portfolio

Analysis of landlord property holdings by type, financing method, and owner category

Maine: landlord SFR holdings by type, Q2 2026
Key Insight
Investors own 150,332 properties in Maine, with individuals holding a dominant 90.3% share.
Detailed Findings

In Maine, the real estate investing landscape is defined by its breadth, with 212,287 distinct landlords owning 150,332 single-family residential properties. This represents a significant 30.9% of the state's total 486,154 SFR homes, indicating a deep integration of rental properties into the housing market.

Individual investors are the backbone of this market, holding 135,771 properties, which accounts for a commanding 90.3% of the entire investor-owned portfolio. In contrast, company-owned properties number just 19,666, or 13.1% of the total, underscoring a market structure built on small-scale ownership rather than large corporate landlords.

The investor portfolio is heavily skewed towards outright ownership, with 98,506 properties (65.5%) held with cash versus 51,826 (34.5%) that are financed. This suggests a mature and well-capitalized investor base that is less reliant on leverage compared to other markets. Such detailed ownership and financial characteristics can be uncovered using comprehensive assessor data.

Nearly the entire investor-owned portfolio is dedicated to rentals. A total of 149,209 properties are non-owner-occupied, which is 99.2% of all investor holdings. This high percentage confirms that the vast majority of these properties serve as rental housing for the community, rather than being held for other purposes like seasonal use or speculative vacancy.

The distribution of entities further reinforces the dominance of individual owners. There are 194,852 individual landlords compared to only 17,435 company landlords. This 11-to-1 ratio of individual-to-company entities highlights that the market's activity and ownership patterns are driven by the decisions of a large number of independent operators.
Acquisition Timing & Pricing

Comparison of acquisition prices between landlords and traditional homeowners

Key Insight
Landlords paid 8.3% less than homeowners in Q2 2026, a discount of $40,708 per property.
Detailed Findings

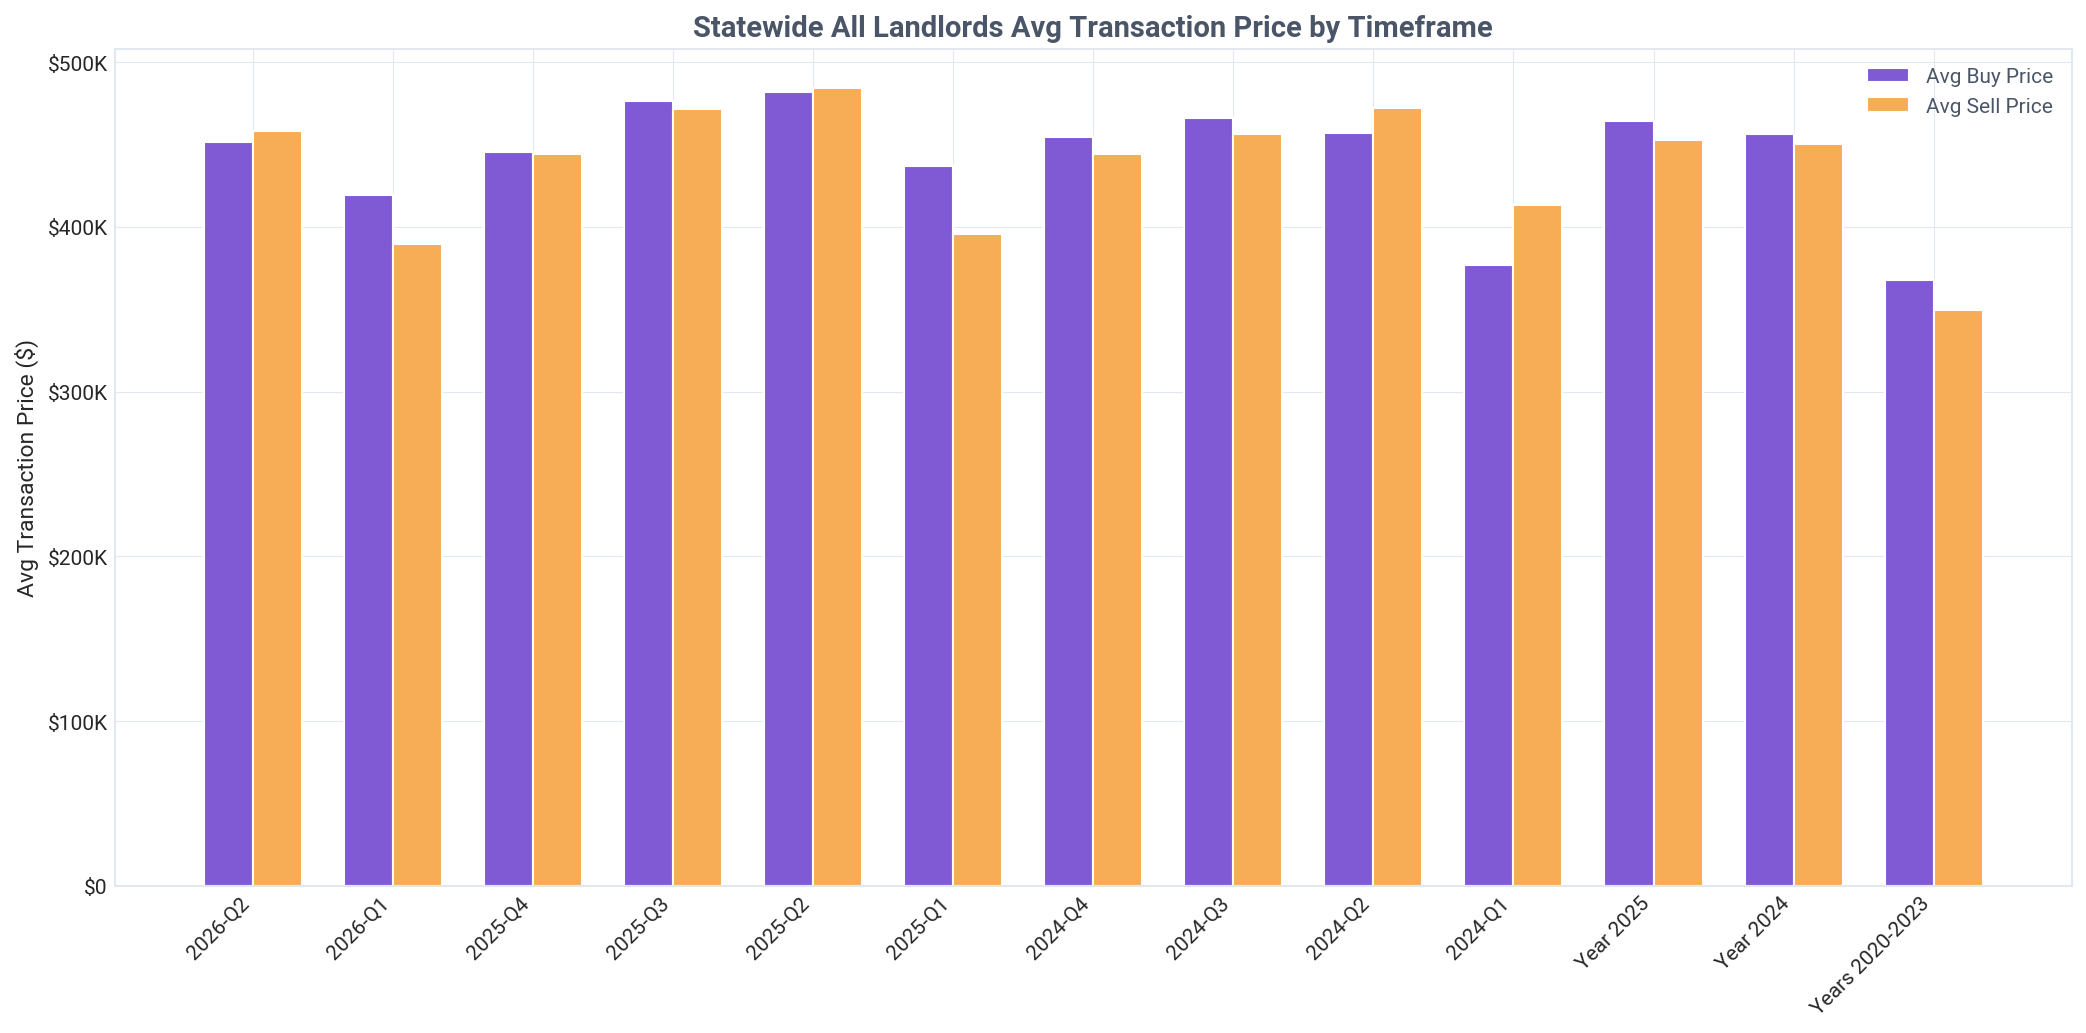
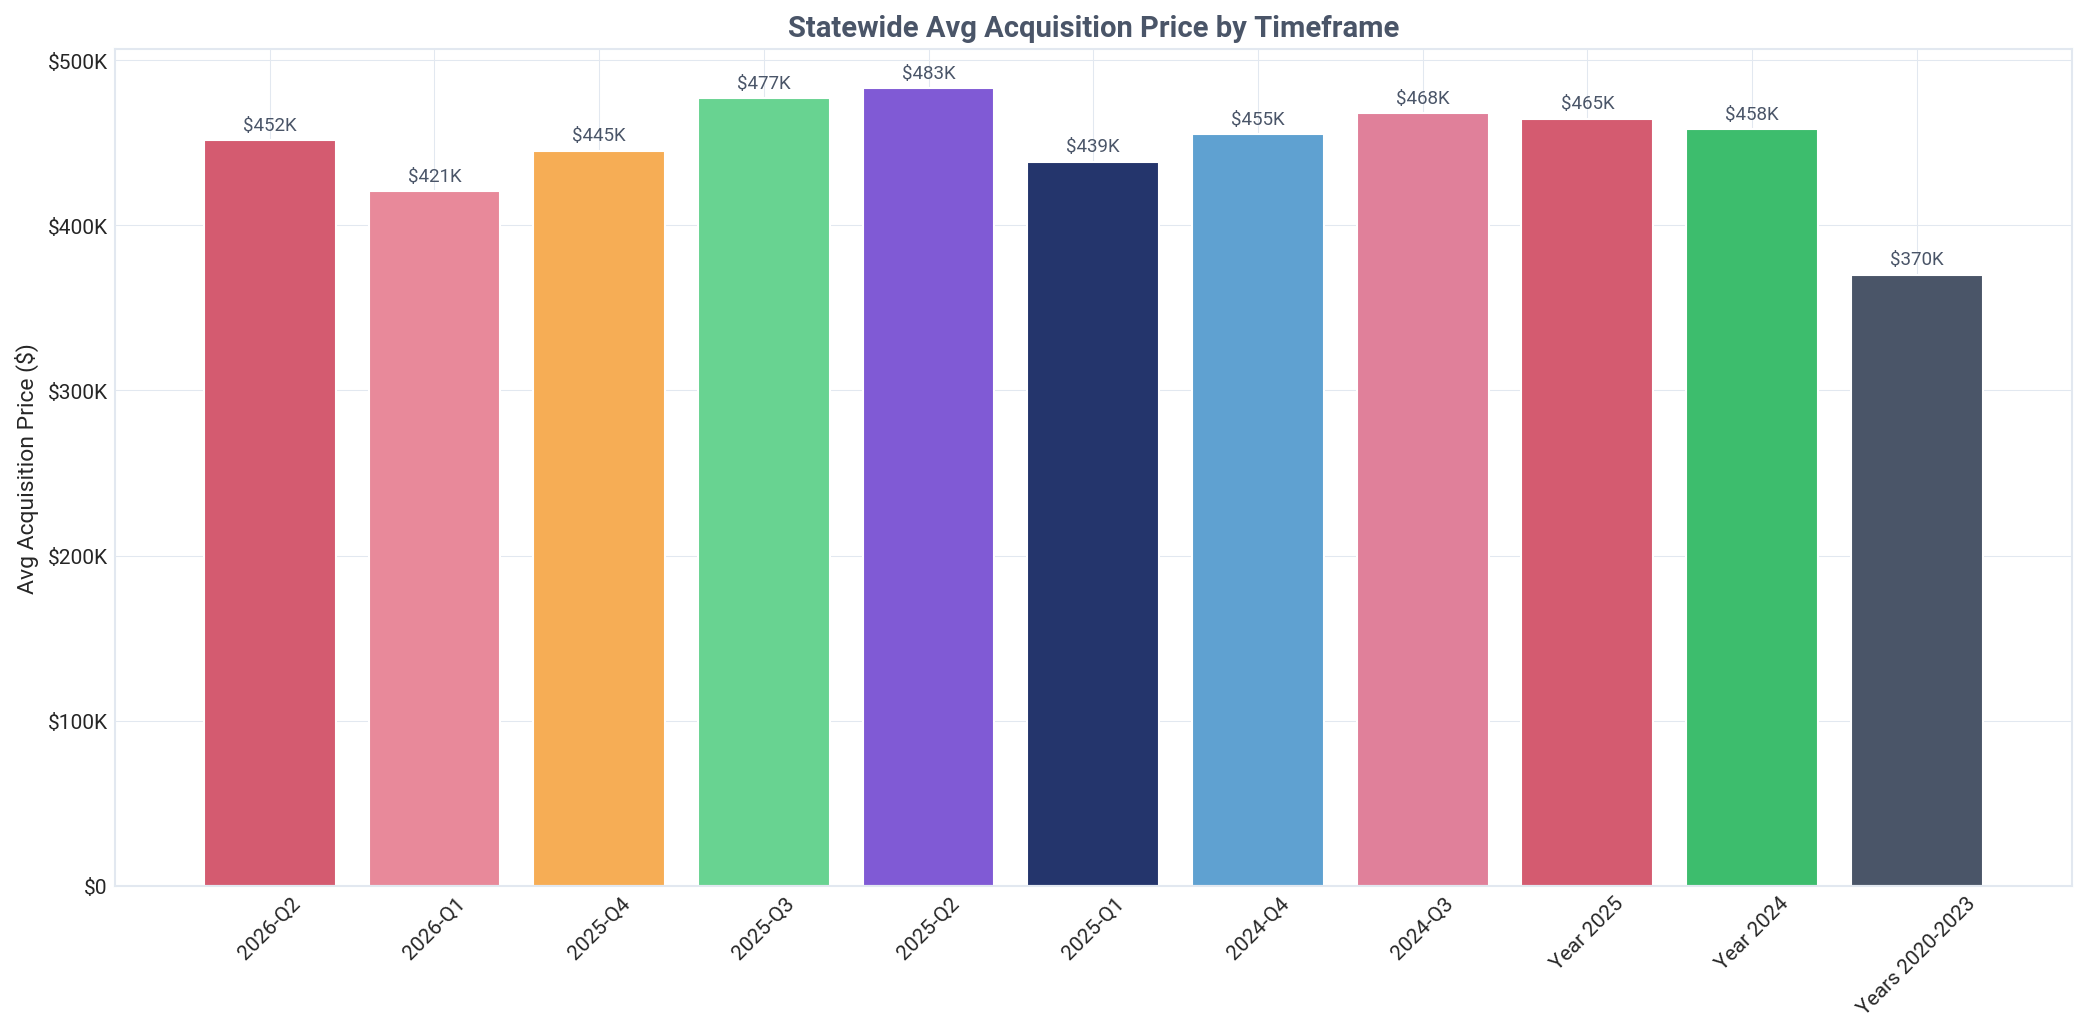
In Q2 2026, real estate investors in Maine demonstrated a distinct pricing advantage, acquiring properties for an average of $451,644. This was 8.3% less than the $492,352 paid by traditional homeowners, translating to a substantial average discount of $40,708 per property. This suggests investors are adept at finding undervalued assets or negotiating more favorable terms.

The price gap between landlords and homeowners has shown considerable fluctuation. The 8.3% discount in Q2 2026 is a sharp increase from the 2.5% discount ($10,663) observed in Q1 2026 and the 3.5% discount ($16,307) in Q4 2025. This widening gap may signal a shift in market dynamics or investor purchasing strategies.

An unusual market inversion occurred in Q3 2025, when landlords paid an average of $476,974, a surprising 13.7% premium over the homeowner price of $419,593. This anomaly contrasts sharply with the typical discount pattern and could reflect a period of intense competition for specific types of properties or locations.

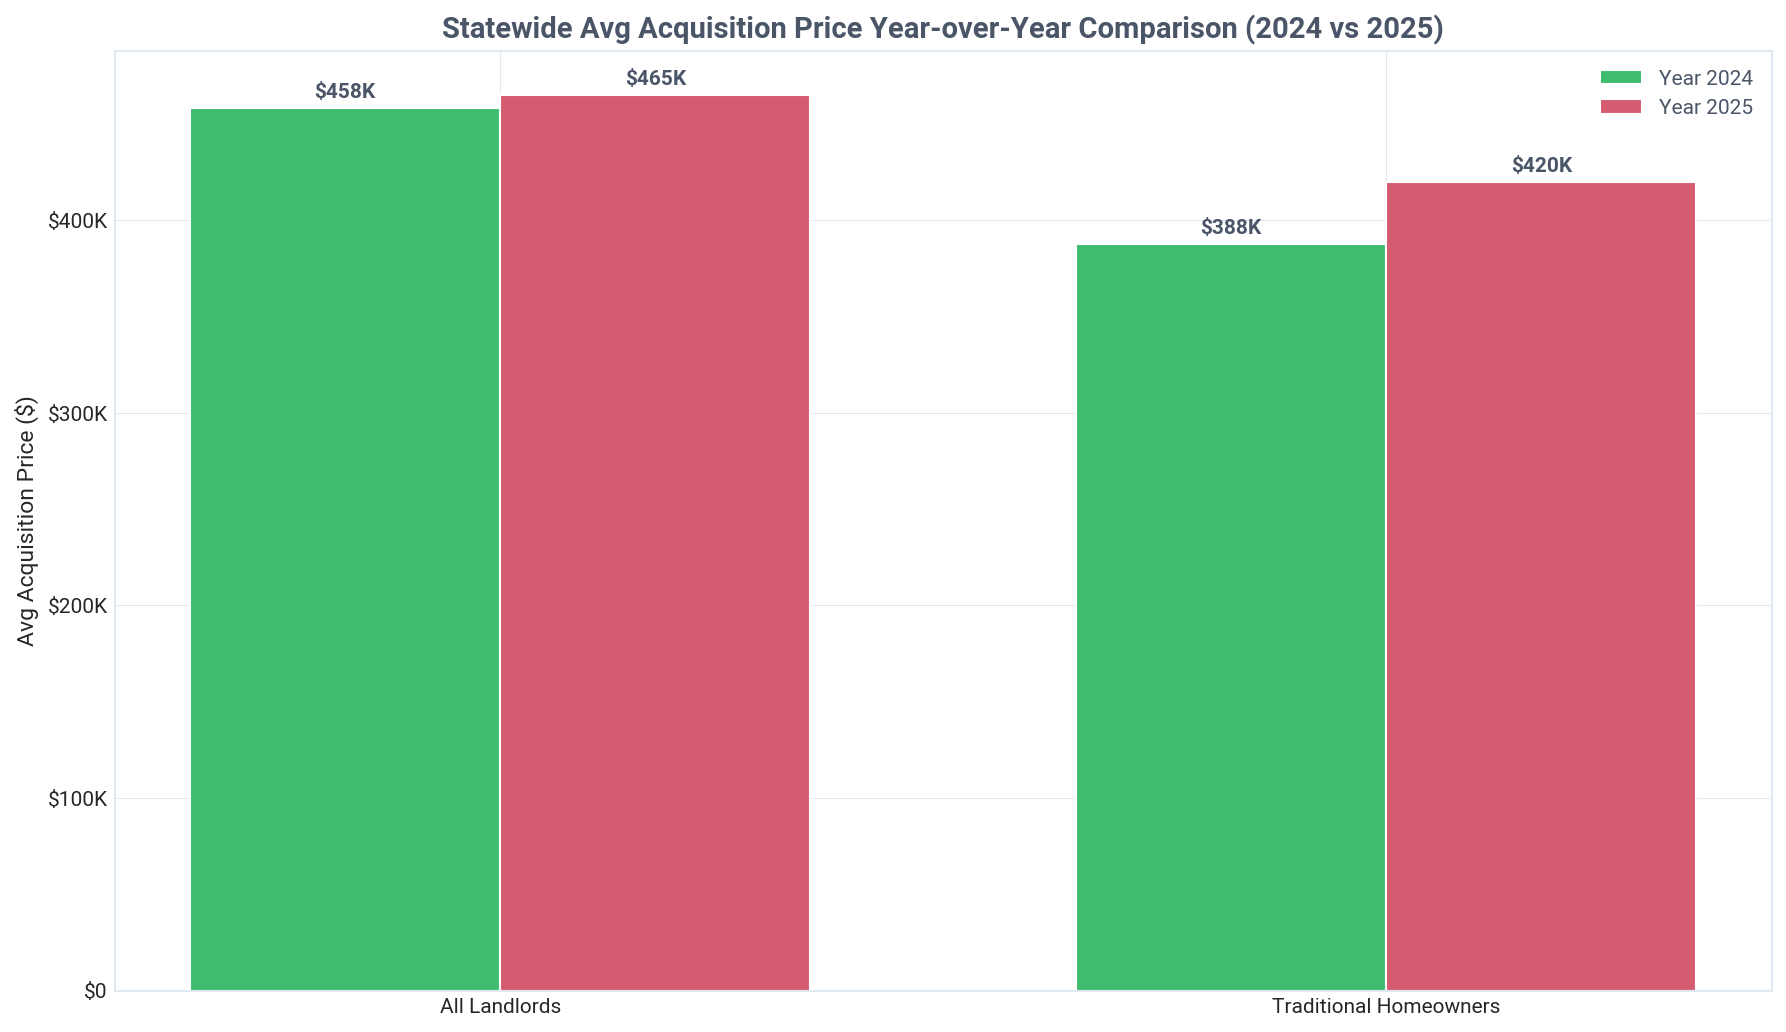
Acquisition prices have appreciated significantly since the 2020-2023 period. The average price paid by landlords in Q2 2026 ($451,644) is 22.0% higher than the average of $370,189 during the pandemic-era boom. This reflects broad market appreciation and sustained demand. An automated valuation (AVM) tool can help track these price changes over time.

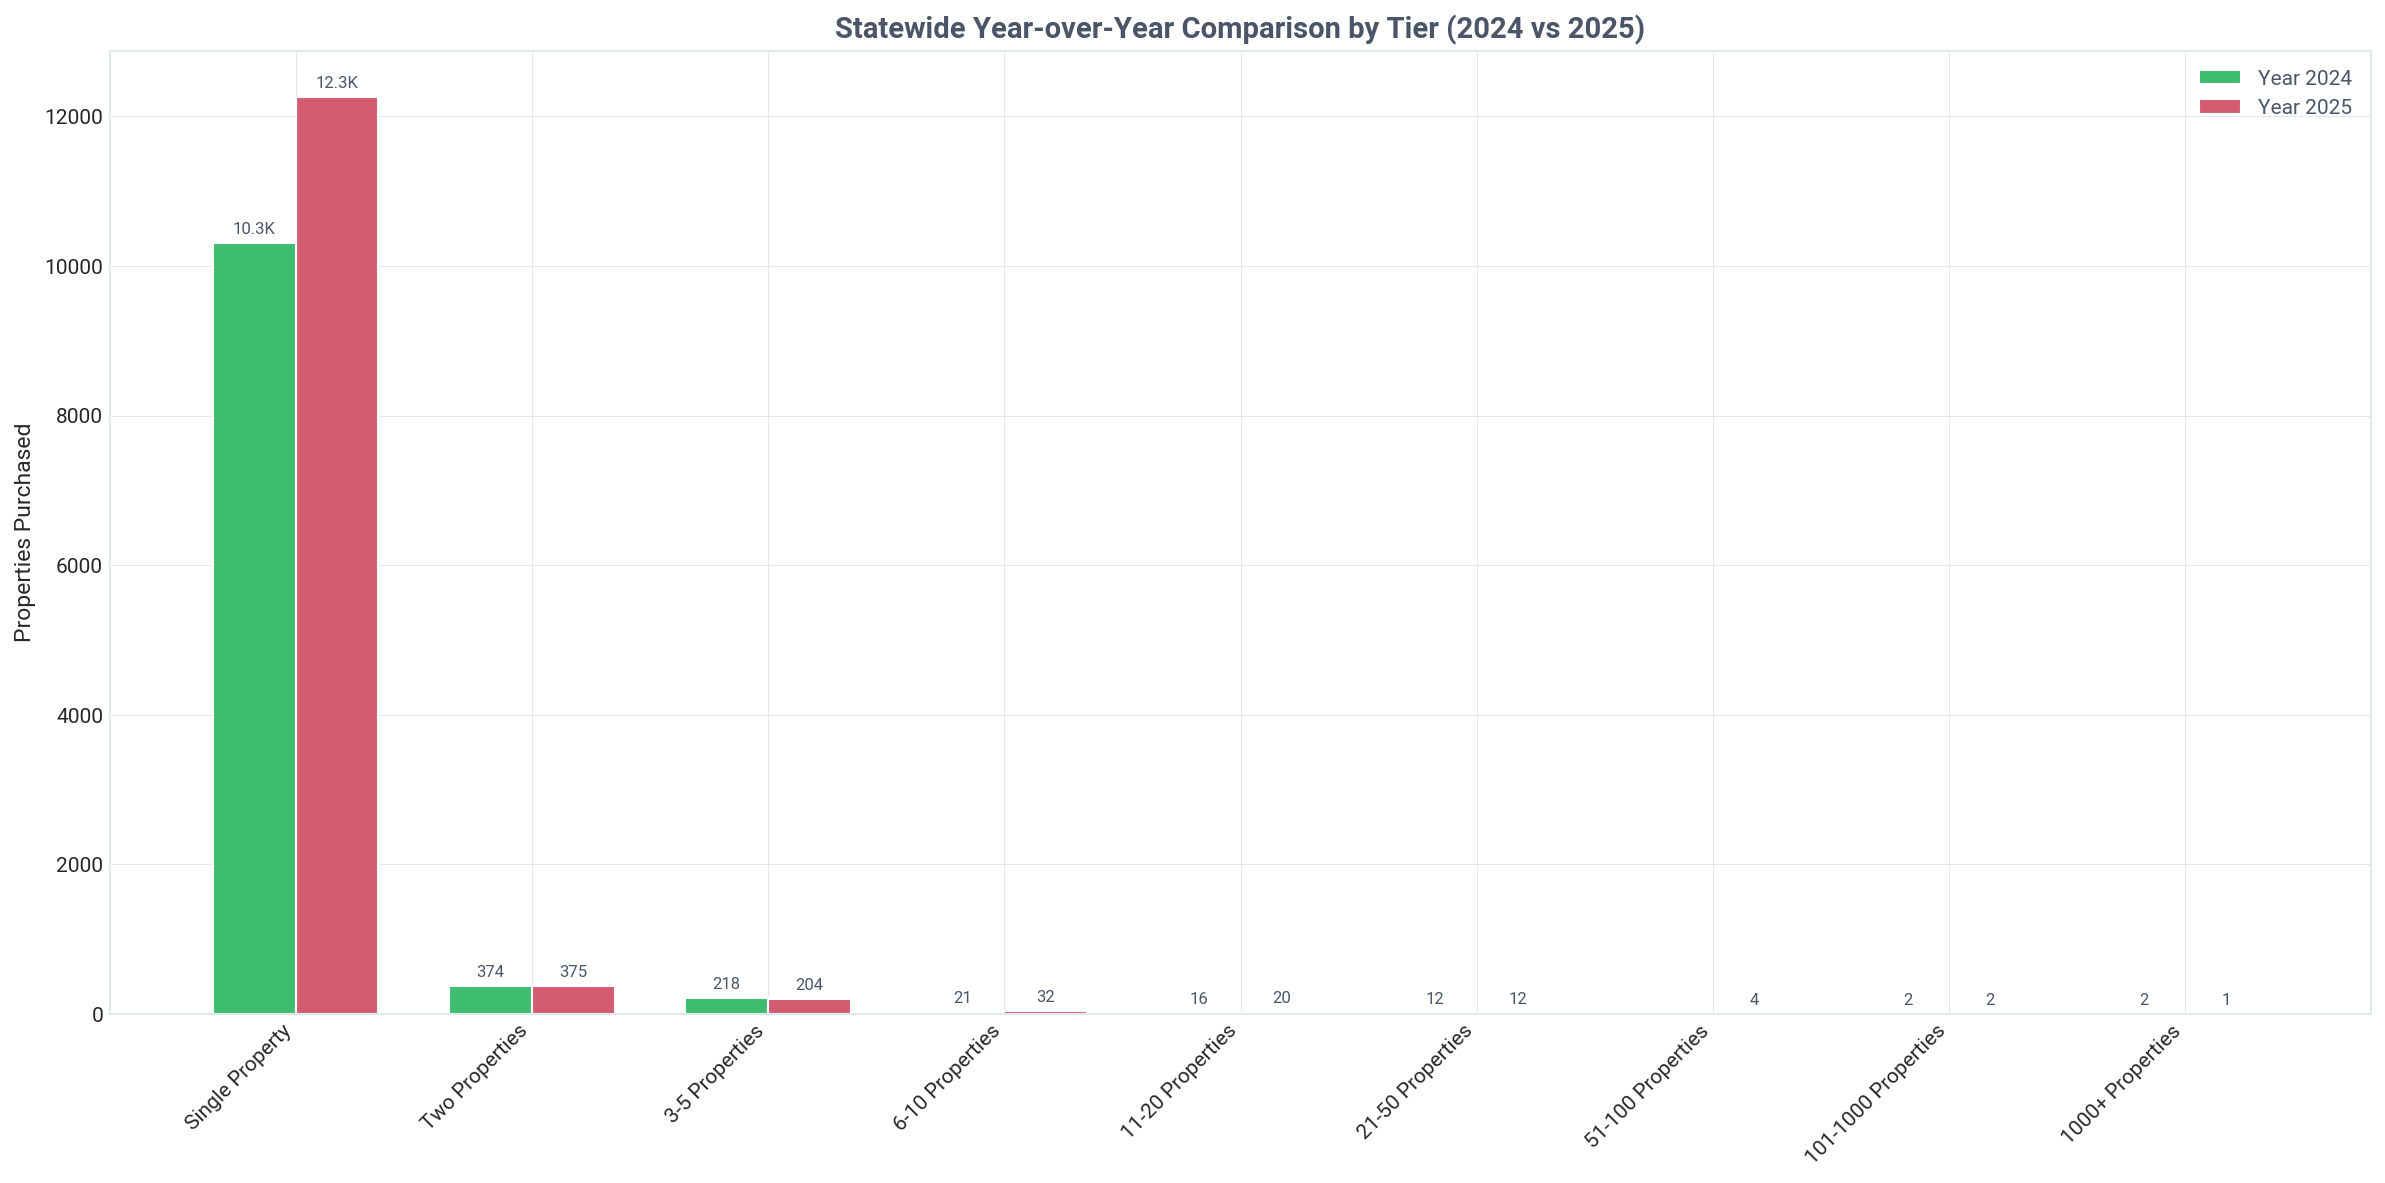
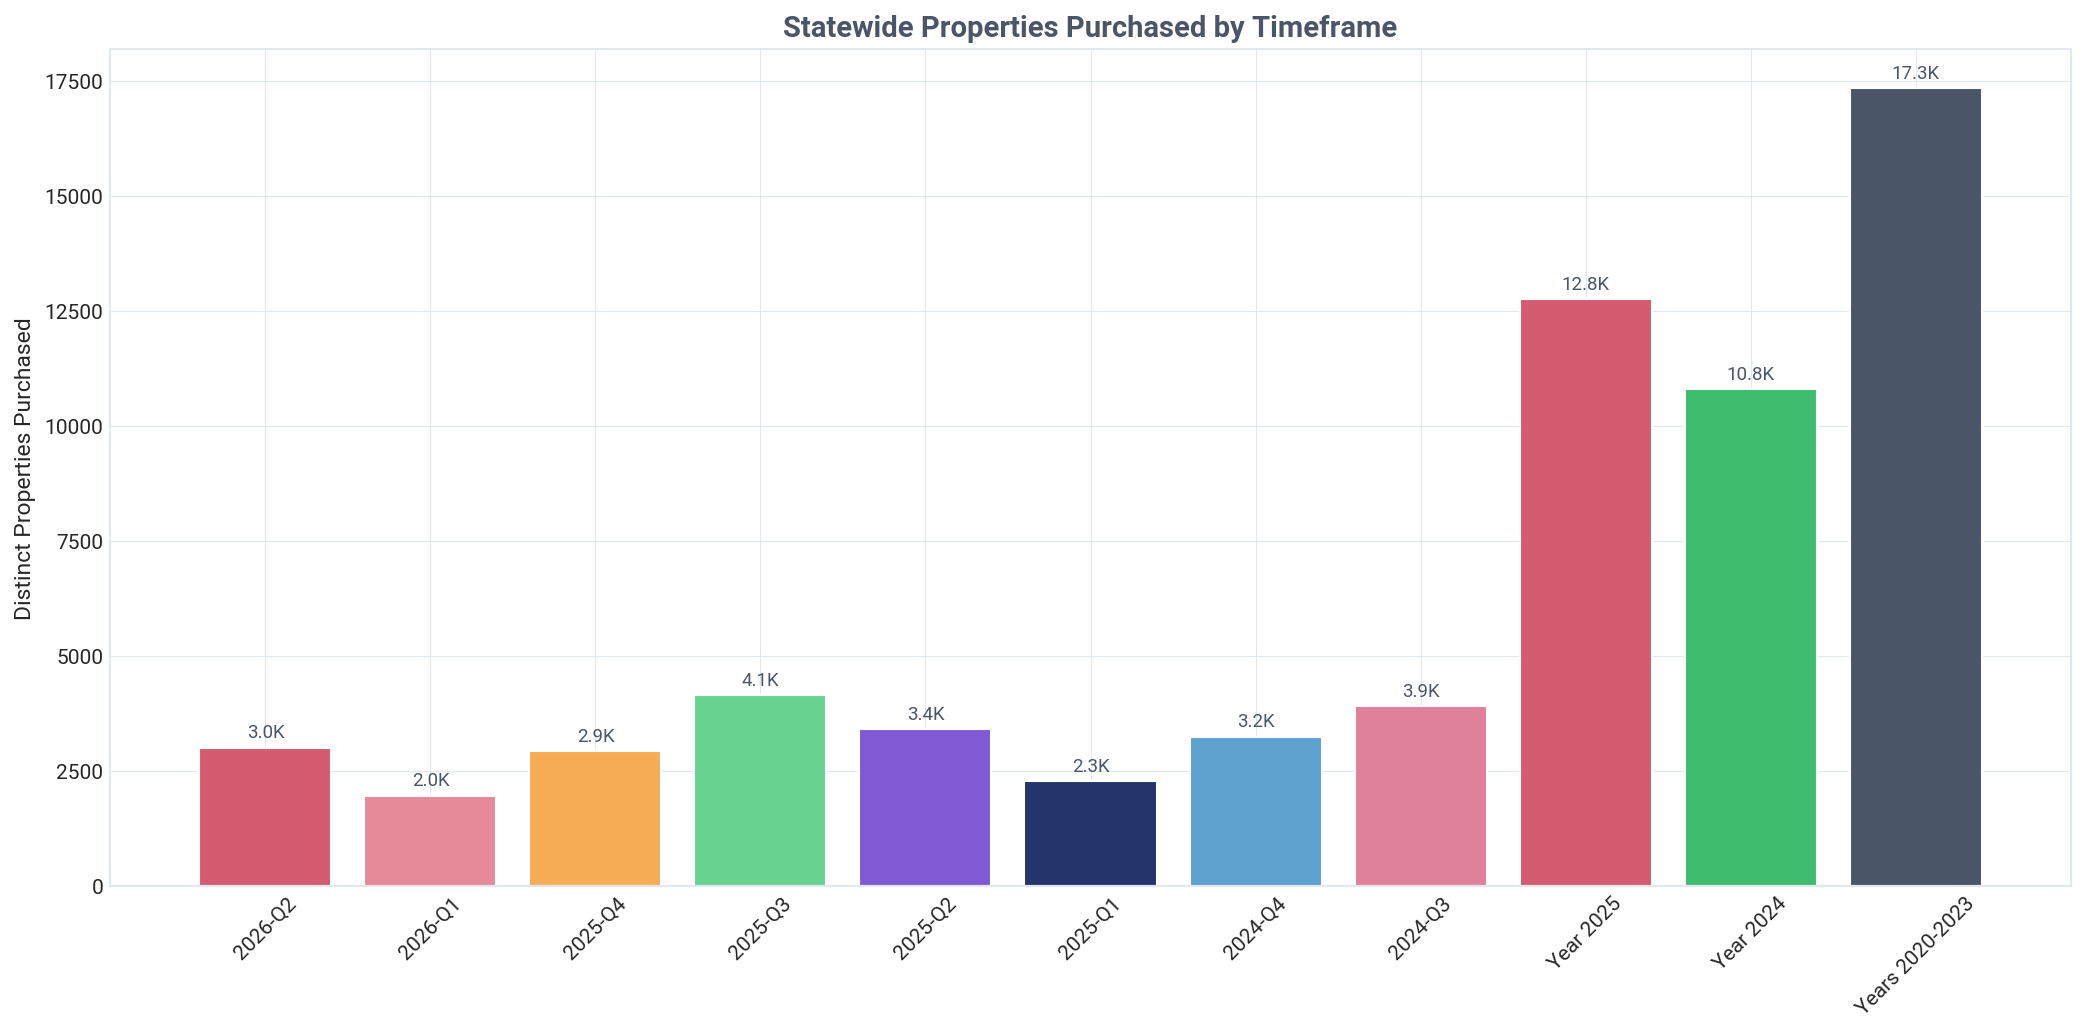
Landlord acquisition activity has remained robust, with 3,001 properties purchased in Q2 2026. This follows strong years in 2025 and 2024, where investors acquired 12,758 and 10,803 properties, respectively, indicating consistent capital deployment into Maine's housing market.

Maine: properties purchased by timeframe, Q2 2026
Maine: average acquisition price by timeframe, Q2 2026
Maine: average acquisition price by buyer type, Q2 2026
Maine: average acquisition price year over year, Q2 2026

Current Quarter Purchase Summary

Analysis of Q2 2026 purchase activity by investor tier and type

Maine: purchases by tier, Q2 2026
Maine: purchased property share by tier, Q2 2026
Key Insight
Investors captured an immense 59.6% share of all Maine home purchases in Q2 2026.
Detailed Findings

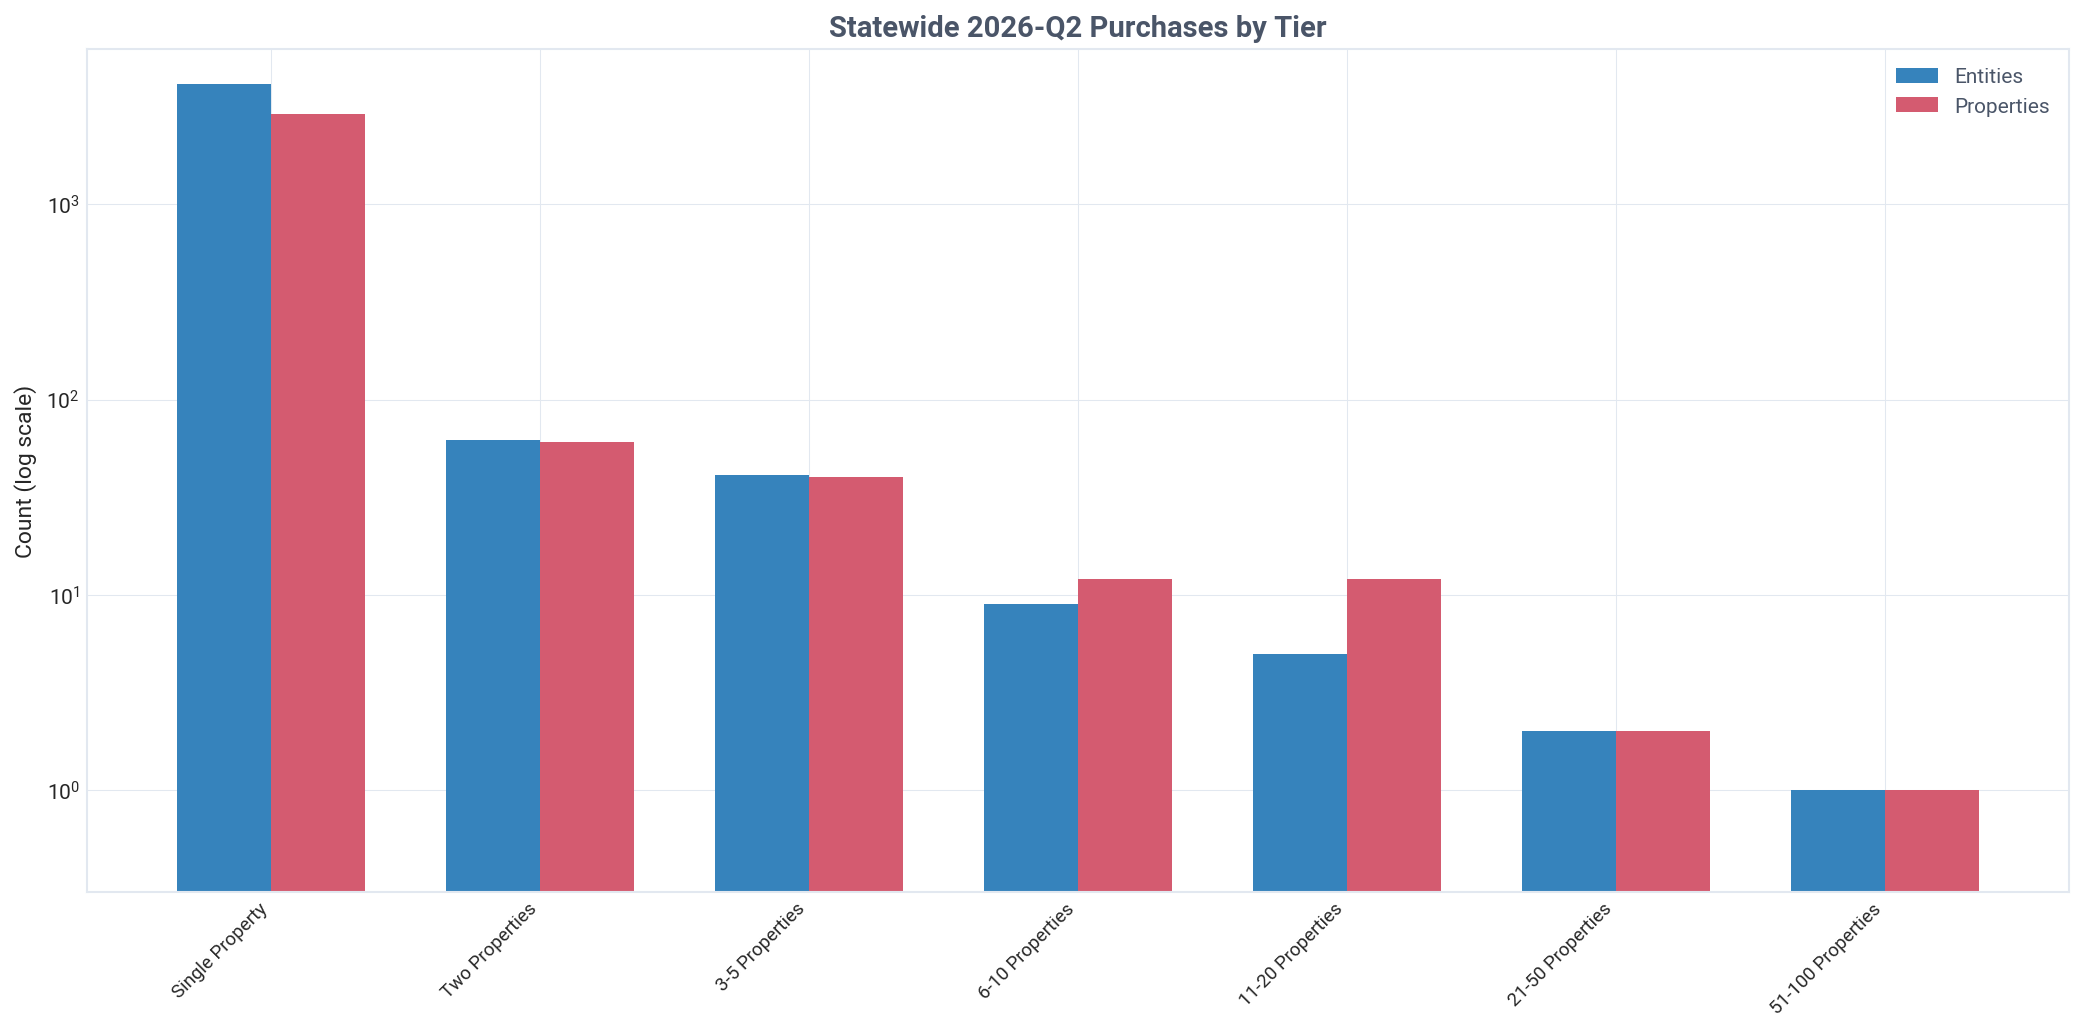
Investor activity surged in Q2 2026, with landlords purchasing 3,001 of the 5,035 single-family homes sold in Maine. This represents a commanding 59.6% market share, positioning investors as the primary driver of transaction volume during the quarter. This high level of activity signals strong confidence in the local rental market.

The market's growth is fueled almost exclusively by small-scale investors. Mom-and-pop landlords (owning 1-10 properties) accounted for a staggering 3,012 purchases, or 99.5% of all investor acquisitions in Q2 2026. This highlights a grassroots expansion of the rental market rather than a top-down corporate consolidation.

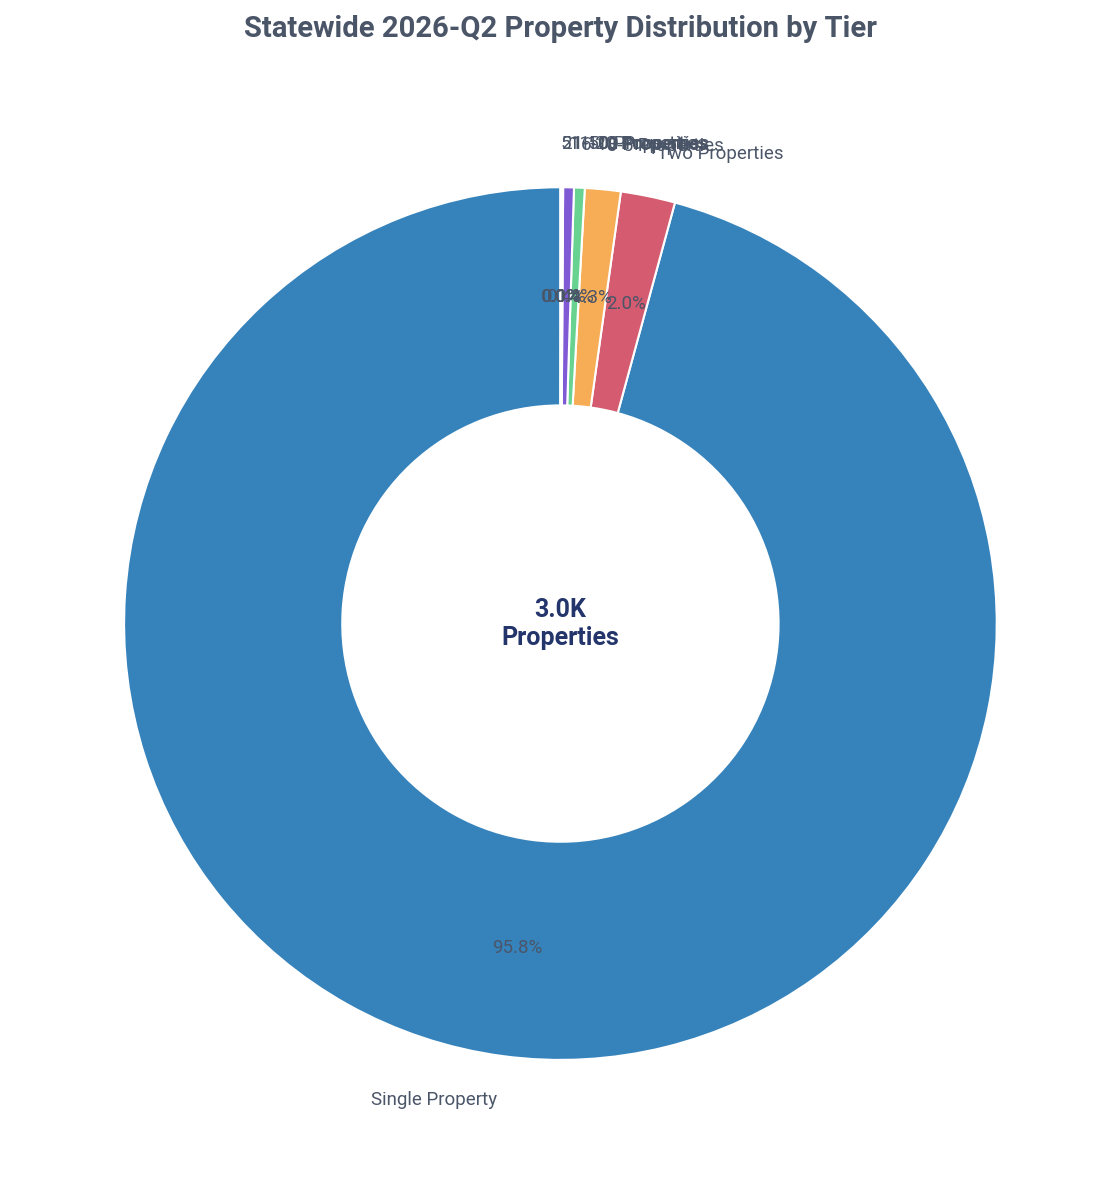
A wave of new entrants is entering the market, a trend visible in the single-property tier. In Q2 2026, 2,899 properties (95.8% of all landlord purchases) were acquired by investors in this tier, representing 4,133 new or expanding landlord entities. This influx of first-time investors is the single largest source of demand.

Mid-size landlords showed minimal purchasing activity. Tiers owning 11 to 100 properties collectively purchased only 15 properties, or 0.5% of the investor total. This segment appears to be in a holding pattern, neither aggressively expanding nor divesting in the current market.

Institutional investors (1,000+ properties) were completely inactive in Maine during Q2 2026, making zero purchases. Their absence, combined with the hyperactivity of mom-and-pop buyers, reinforces the narrative that Maine's investor market is decentralized and dominated by small, local operators rather than large national firms.

Ownership by Purchase Tier

Distribution of investor-owned properties across portfolio size tiers

Key Insight
Mom-and-pop landlords (1-10 properties) overwhelmingly control 99.4% of Maine's investor-owned SFRs.
Detailed Findings

The ownership structure of Maine's investor market is exceptionally concentrated at the smallest scale. Mom-and-pop landlords, defined as those owning 1-10 properties, control 99.4% of all investor-owned single-family homes. This near-total dominance underscores the market's reliance on small, independent owners.

First-time or single-property landlords form the bedrock of the market. This tier alone holds 137,336 properties, which constitutes 89.3% of the entire investor portfolio. This finding demonstrates that the typical Maine landlord is not a large corporation but an individual with a single rental property.

In stark contrast to national headlines, institutional investors (1,000+ properties) have a statistically insignificant footprint in Maine. They own just 24 properties across the entire state, representing 0.0% of the investor-owned market. This complete absence of large-scale institutional ownership is a defining characteristic of Maine's housing market.

The mid-size investor segment (11-1,000 properties) is also very small, collectively owning only 909 properties or about 0.6% of the investor total. This indicates a sharp drop-off in ownership after the 10-property mark, with very few landlords scaling into larger portfolios.

This distribution has remained consistent over time, as seen in both all-time ownership and recent purchase data. The data from various property ownership by owner type reports confirms that the market's structure is stable, with no signs of consolidation by larger players. Instead, it continues to expand through the entry of new, small-scale landlords.

Maine: current ownership by purchase tier, Q2 2026
Maine: properties purchased by tier, all time, Q2 2026
Maine: properties purchased by tier this quarter, Q2 2026
Maine: properties purchased by tier year over year, Q2 2026

Need custom portfolio analysis based on these tier insights?

TALK TO AN EXPERT

Ownership by Tier & Owner Type

Breakdown of individual vs corporate ownership across portfolio tiers

Maine: ownership by tier and owner type, Q2 2026
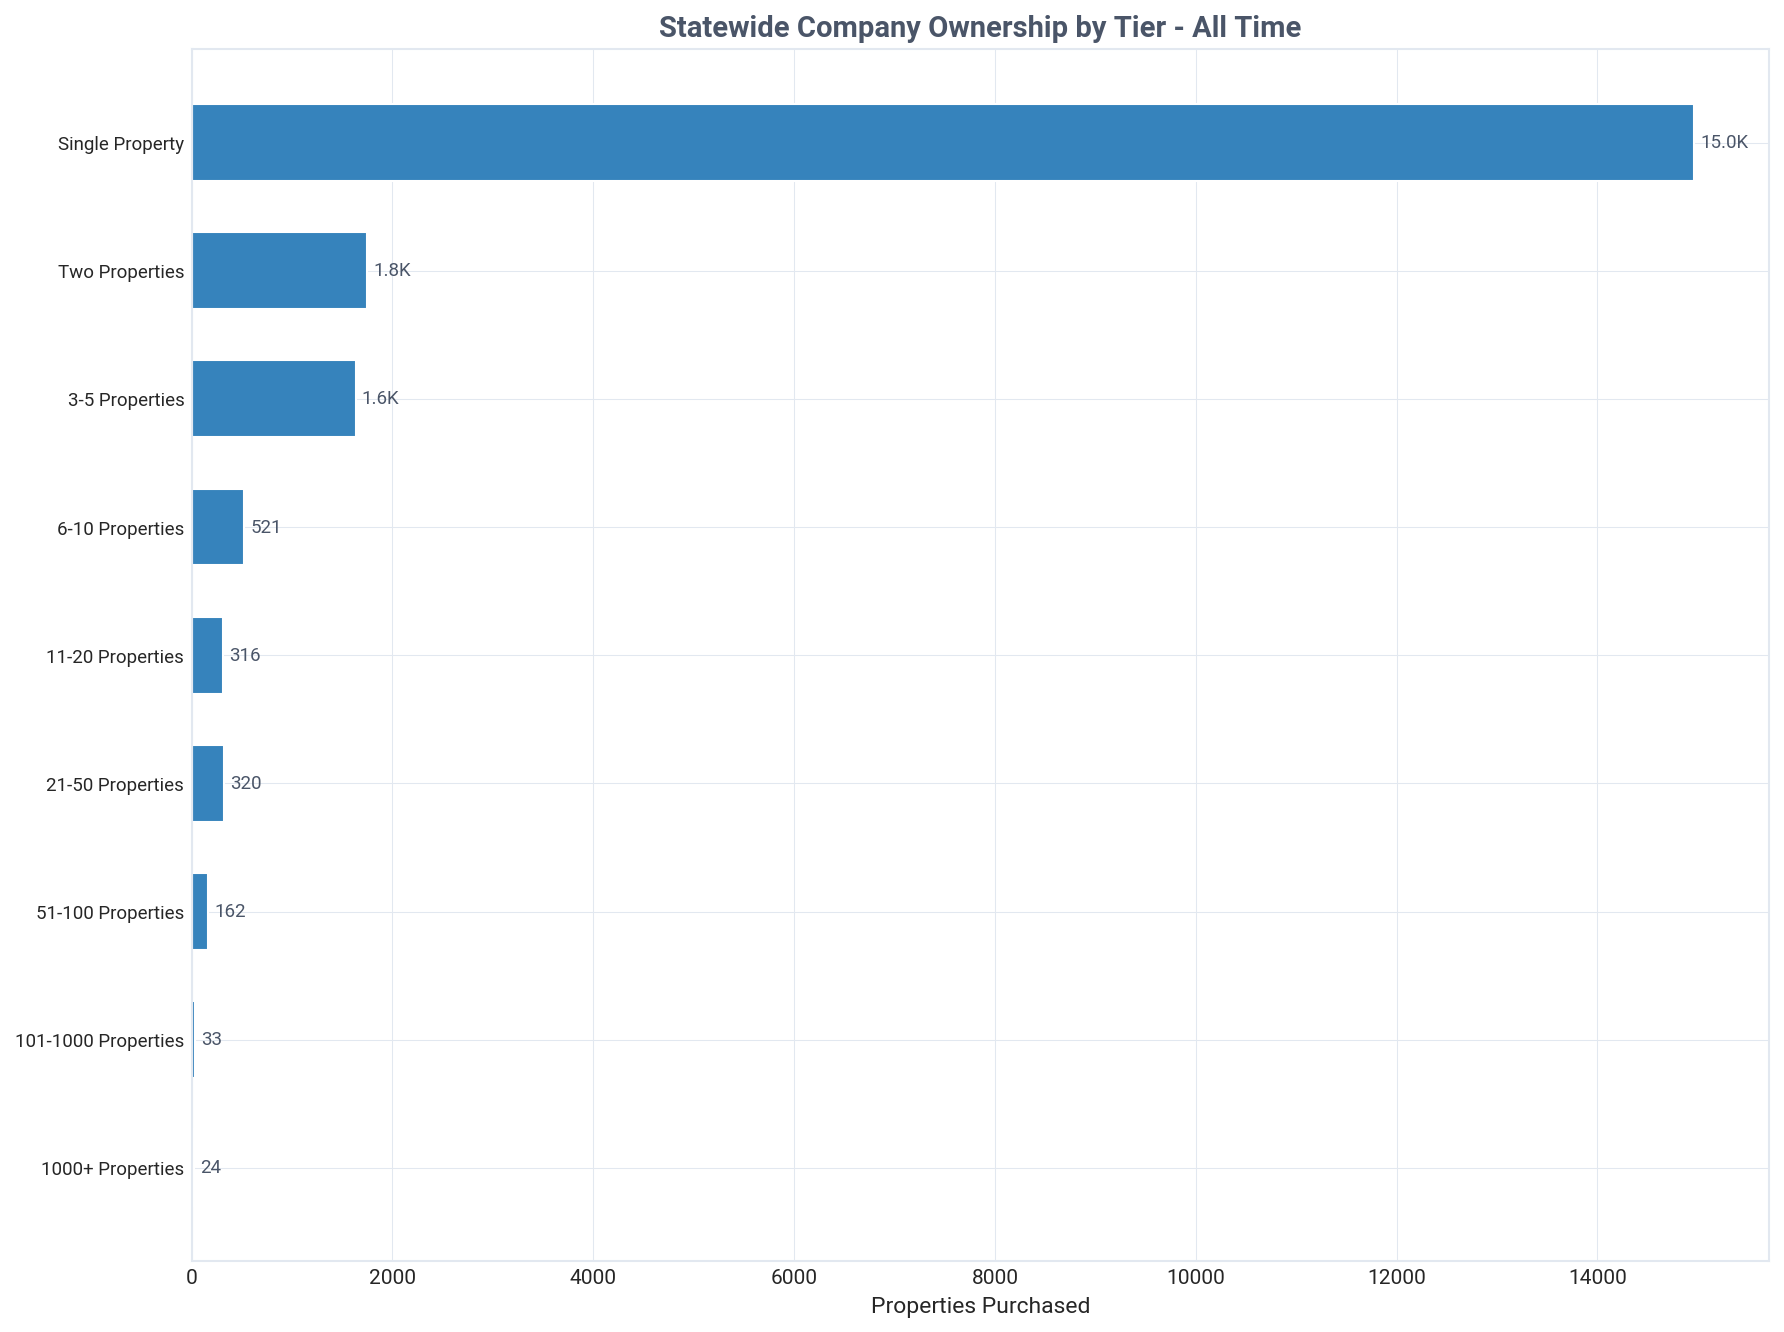
Maine: company purchases by tier, all time, Q2 2026
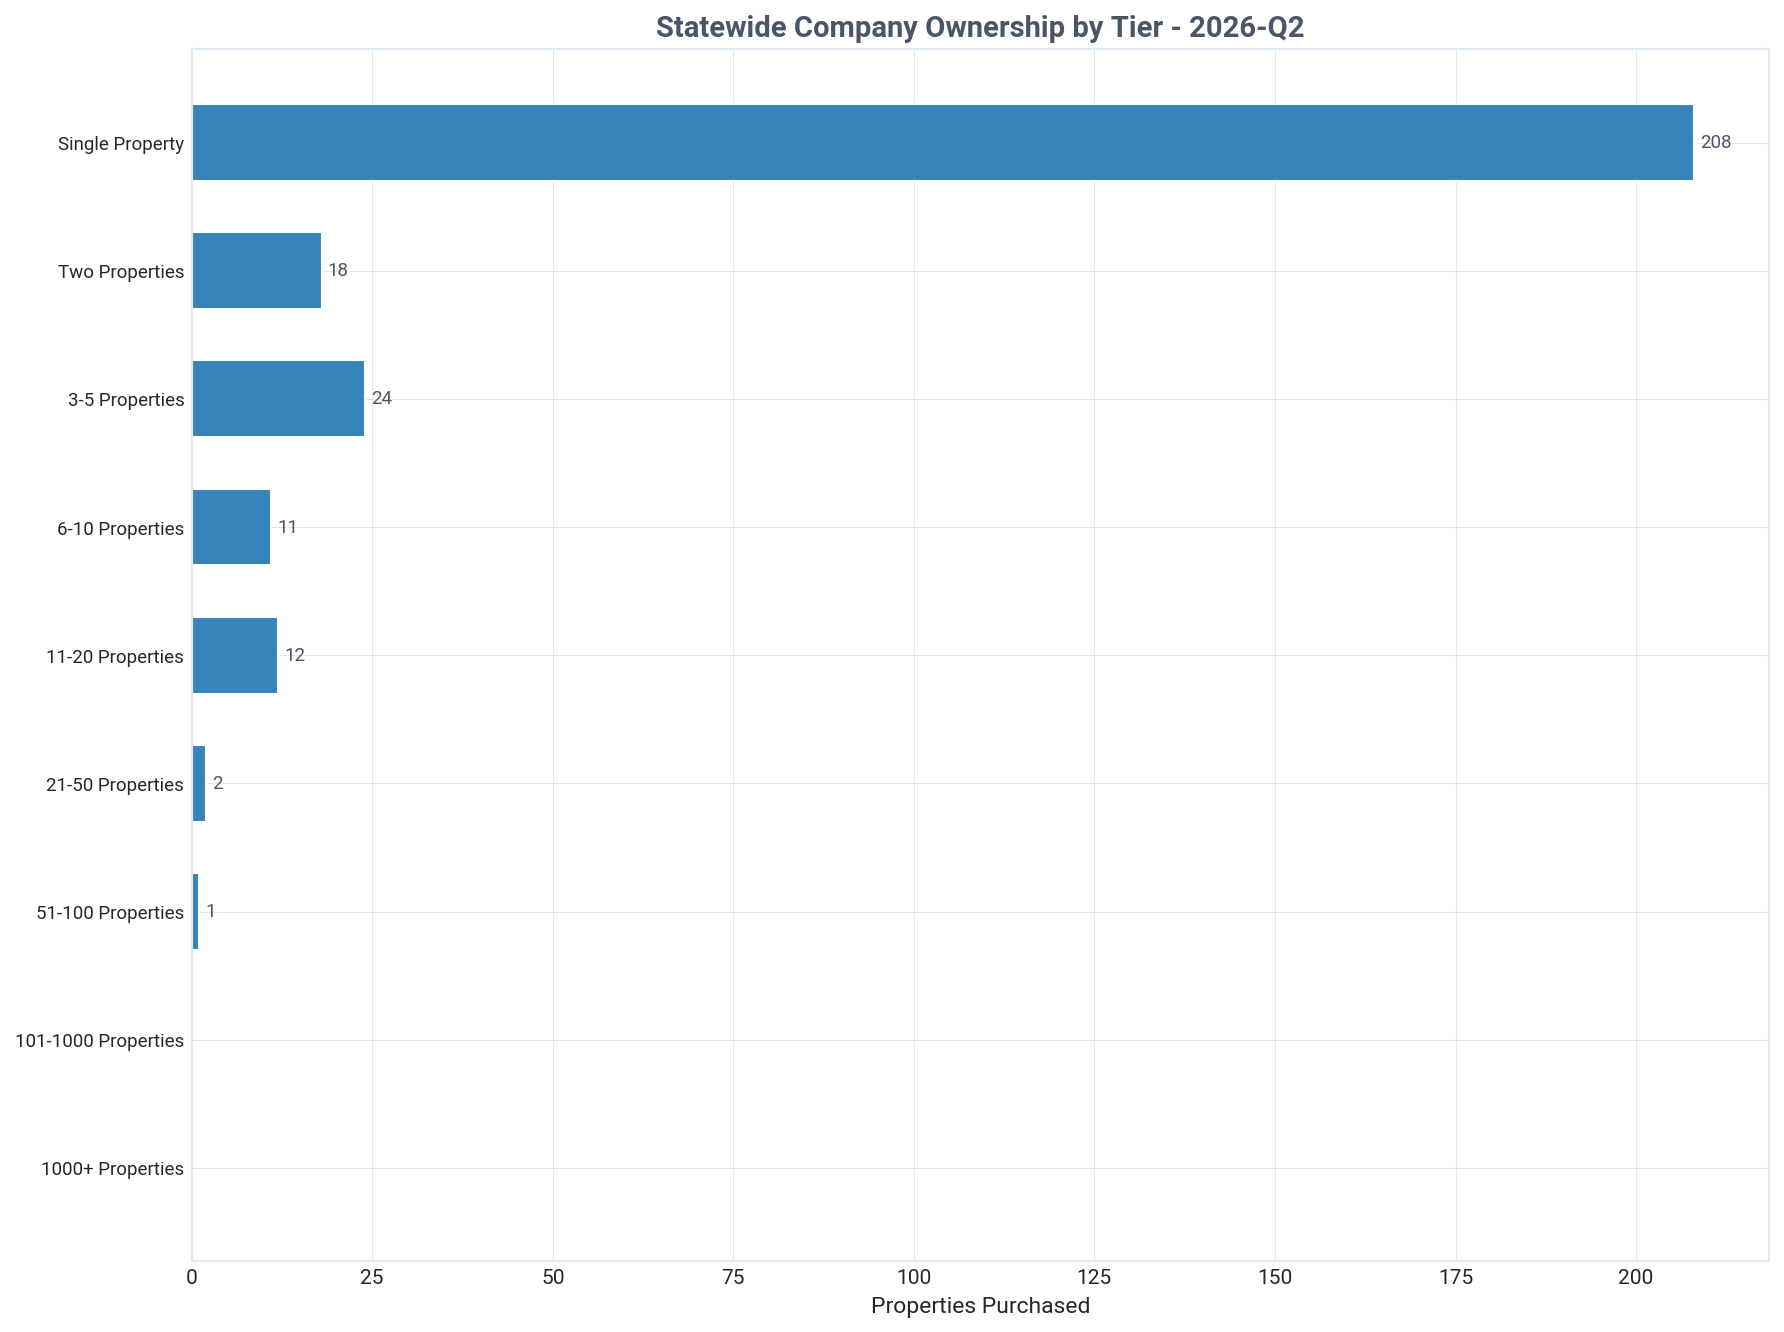
Maine: company purchases by tier this quarter, Q2 2026
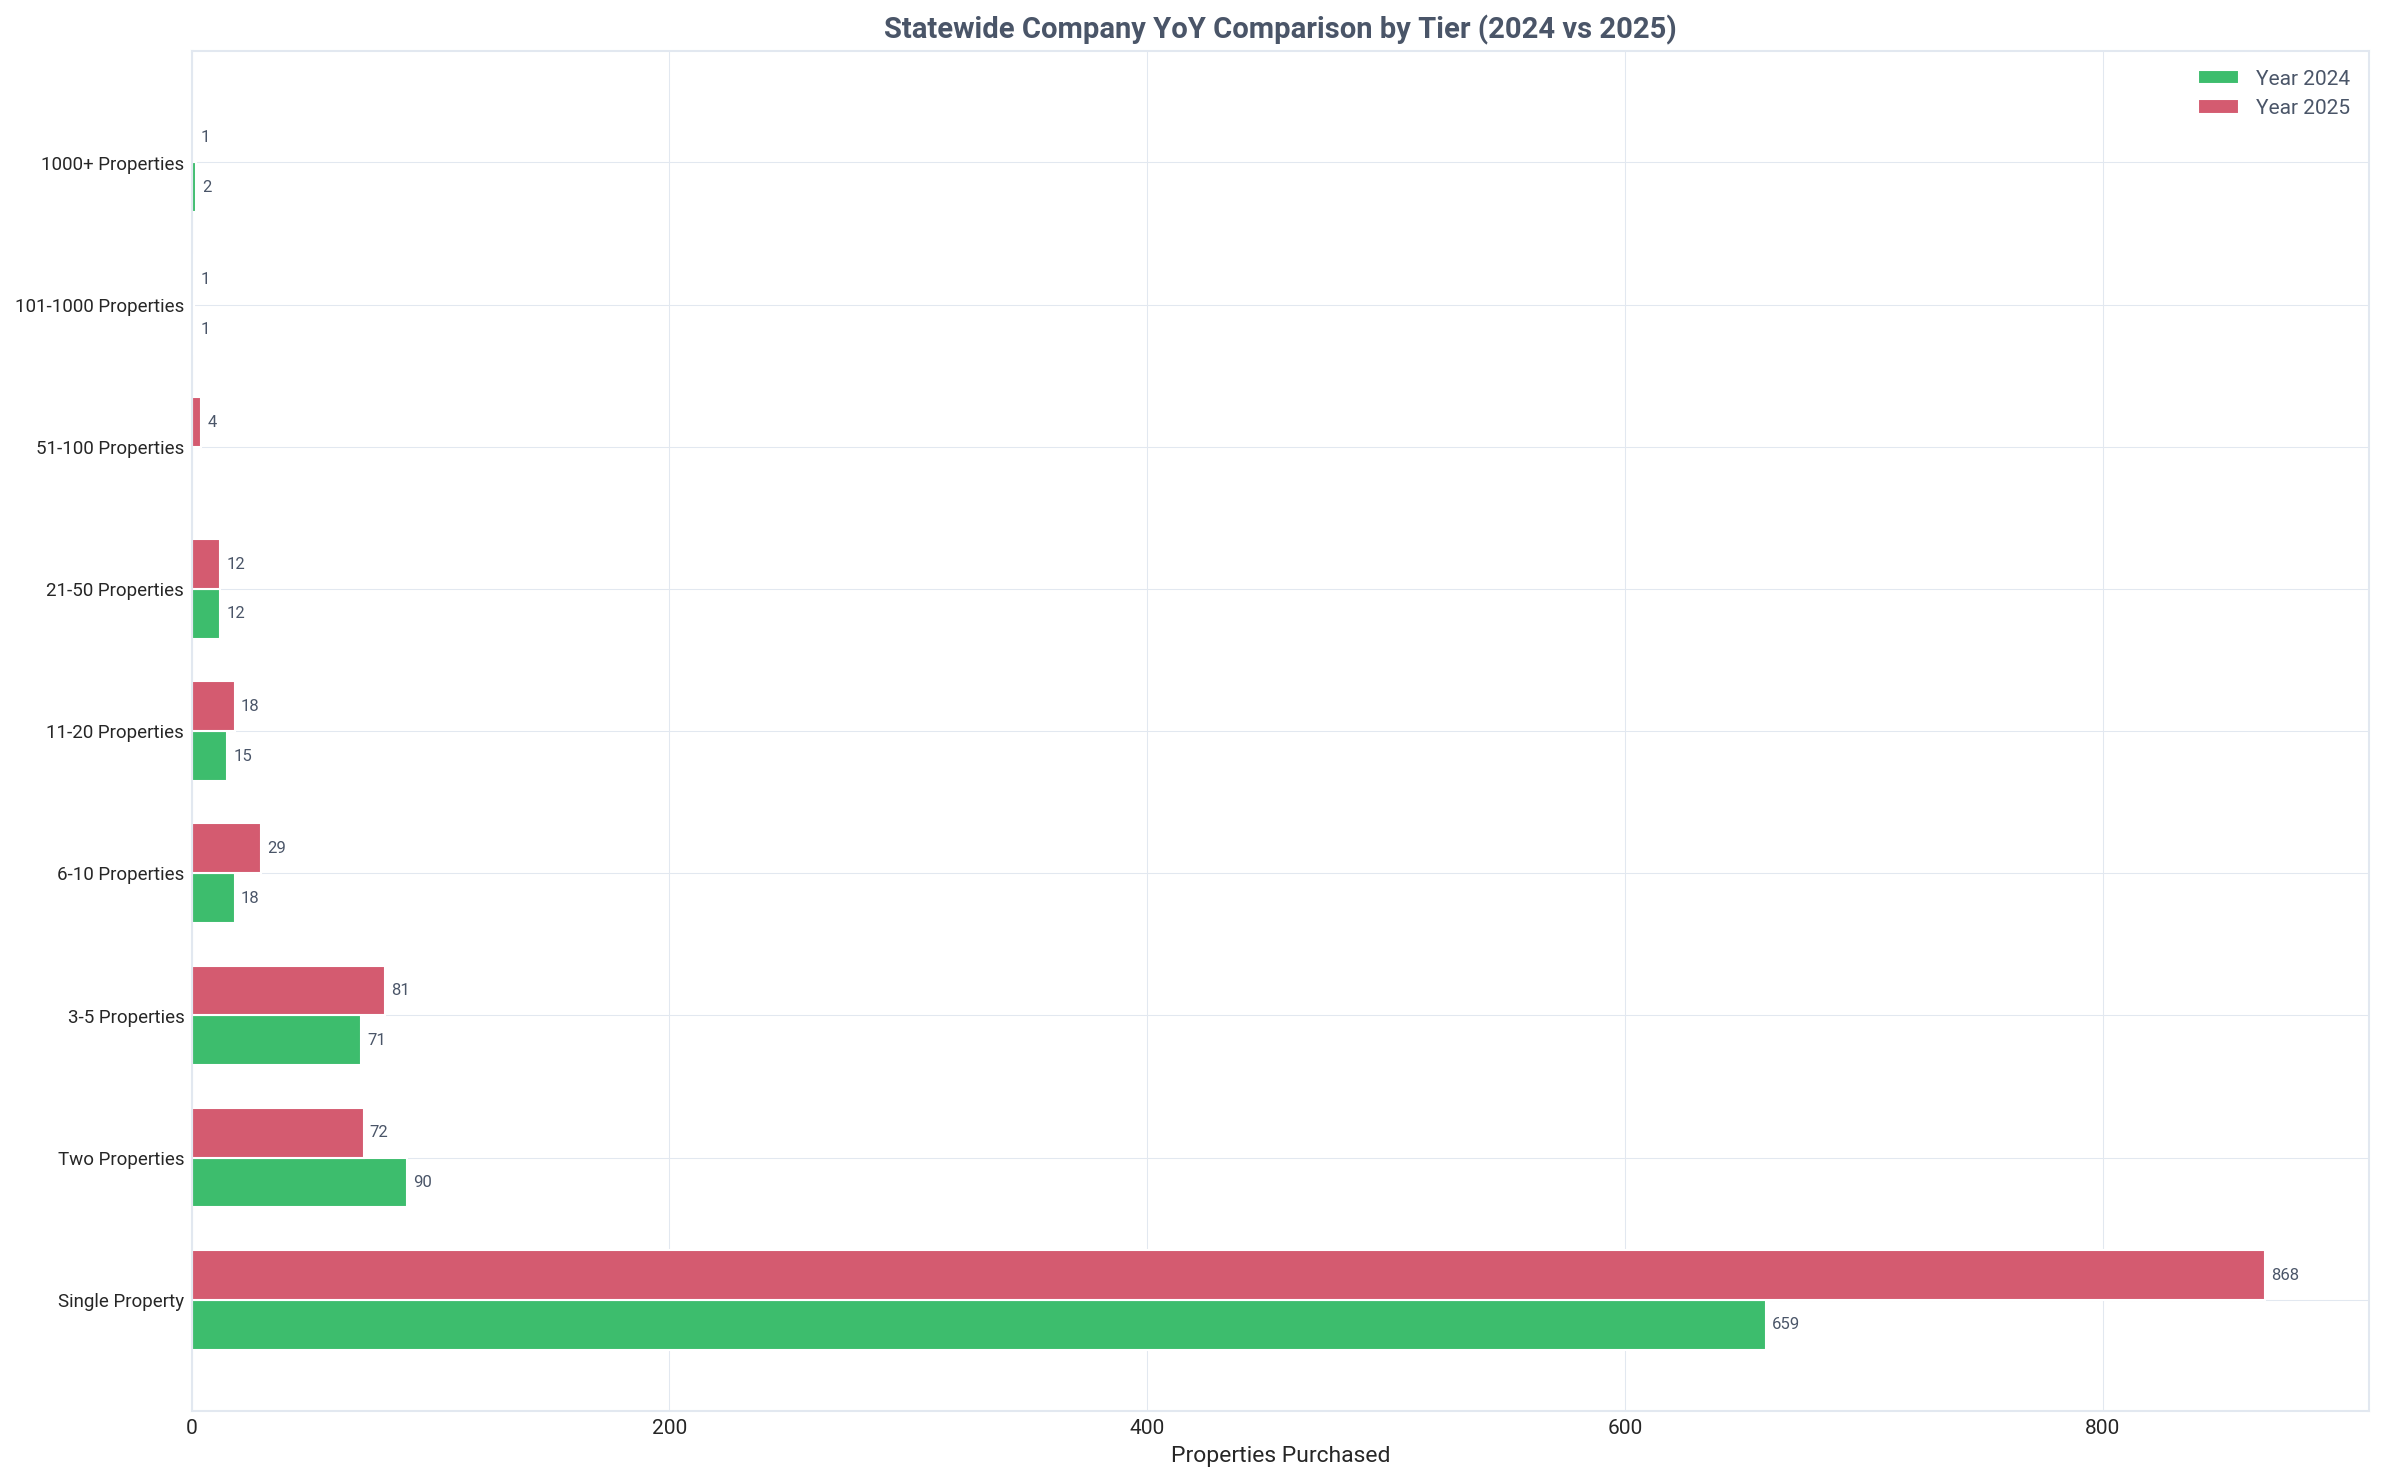
Maine: company purchases by tier year over year, Q2 2026
Key Insight
Companies become the majority owners at the 6-10 property tier, signaling a key scaling threshold.
Detailed Findings

A clear ownership shift from individuals to companies occurs as portfolio sizes increase in Maine. While individuals dominate smaller tiers, companies become the majority owners in the 6-10 property tier, holding 521 properties (70.7%) compared to the 216 held by individuals. This crossover point marks a strategic shift where investors often incorporate for liability and operational efficiency.

Individual investors form the vast majority of the small-portfolio segment. They own 126,585 (89.4%) of single-property portfolios, 7,207 (80.4%) of two-property portfolios, and 4,370 (72.8%) of 3-5 property portfolios. This highlights that the entry-level and early growth stages of real estate investing are overwhelmingly pursued by individuals.

Company ownership becomes nearly absolute in larger tiers. For portfolios of 11-20 properties, companies own 81.4%. This figure rises to 98.2% for the 51-100 property tier and 89.2% for the 101-1,000 property tier. This demonstrates that significant scaling in Maine's rental market is almost exclusively done through corporate structures.

Despite the company dominance in larger tiers, the total number of properties held by these company-led tiers remains small. For instance, companies in the 51-100 tier own just 162 properties total, reinforcing that even the more professionalized segment of the market operates at a modest scale.

The data suggests two distinct paths for investors: a majority who remain individuals with 1-5 properties, and a minority who professionalize by forming a company to grow beyond 5 properties. Understanding these owner types is crucial for anyone using a property search platform to identify potential sellers or partners.

Geographic Distribution

Regional breakdown of investor activity and ownership patterns

Key Insight
York and Cumberland counties lead investor activity with over 21,000 properties each.
Detailed Findings

Investor ownership in Maine is concentrated in its most populous southern counties. York County leads with 21,573 investor-owned properties, followed closely by Cumberland County with 21,288. Together, these two regions account for over a quarter of all investor-held SFRs in the state, reflecting their economic and population density.

While southern counties have the highest counts, more rural and coastal counties exhibit the highest rates of investor ownership. Hancock County has the highest concentration in the state, with 46.8% of its SFRs owned by investors. It is followed by Franklin (45.9%), Piscataquis (45.0%), and Washington (43.8%), suggesting these areas are popular for second homes, vacation rentals, and long-term rental investments.

The top five counties by property count (York, Cumberland, Penobscot, Hancock, Kennebec) collectively hold 80,061 investor-owned SFRs, representing 53.3% of the state's total investor portfolio. This highlights a significant geographic concentration of rental housing assets.

The data reveals a clear distinction between where investors own the most properties (volume) and where they control the largest share of the market (penetration). For example, Cumberland County has the second-highest property count (21,288) but a relatively moderate ownership rate of 23.5%. Conversely, Hancock has a much lower count (12,819) but the state's highest rate (46.8%).

This geographic divergence points to different investment strategies at play across Maine. Urban and suburban counties like Cumberland attract investment due to strong, stable rental demand from a primary resident population, while counties like Hancock likely draw investors focused on the tourism and vacation rental economy. This level of detail is often found in comprehensive market reports.

Maine: landlord ownership map, Q2 2026
Maine: top 15 areas by landlord-owned properties, Q2 2026
Maine: top 15 areas by landlord ownership share, Q2 2026

Historical Transactions

Buy/sell transaction trends over time for all landlords and institutional investors

Maine: landlord buy and sell transactions, Q2 2026
Maine: landlord average buy and sell prices, Q2 2026
Maine: landlord transactions year over year, Q2 2026
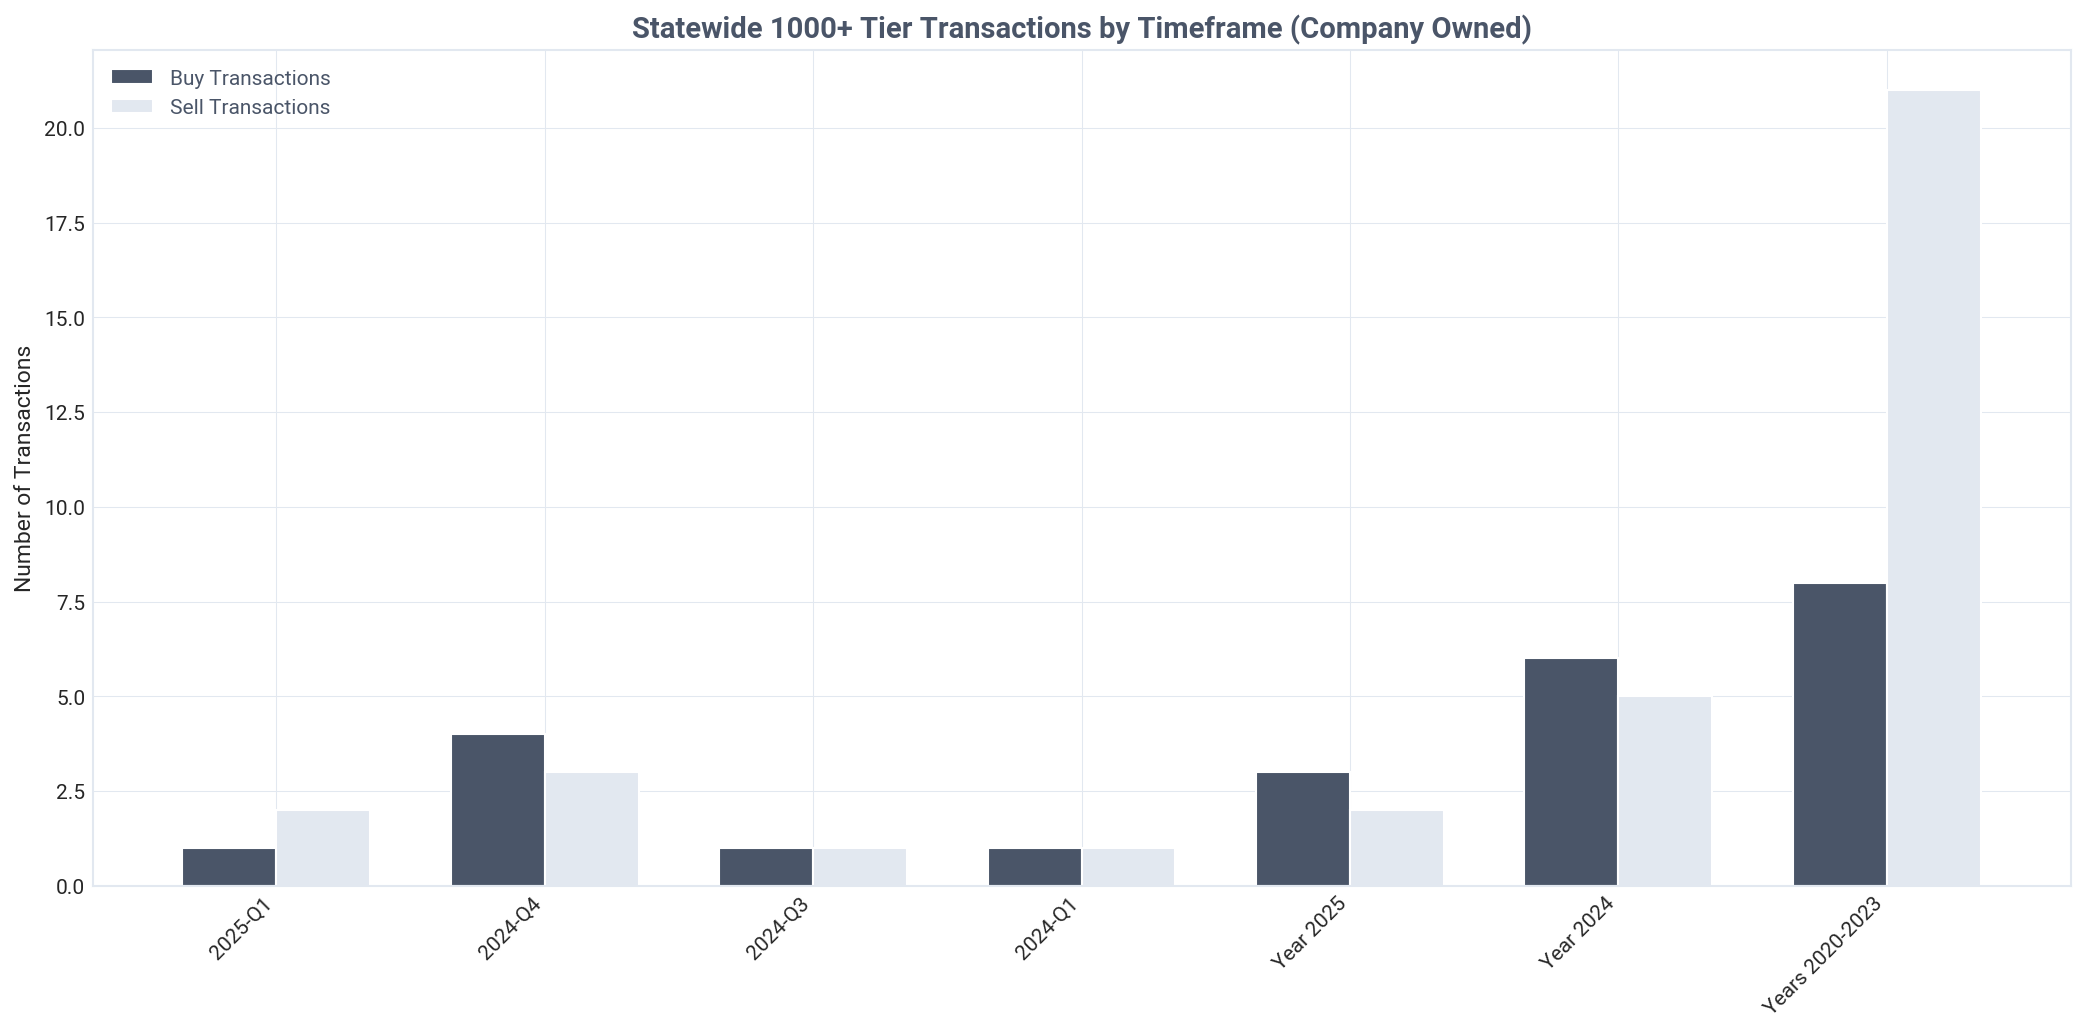
Maine: 1000+ tier company transactions, Q2 2026
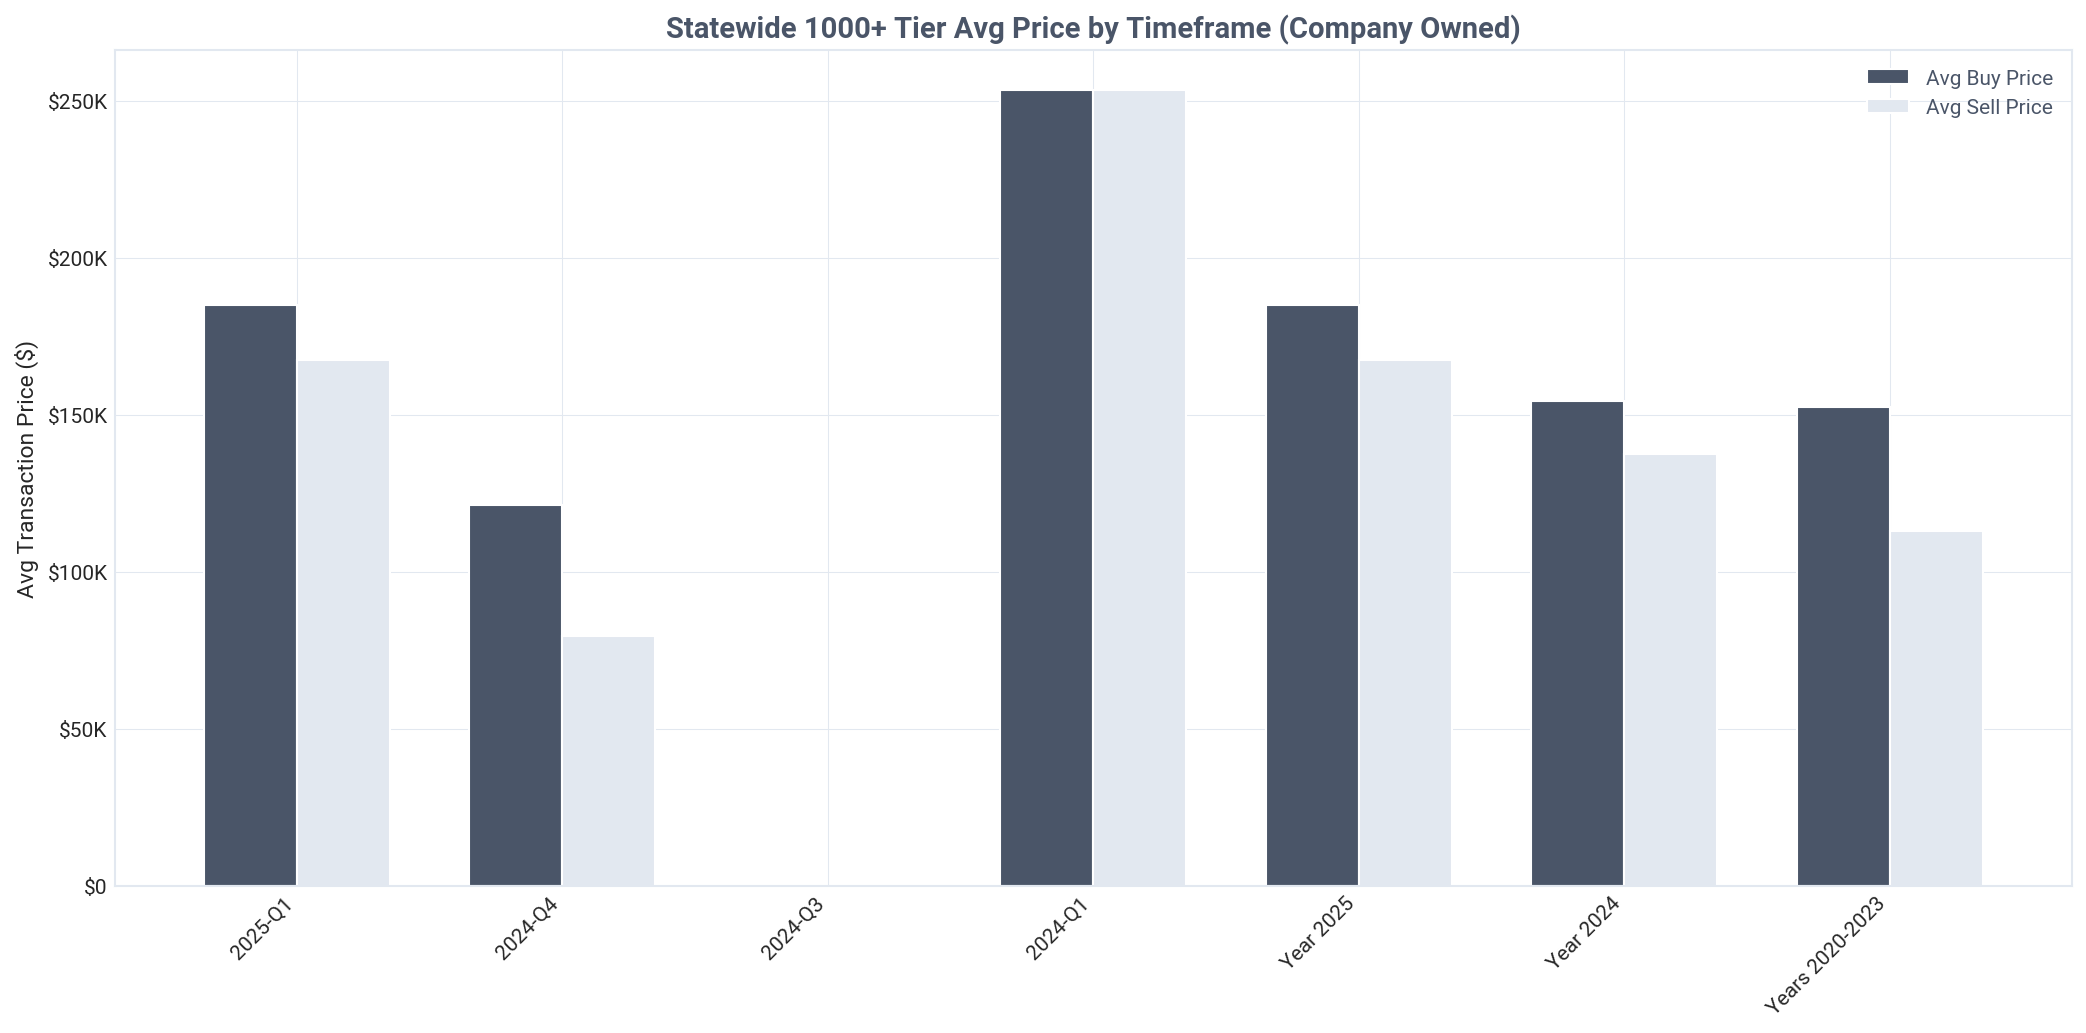
Maine: 1000+ tier company average prices, Q2 2026
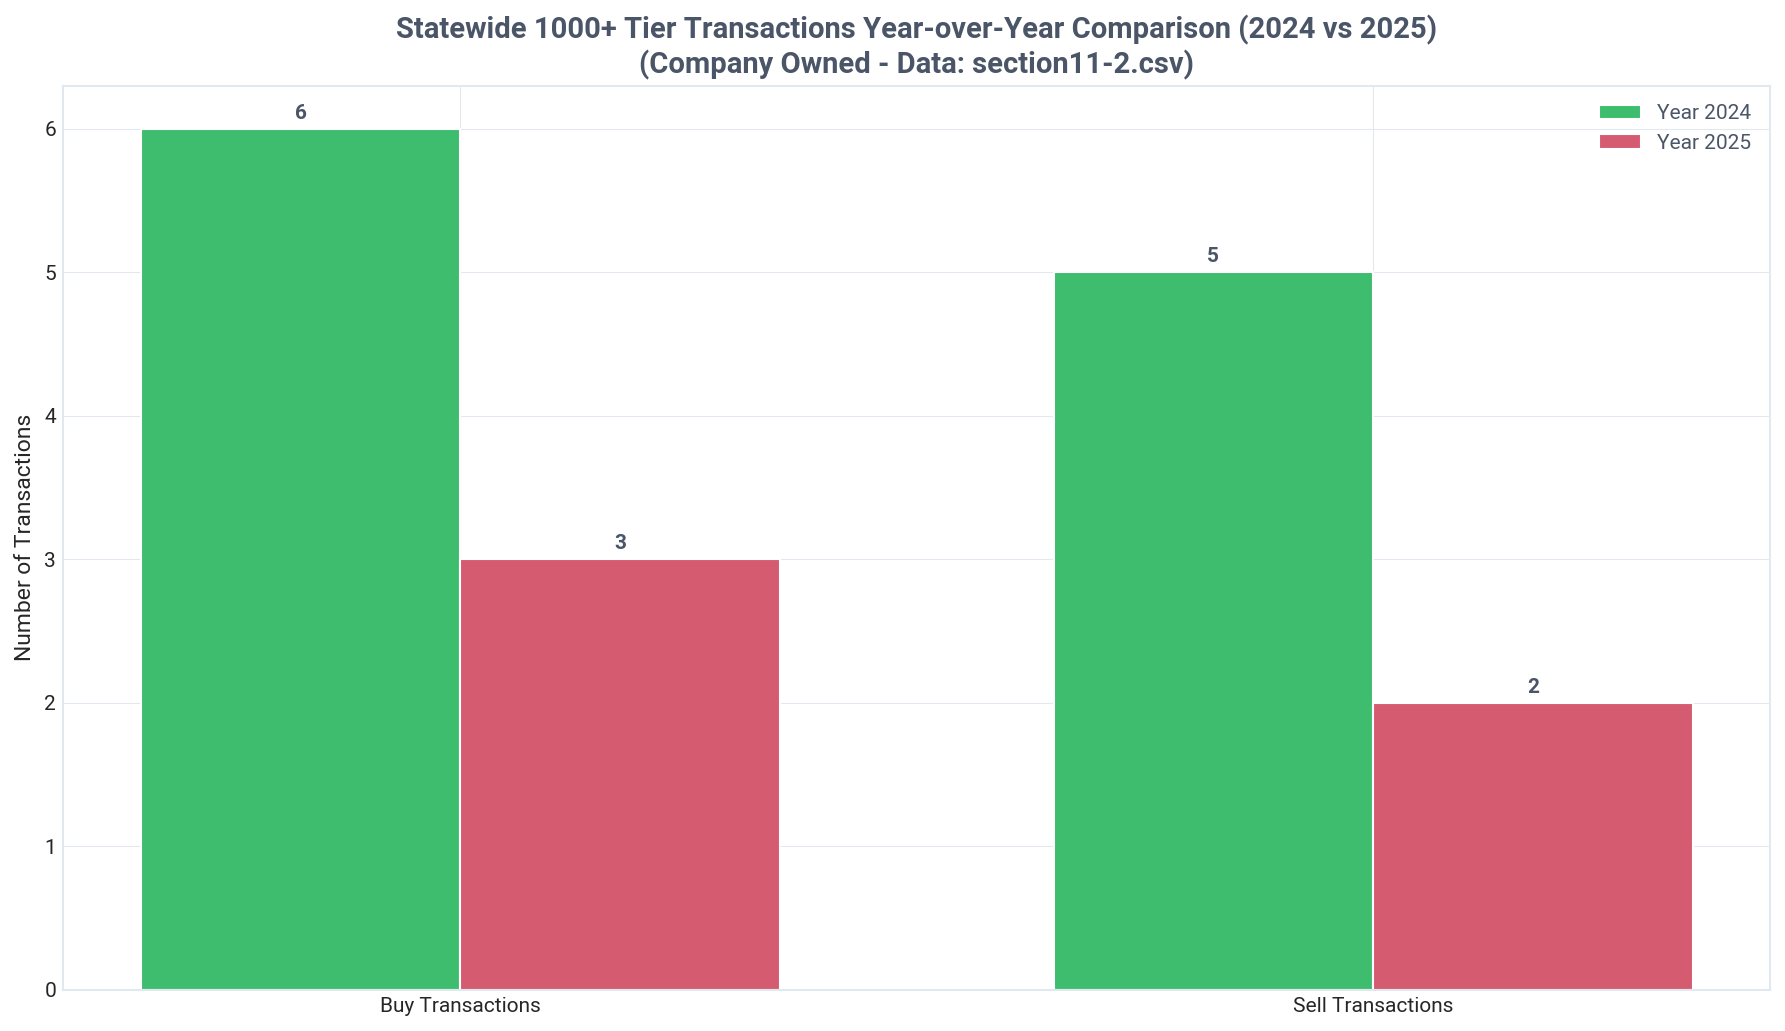
Maine: 1000+ tier transactions year over year, Q2 2026
Key Insight
Maine landlords are aggressive net buyers, acquiring 18 properties for every one they sold in Q2 2026.
Detailed Findings

Landlords in Maine are overwhelmingly in accumulation mode, demonstrating a strong net-buyer position. In Q2 2026, investors purchased 4,301 properties while selling only 237, resulting in a buy-to-sell ratio of 18.1 to 1. This aggressive expansion signals high confidence in the future of the state's rental market.

This strong net-buying trend is not a recent phenomenon. In 2025, landlords bought 20,016 SFRs and sold just 1,141, a net gain of 18,875 properties. Similarly, in 2024, they posted a net gain of 16,068 properties (17,194 buys vs. 1,126 sells). This consistent, high-volume acquisition has been a defining feature of the market for several years.

Even the state's very small institutional cohort (1,000+ properties) has been a net buyer, albeit on a micro scale. In 2025, this tier acquired 3 properties and sold 2, for a net gain of one. In 2024, they bought 6 and sold 5, also for a net gain of one. While the numbers are tiny, their direction aligns with the broader market trend of accumulation.

Transaction data from sources like mortgage transaction data providers can offer further insight into how these purchases are financed. Given the high rate of cash ownership seen in Section 5, it is likely that a significant portion of these acquisitions are also cash transactions, indicating a well-capitalized investor base.

The sustained and lopsided buying activity suggests a long-term strategic commitment to the Maine real estate market from a broad base of investors. The low sales volume also indicates that landlords are holding onto their assets, likely capitalizing on steady rent growth and property appreciation.

Current Quarter Transactions

Q2 2026 transaction analysis by tier, price, and inter-landlord activity

Key Insight
Investors were involved in 57.7% of all Maine's real estate transactions in Q2 2026.
Detailed Findings

In Q2 2026, landlords were a party to 4,301 of the 7,455 total SFR transactions in Maine, giving them a majority share of 57.7% of all market activity. This high level of participation underscores their critical role in providing market liquidity and setting pricing trends across the state.

Transaction volume is heavily concentrated in the single-property tier, which executed 4,160 transactions. This represents 96.7% of all investor transactions and confirms that new and first-time landlords are the primary engine of investor market activity.

Interestingly, these entry-level investors paid the highest average price among all tiers, at $455,287 per property. In contrast, smaller but more established landlords in the 11-20 property tier paid a significantly lower average of $125,016, suggesting they are targeting different types of properties, possibly in more affordable or rural locations.

Inter-landlord trading is not a major factor in Maine's market. Among the most active single-property tier, only 210 of their 4,160 purchases (5.0%) were sourced from other landlords. This indicates that investors are primarily buying properties from traditional homeowners, infusing new capital into the rental market rather than just circulating assets among existing players. For those looking to connect with these homeowners, using a skip tracing service can be effective.

Institutional investors logged zero transactions in Q2 2026, further highlighting their non-participation in the Maine market. The entire transaction landscape is defined by the activity of mom-and-pop investors, particularly those just starting or managing their first rental property.

Maine: landlord share of transactions, Q2 2026
Maine: transactions by tier this quarter, Q2 2026
Maine: average purchase price by tier, Q2 2026

Ready to leverage this data for your real estate investment decisions?

TALK TO AN EXPERT

Executive Summary

Maine's Housing Market Driven by an Onslaught of Small Investors Who Claimed Nearly 60% of Q2 Home Sales
Holdings
Landlords own 150,332 SFR properties, representing 30.9% of Maine's market. Individual investors overwhelmingly dominate, holding 90.3% of these properties (135,771) compared to the 13.1% (19,666) held by companies.
Pricing
In Q2 2026, landlords secured an 8.3% discount compared to homeowners, paying an average of $451,644 versus $492,352, a savings of $40,708 per home.
Activity
Investors purchased 59.6% of all homes sold in Q2 2026 (3,001 properties), an activity almost entirely driven by mom-and-pop landlords who accounted for 99.5% of these acquisitions. During the quarter, 4,133 new or expanding single-property landlord entities entered the market.
Market Share
Small mom-and-pop landlords (1-10 properties) control a staggering 99.4% of all investor-owned housing in Maine. In contrast, institutional investors (1000+ properties) have a negligible share of 0.0%.
Ownership Type
Individual investors dominate smaller portfolios, but companies become the majority owners at the 6-10 property tier. This signals a clear threshold where investors incorporate to continue scaling their operations.
Transactions
Landlords are aggressive net buyers with an 18.1x buy-to-sell ratio in Q2 2026 (4,301 buys vs. 237 sells). Even the tiny institutional segment has been a marginal net buyer over the past two years.
Market Narrative

The real estate investor market in Maine is defined by the overwhelming dominance of small, independent operators. Investors collectively own 150,332 single-family homes, which constitutes a significant 30.9% of the state's entire SFR housing stock. The ownership structure heavily favors individuals, who hold 90.3% of this portfolio, leaving only 13.1% for companies. This dynamic is further emphasized by the near-total control of mom-and-pop landlords (1-10 properties), who own 99.4% of investor-held properties, while large institutional investors are statistically absent with a 0.0% market share. It is a grassroots market built from the ground up by local investors, a trend confirmed by the latest Investor Pulse reports.
In Q2 2026, investor behavior was characterized by aggressive acquisition. Landlords purchased a remarkable 59.6% of all homes sold, demonstrating their position as the market's primary source of demand. This activity was almost entirely fueled by the smallest investors, with 99.5% of purchases made by mom-and-pop buyers and thousands of new landlords entering the market. Financially, they proved to be savvy buyers, securing an average 8.3% discount compared to traditional homeowners, a gap that widened from previous quarters. This accumulation is part of a long-term trend, as investors have been massive net buyers for years, with a powerful 18-to-1 buy-sell ratio in the most recent quarter. Modern proptech platforms are enabling these smaller investors to operate with greater efficiency.

The key takeaway from Maine's housing market is that it defies the national narrative of corporate landlord takeover. Instead, it is a highly decentralized and democratized market where growth is driven by a continuous influx of new, individual investors buying their first or second rental property. This creates a deeply embedded rental housing supply managed by local owners rather than distant corporations. While this provides stability, the high investor purchase rate also indicates intense competition for available housing stock, which directly impacts affordability and availability for prospective homeowners in the state.

About This Report

Report Methodology

This report analyzes BatchData's Investor Pulse dataset, covering single-family residential (SFR) investor activity across the United States.

Data is extracted from 15 CSV files covering ownership, transactions, and pricing trends, then analyzed using AI-powered insights.

Property Counting Methodology:

Distinct Counts: All headline totals represent distinct properties. If 2+ landlords co-own the same property, it's counted only once. This provides accurate market representation.

Category Breakdowns: When analyzing by tier (01-09), owner type (Individual/Corporate), or occupancy status, properties with co-ownership across categories are counted once per category. This causes breakdowns to sum 2-4% higher than totals, and percentages may sum to 100-104%. This is expected and reflects co-ownership patterns.

Tier Properties Category
01-041-10Mom-and-Pop
05-0711-100Mid-Size
08101-1000Large
091000+Institutional
About BatchData

BatchData provides comprehensive real estate data and analytics, offering insights into property ownership, investor activity, and market trends across the United States.

The Investor Pulse dataset tracks single-family residential (SFR) investor behavior at national, state, county, and MSA levels.

For more information, visit batchdata.io or explore our API documentation.

Data Freshness
Report Generated October 28, 2026 at 11:24 PM
Data Period Q2 2026
Geography Level State
Geography Maine
×
Chart Section2 Coverage
Maine: SFR vs other property coverage, Q2 2026
×
Chart Section3 Ownership Donut
Maine: SFR ownership share, company vs individual, Q2 2026
×
Chart Section3 Ownership Bar
Maine: SFR properties by owner type, Q2 2026
×
Chart Section4 Distribution
Maine: company vs individual landlords, Q2 2026
×
Chart Section5 Holdings
Maine: landlord SFR holdings by type, Q2 2026
×
Chart Section6 Prices
Maine: properties purchased by timeframe, Q2 2026
×
Chart Section6 Prices Alt
Maine: average acquisition price by timeframe, Q2 2026
×
Chart Section6 Yoy Comparison
Maine: average acquisition price year over year, Q2 2026
×
Chart Section6 Trends
Maine: average acquisition price by buyer type, Q2 2026
×
Chart Section7 Purchases
Maine: purchases by tier, Q2 2026
×
Chart Section7 Tiers
Maine: purchased property share by tier, Q2 2026
×
Chart Section8 Distribution
Maine: current ownership by purchase tier, Q2 2026
×
Chart Section8 Prices
Maine: properties purchased by tier, all time, Q2 2026
×
Chart Section8 Prices Q4
Maine: properties purchased by tier this quarter, Q2 2026
×
Chart Section8 Prices 2020
Maine: properties purchased by tier, historical, Q2 2026
×
Chart Section8 Yoy Comparison
Maine: properties purchased by tier year over year, Q2 2026
×
Chart Section9 Ownership
Maine: ownership by tier and owner type, Q2 2026
×
Chart Section9 Growth
Maine: company purchases by tier, all time, Q2 2026
×
Chart Section9 Growth Q4
Maine: company purchases by tier this quarter, Q2 2026
×
Chart Section9 Yoy Comparison
Maine: company purchases by tier year over year, Q2 2026
×
Chart Section10 Top Regions
Maine: top 15 areas by landlord-owned properties, Q2 2026
×
Chart Section10 Top Pct
Maine: top 15 areas by landlord ownership share, Q2 2026
×
Chart Section10 Map
Maine: landlord ownership map, Q2 2026
×
Chart Section11 Buysell
Maine: landlord buy and sell transactions, Q2 2026
×
Chart Section11 Buysell Price
Maine: landlord average buy and sell prices, Q2 2026
×
Chart Section11 Yoy All Landlords
Maine: landlord transactions year over year, Q2 2026
×
Chart Section11 Institutional
Maine: 1000+ tier company transactions, Q2 2026
×
Chart Section11 Institutional Price
Maine: 1000+ tier company average prices, Q2 2026
×
Chart Section11 Yoy Institutional
Maine: 1000+ tier transactions year over year, Q2 2026
×
Chart Section12 Transactions
Maine: landlord share of transactions, Q2 2026
×
Chart Section12 Prices
Maine: transactions by tier this quarter, Q2 2026
×
Chart Section12 Prices Detail
Maine: average purchase price by tier, Q2 2026

Licensing & Usage Rights

This report, data, and all visual analyses are the property of BatchData © 2026 BatchService, Inc. and are licensed under Creative Commons Attribution-NonCommercial-NoDerivatives 4.0 International (CC BY-NC-ND 4.0).

You MAY: Download, share, or excerpt this content for personal or non-commercial purposes, provided you give clear attribution to BatchData with a link back to this original page.

You MAY NOT: Use this data commercially, resell or redistribute it as your own, or publish modified versions.

For commercial licensing: batchdata.io/contact-sales

Creative Commons BY-NC-ND 4.0 - creativecommons.org/licenses/by-nc-nd/4.0/

How to cite this report

BatchData. (2026). Q2 2026 ME State Report. BatchService, Inc. Retrieved from https://reports.batchdata.io/investorpulse-reports/2026-q2-state-me/. Licensed under CC BY-NC-ND 4.0.