Maryland Investor Pulse Report (2026-Q2)

Real Estate comprehensive investment analysis of investor activity in the Maryland single-family residential housing market. Discover ownership trends, transaction patterns, and market insights.

Market Overview

Total SFR Properties in Maryland
1,715,109
Total Investors in Maryland
235,513
Investor Owned SFR in Maryland
225,121(13.1%)
Individual Landlords
Landlords
203,968
SFR Owned
163,608
Corporate Landlords
Landlords
31,545
SFR Owned
64,451
Understanding Property Counts

Distinct Count Methodology: The total 225,121 represents distinct properties - if 2+ landlords co-own the same property, it's counted only once. This provides the most accurate representation of investor-owned SFR properties.

Why totals don't sum: When broken down by Individual vs Corporate ownership (or by tier), properties with co-ownership across categories are counted once per category. For example, if a property is co-owned by an individual AND a corporate landlord, it appears in both counts. This is why Individual + Corporate totals may exceed the distinct total by 2-4%, and percentages may sum to 100-104%.

Market Visualization

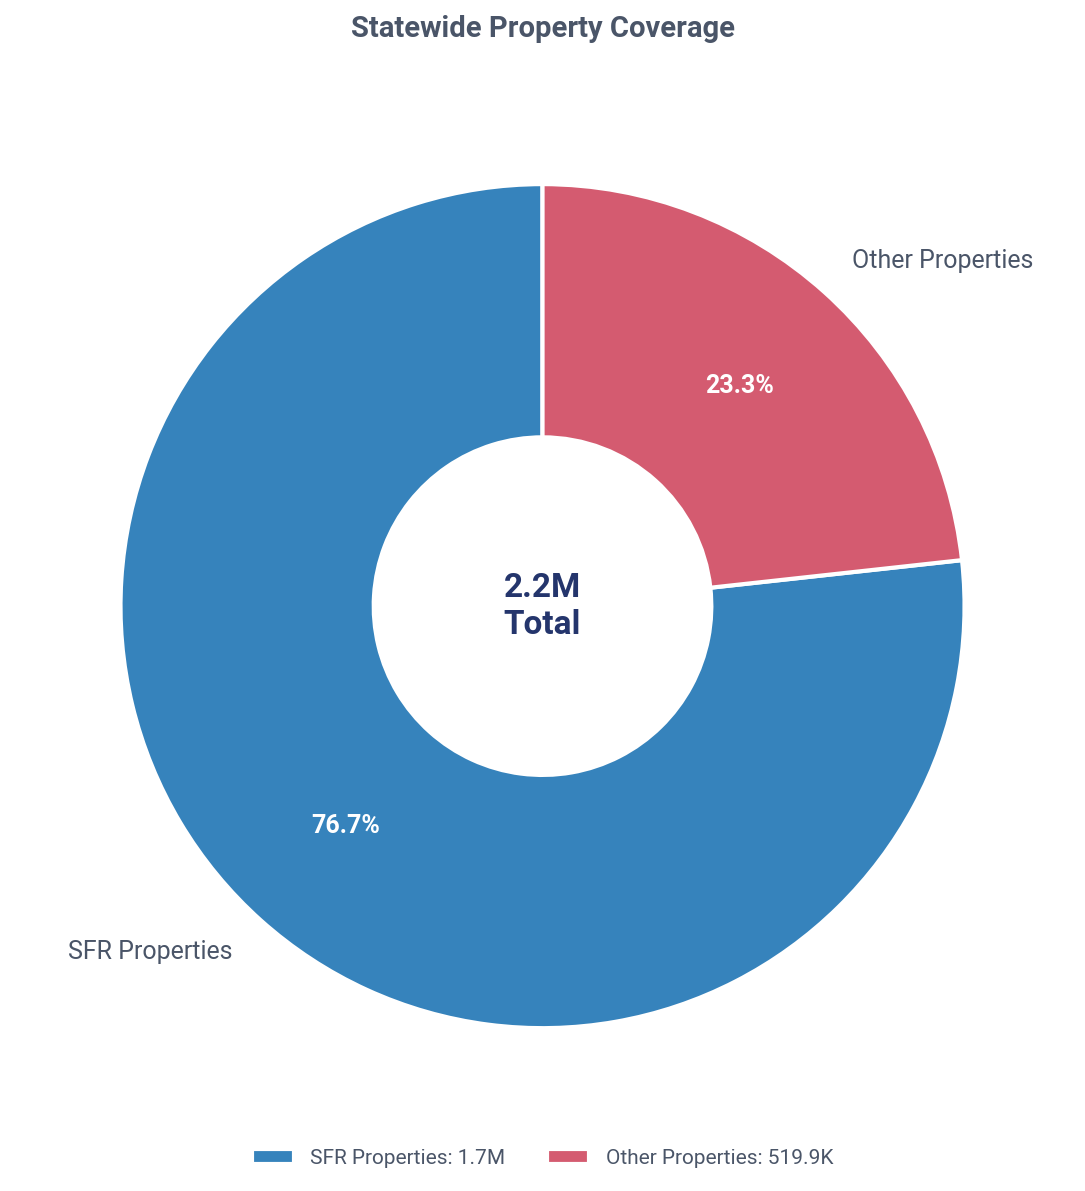
Maryland: SFR vs other property coverage, Q2 2026
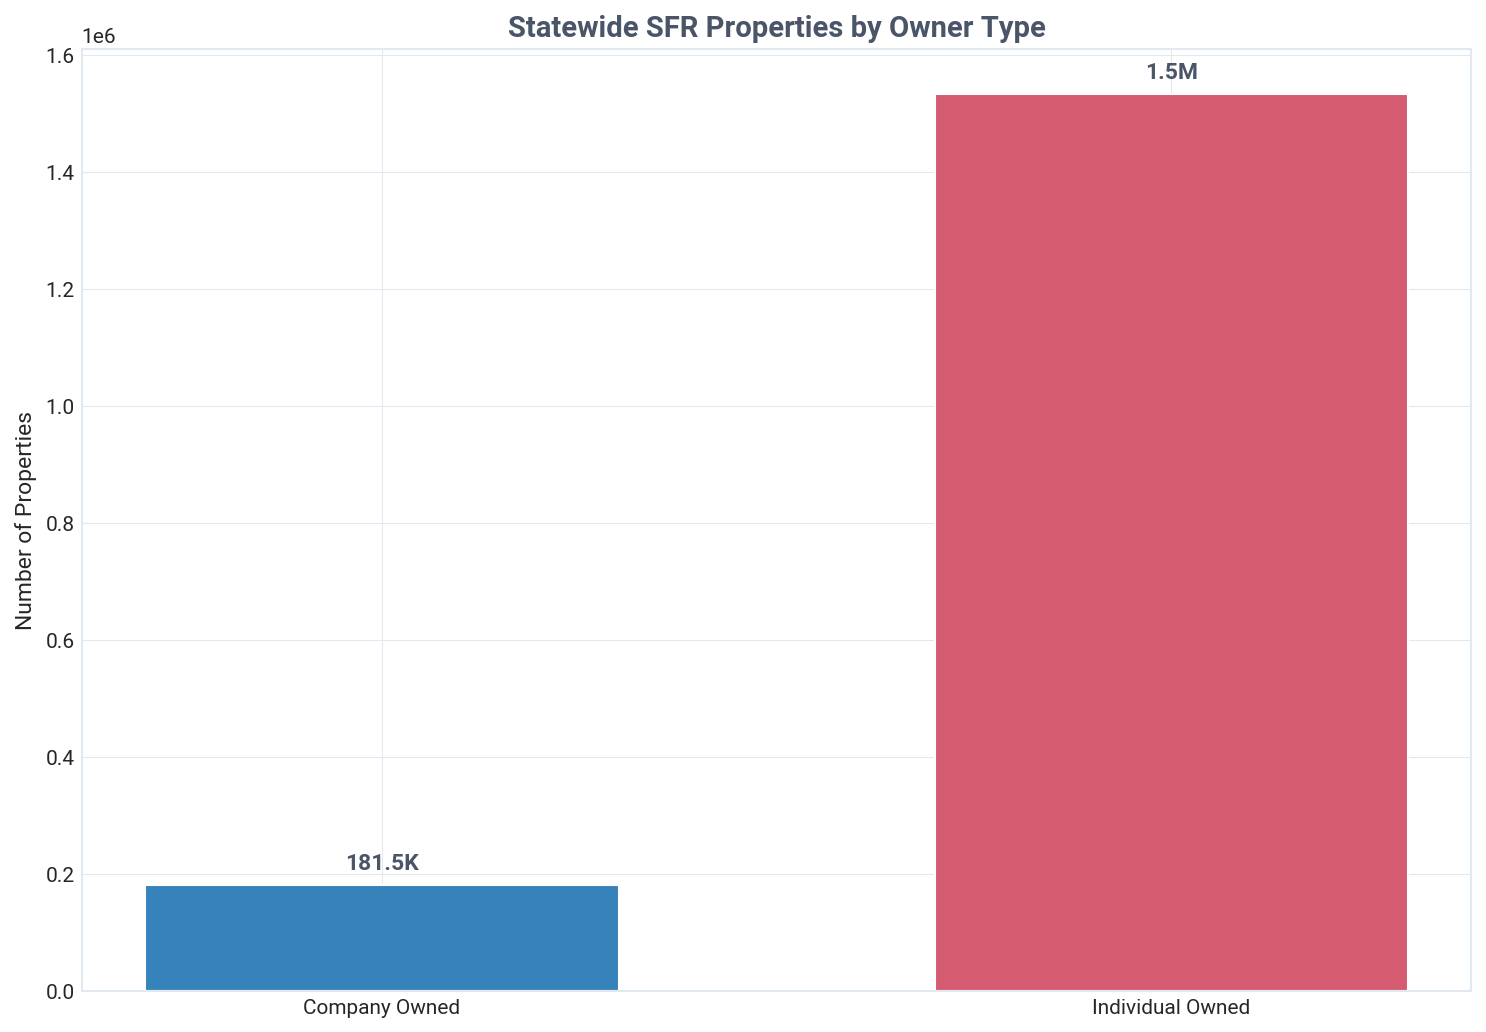
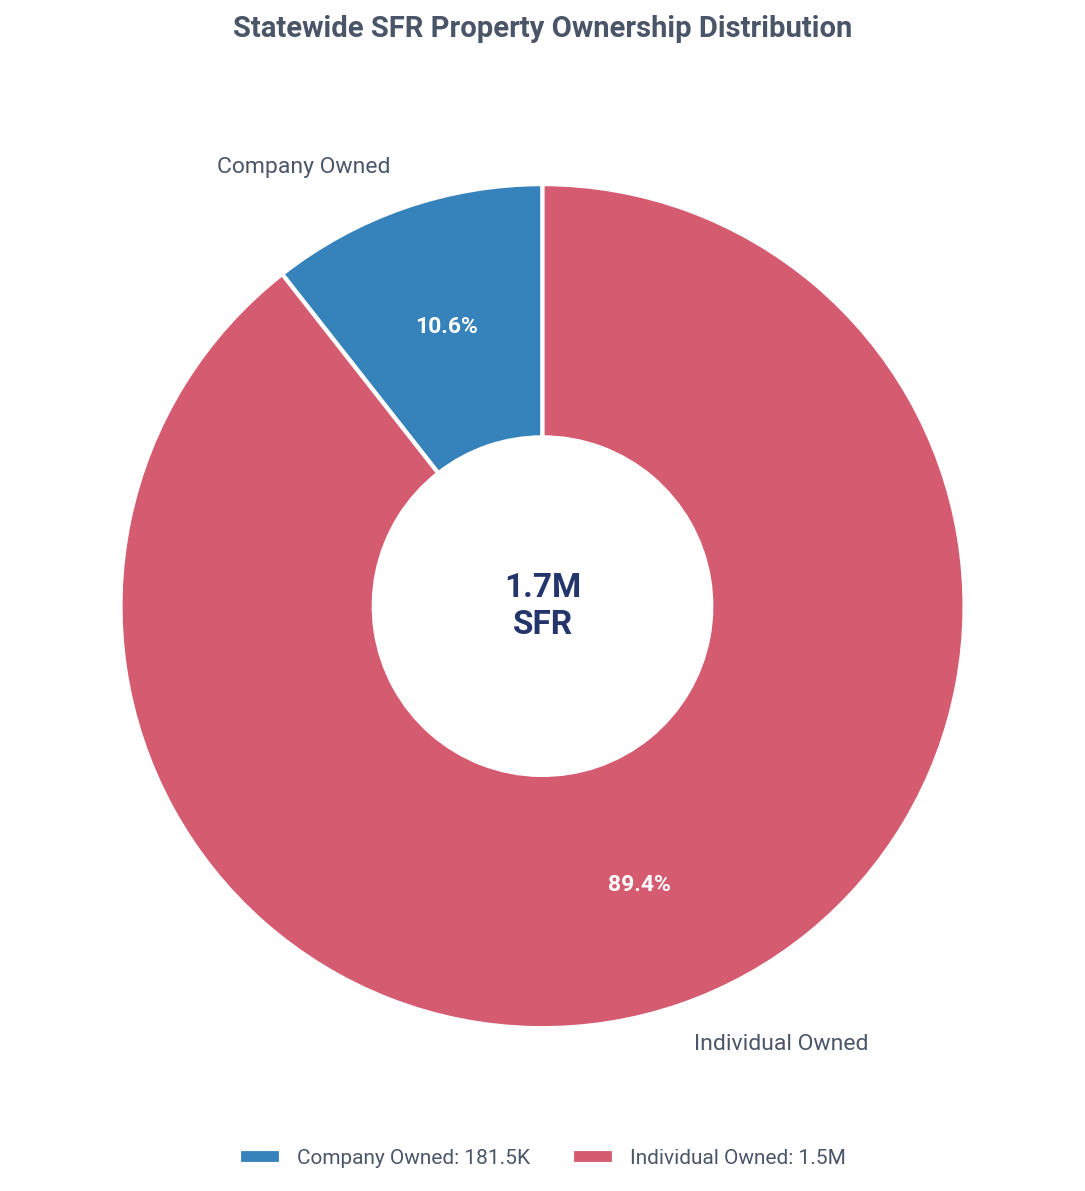
Maryland: SFR ownership share, company vs individual, Q2 2026
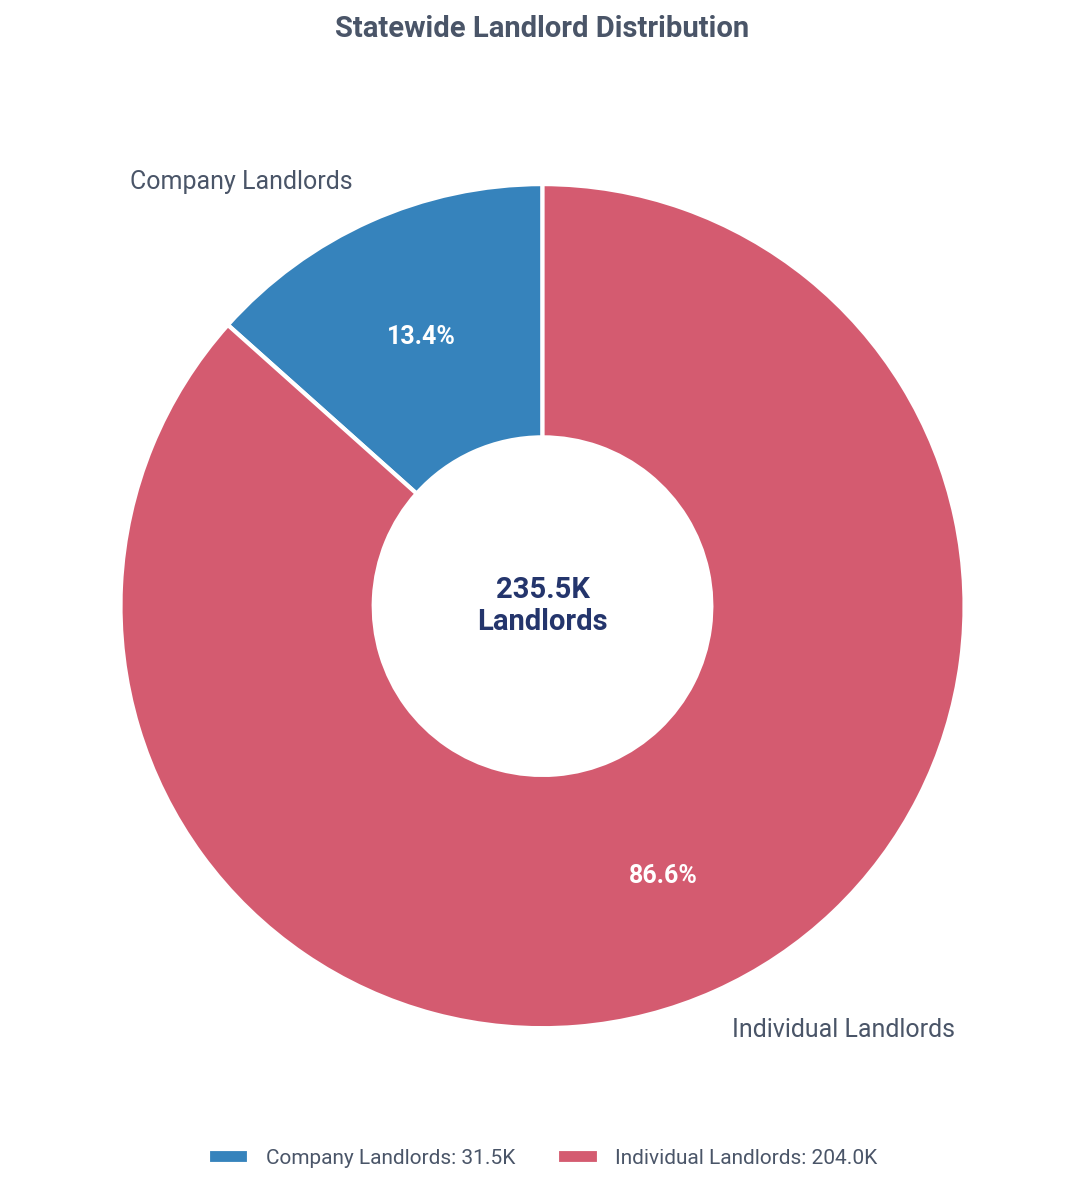
Maryland: company vs individual landlords, Q2 2026

Key Market Insights

Small Landlords Dominate Maryland's SFR Market, Controlling 90% of Investor Housing and Securing 33% Purchase Discounts
Investors own 13.1% of Maryland's SFR market (225,121 properties), with mom-and-pop landlords controlling 89.9% versus just 0.5% for institutions. In Q2 2026, landlords purchased 15.3% of all homes sold at a 33.2% discount compared to homeowners and acted as strong net buyers, signaling continued market growth.
Landlord Owned Current Holdings
Investors own 225,121 Maryland SFRs, with individual landlords holding a 72.7% majority.
Of these holdings, 63.6% (143,180 properties) are owned free-and-clear with cash, indicating significant equity. A massive 96.4% of the investor-owned portfolio is designated as rented, highlighting a strong focus on providing rental housing.
Landlord vs Traditional Homeowners
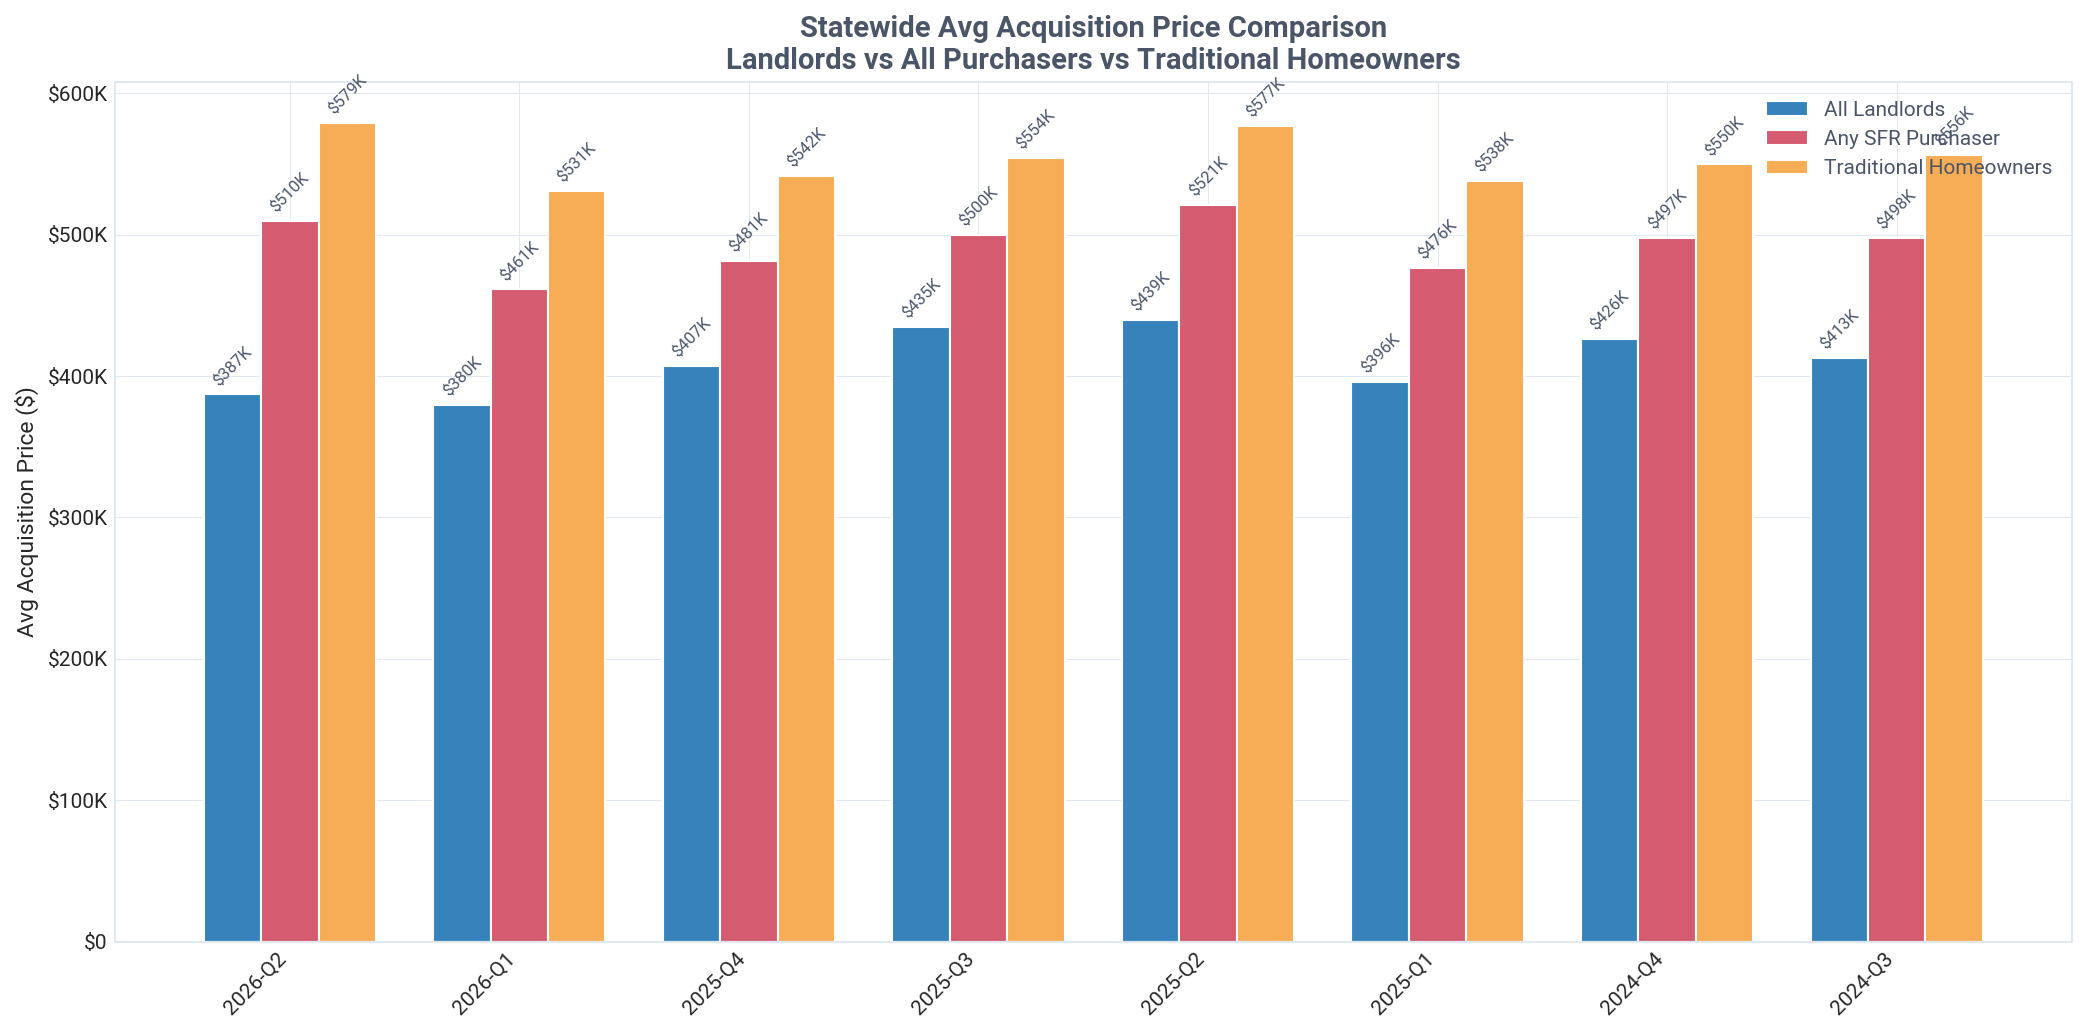
Maryland landlords paid 33.2% less than homeowners in Q2 2026, a $192,134 discount.
This price gap has widened dramatically from just 21.5% in Q3 2025, showing an increasing investor advantage. Landlord acquisition prices have appreciated 11.1% since the 2020-2023 period, rising from an average of $348,388 to $386,973.
Current Quarter Purchases
Landlords acquired 15.3% of all Maryland SFRs sold in Q2 2026, totaling 2,748 properties.
Mom-and-pop investors drove this activity, responsible for 77.4% of all landlord purchases. In a sign of a growing market, 1,726 new single-property landlord entities purchased their first investment property in Maryland this quarter.
Ownership by Tier
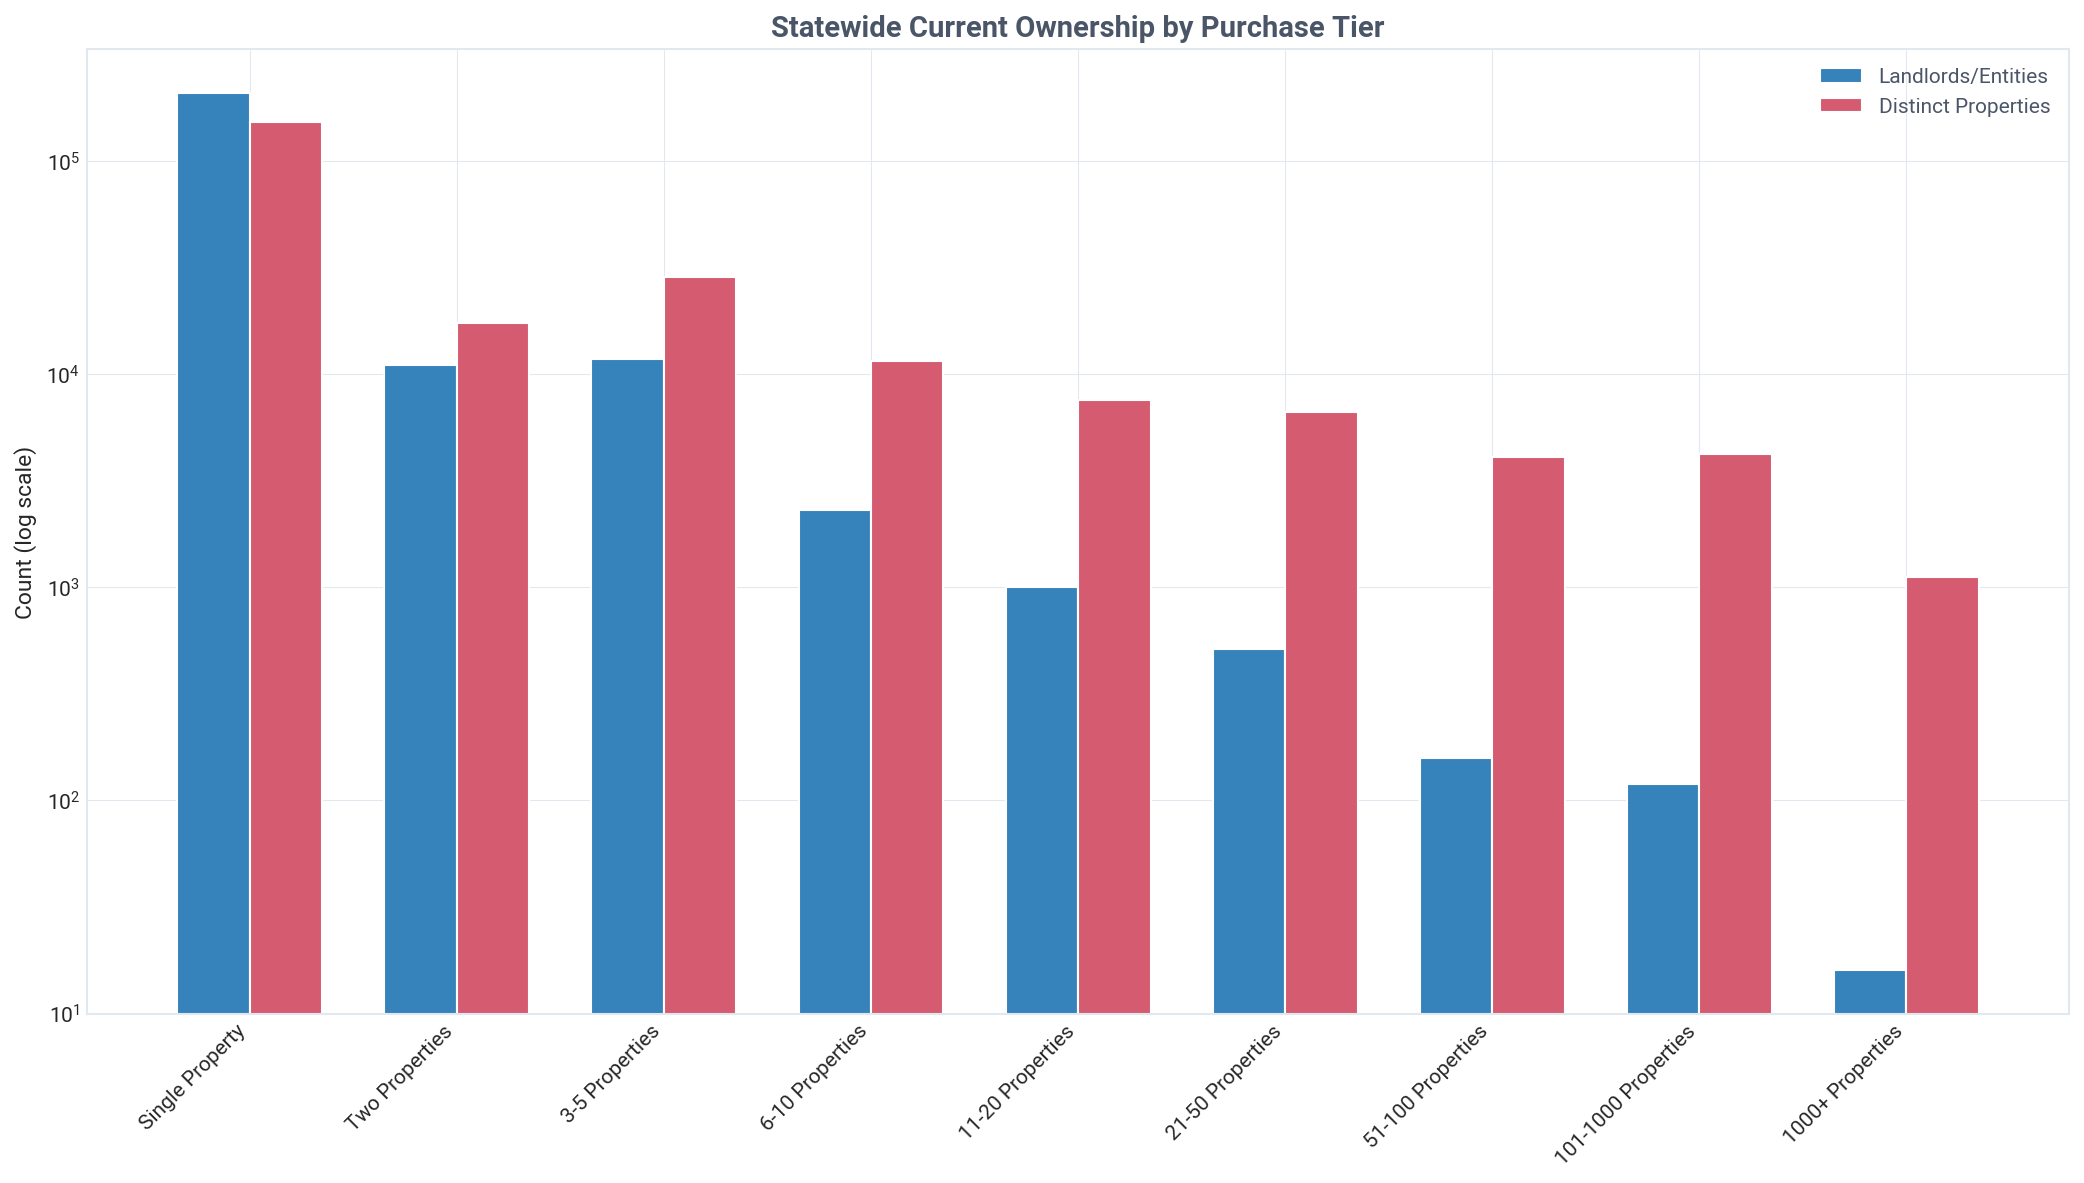
Mom-and-pop landlords control a staggering 89.9% of Maryland's investor-owned SFR housing.
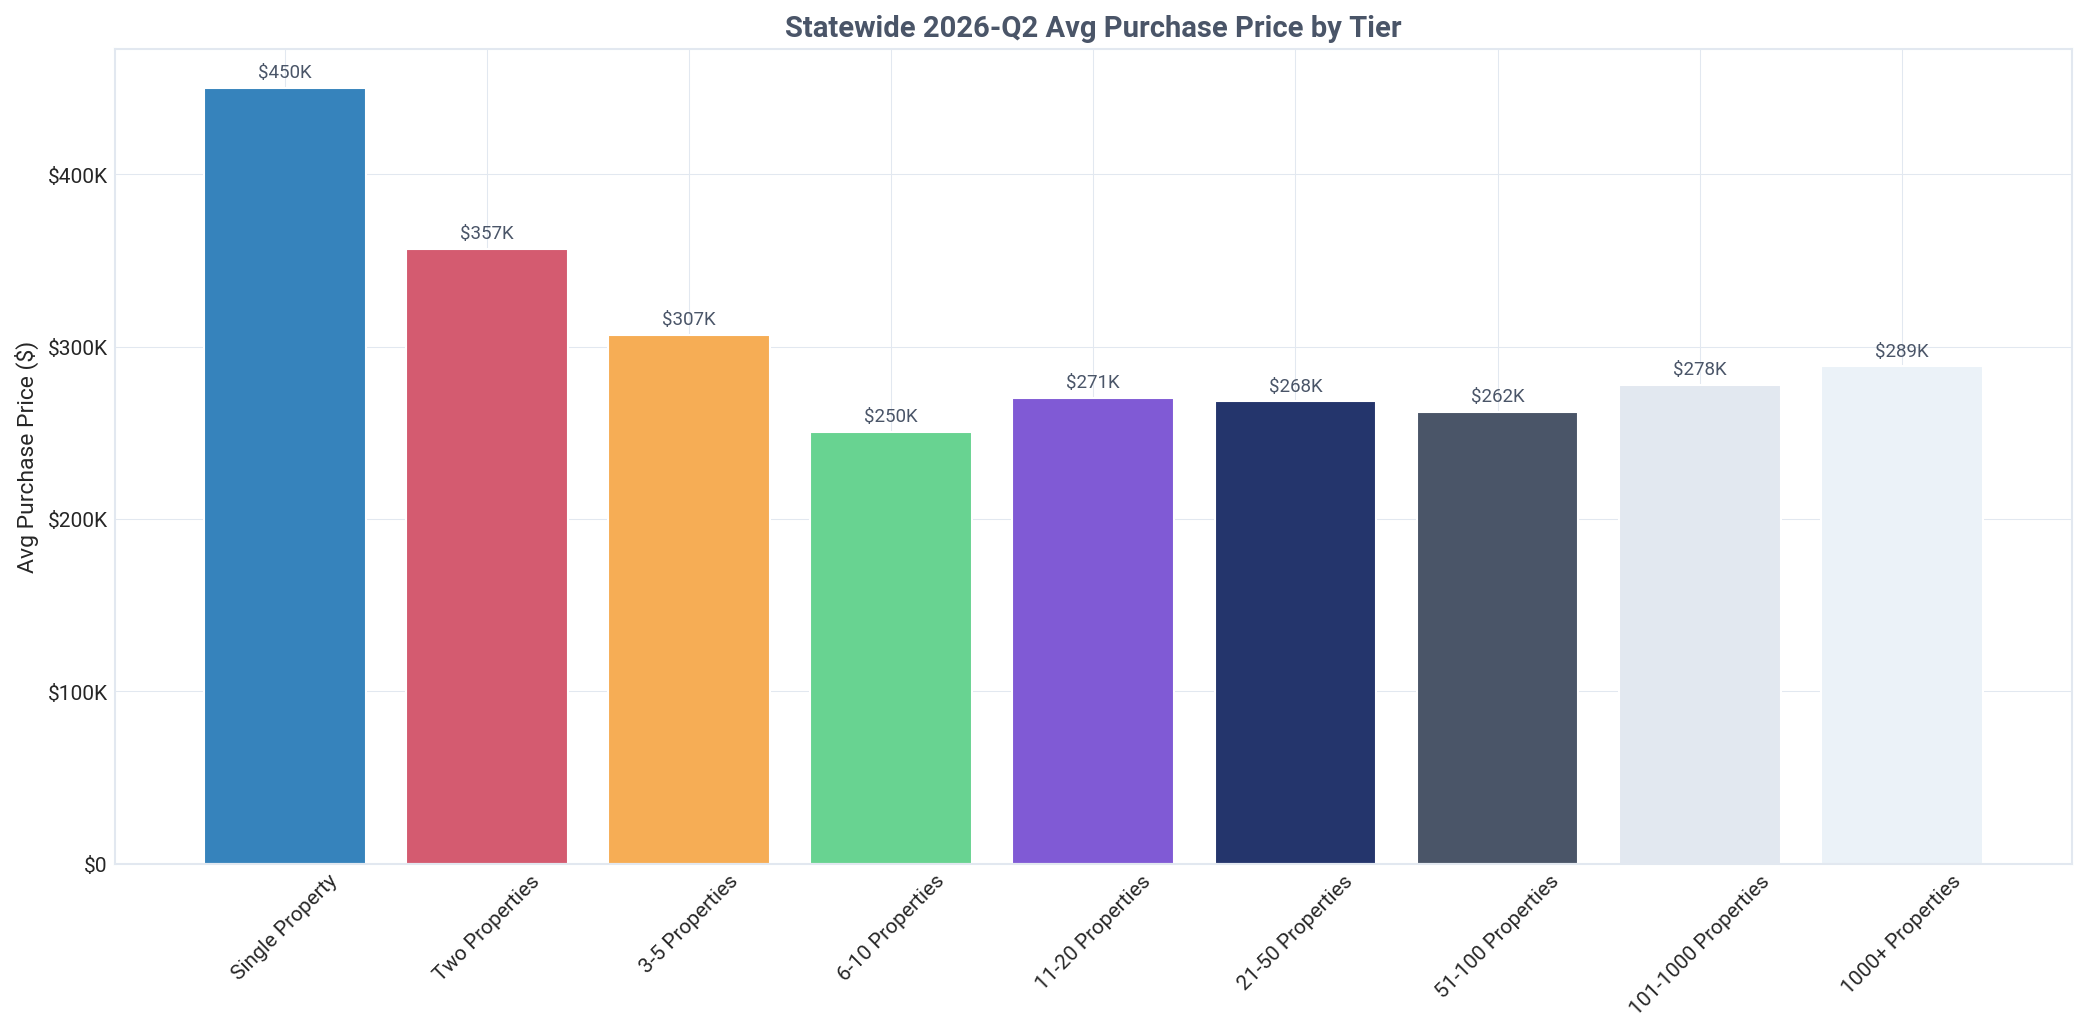
Institutional investors (1000+ properties) own just 0.5% of the portfolio, challenging the narrative of a corporate takeover. New single-property buyers in Q2 2026 paid an average of $450,308, significantly more than the $288,558 paid by institutions.
Ownership by Tier & Type
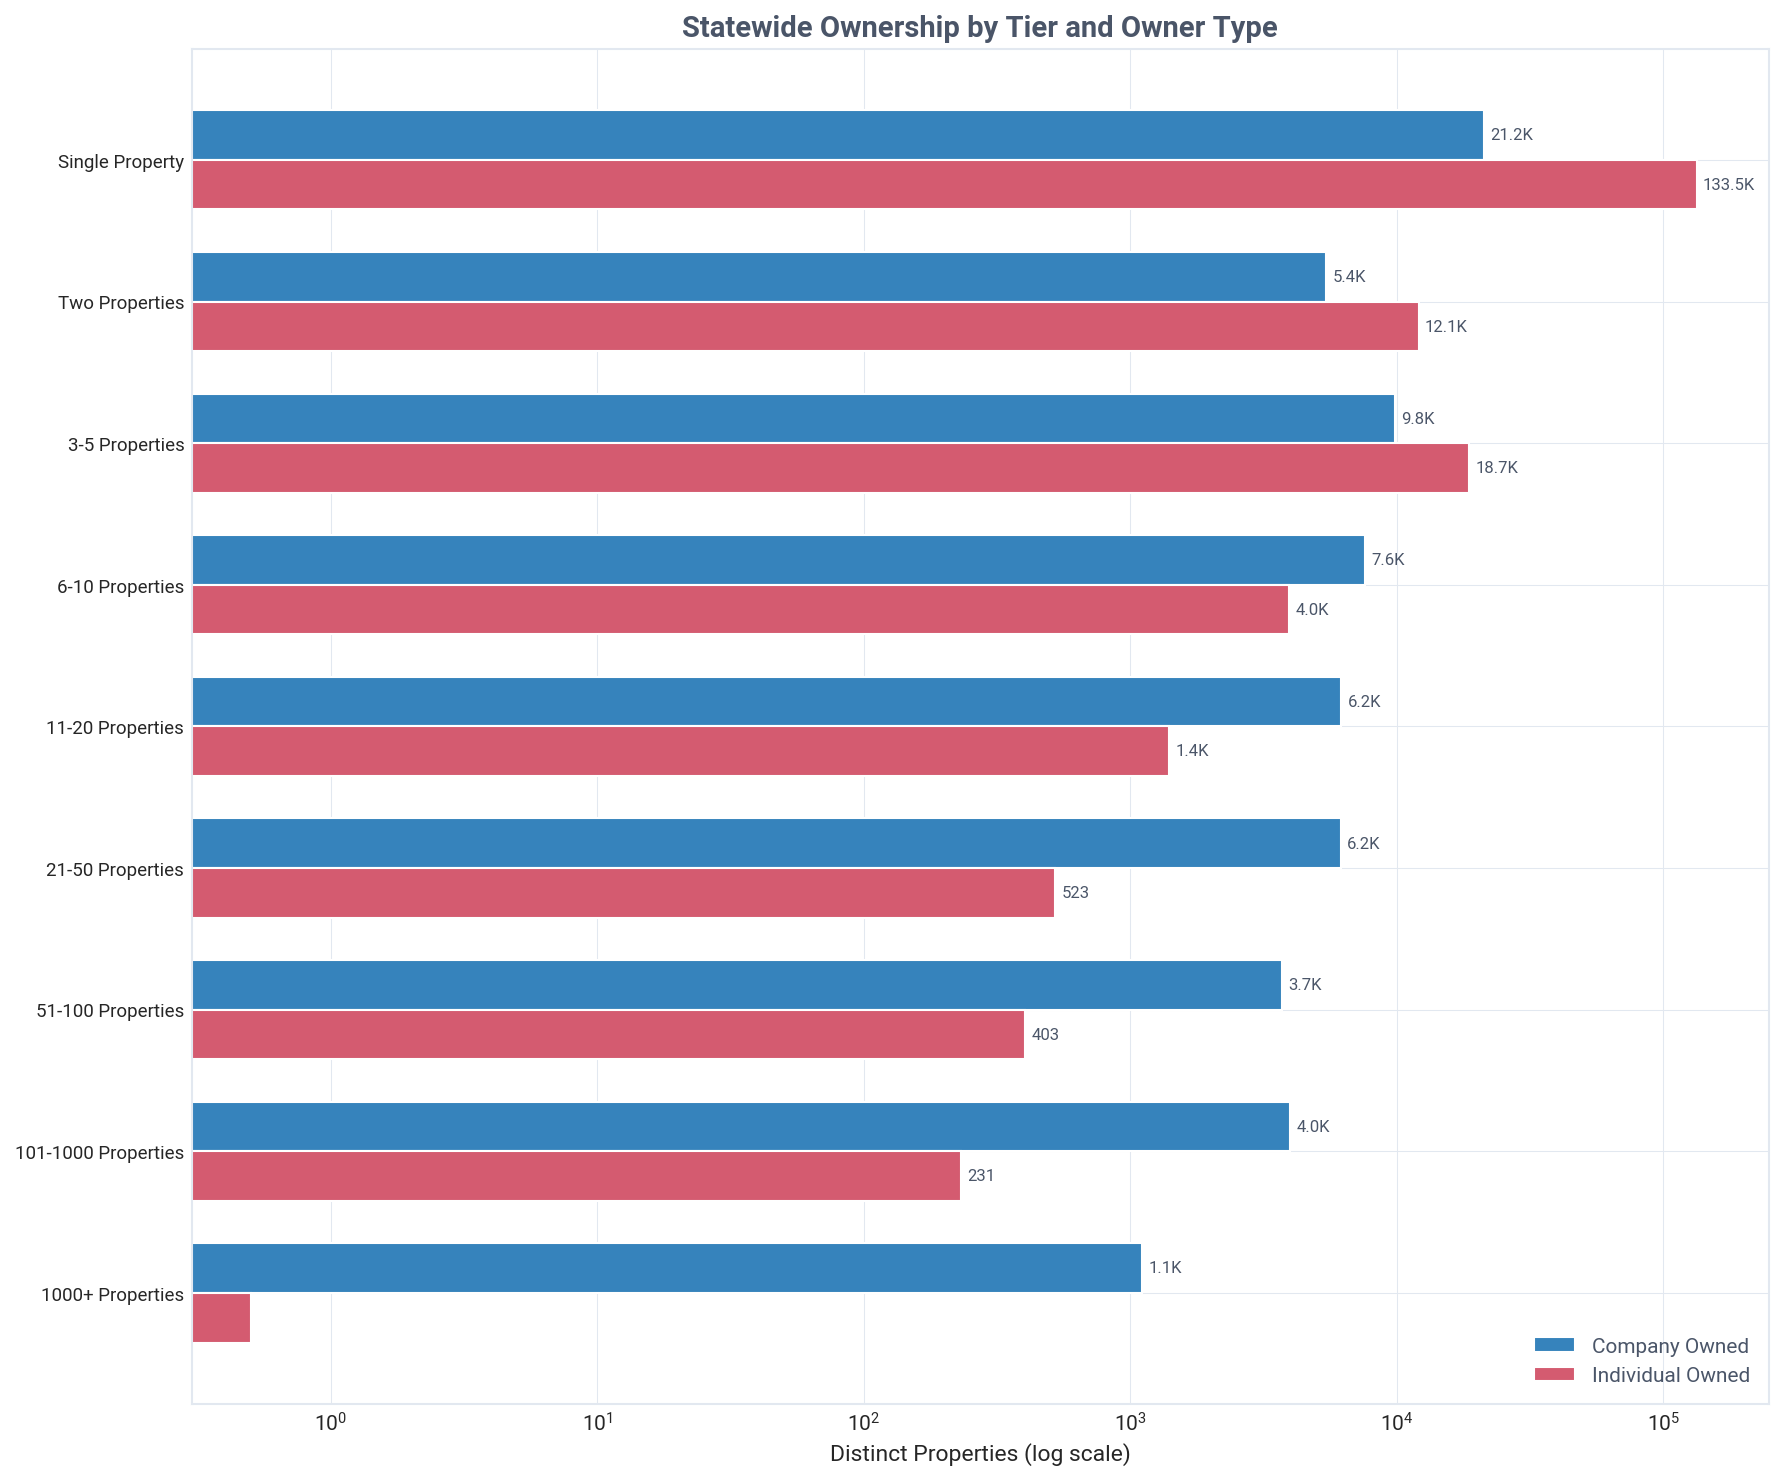
Individuals dominate small portfolios, but companies become the majority owner at the 6-10 property tier.
In the 6-10 property tier, companies own 65.8% of properties, a figure that rises to over 90% for portfolios with 51 or more homes. Individuals own 86.3% of all single-property investments, forming the market's base.
Geographic Distribution
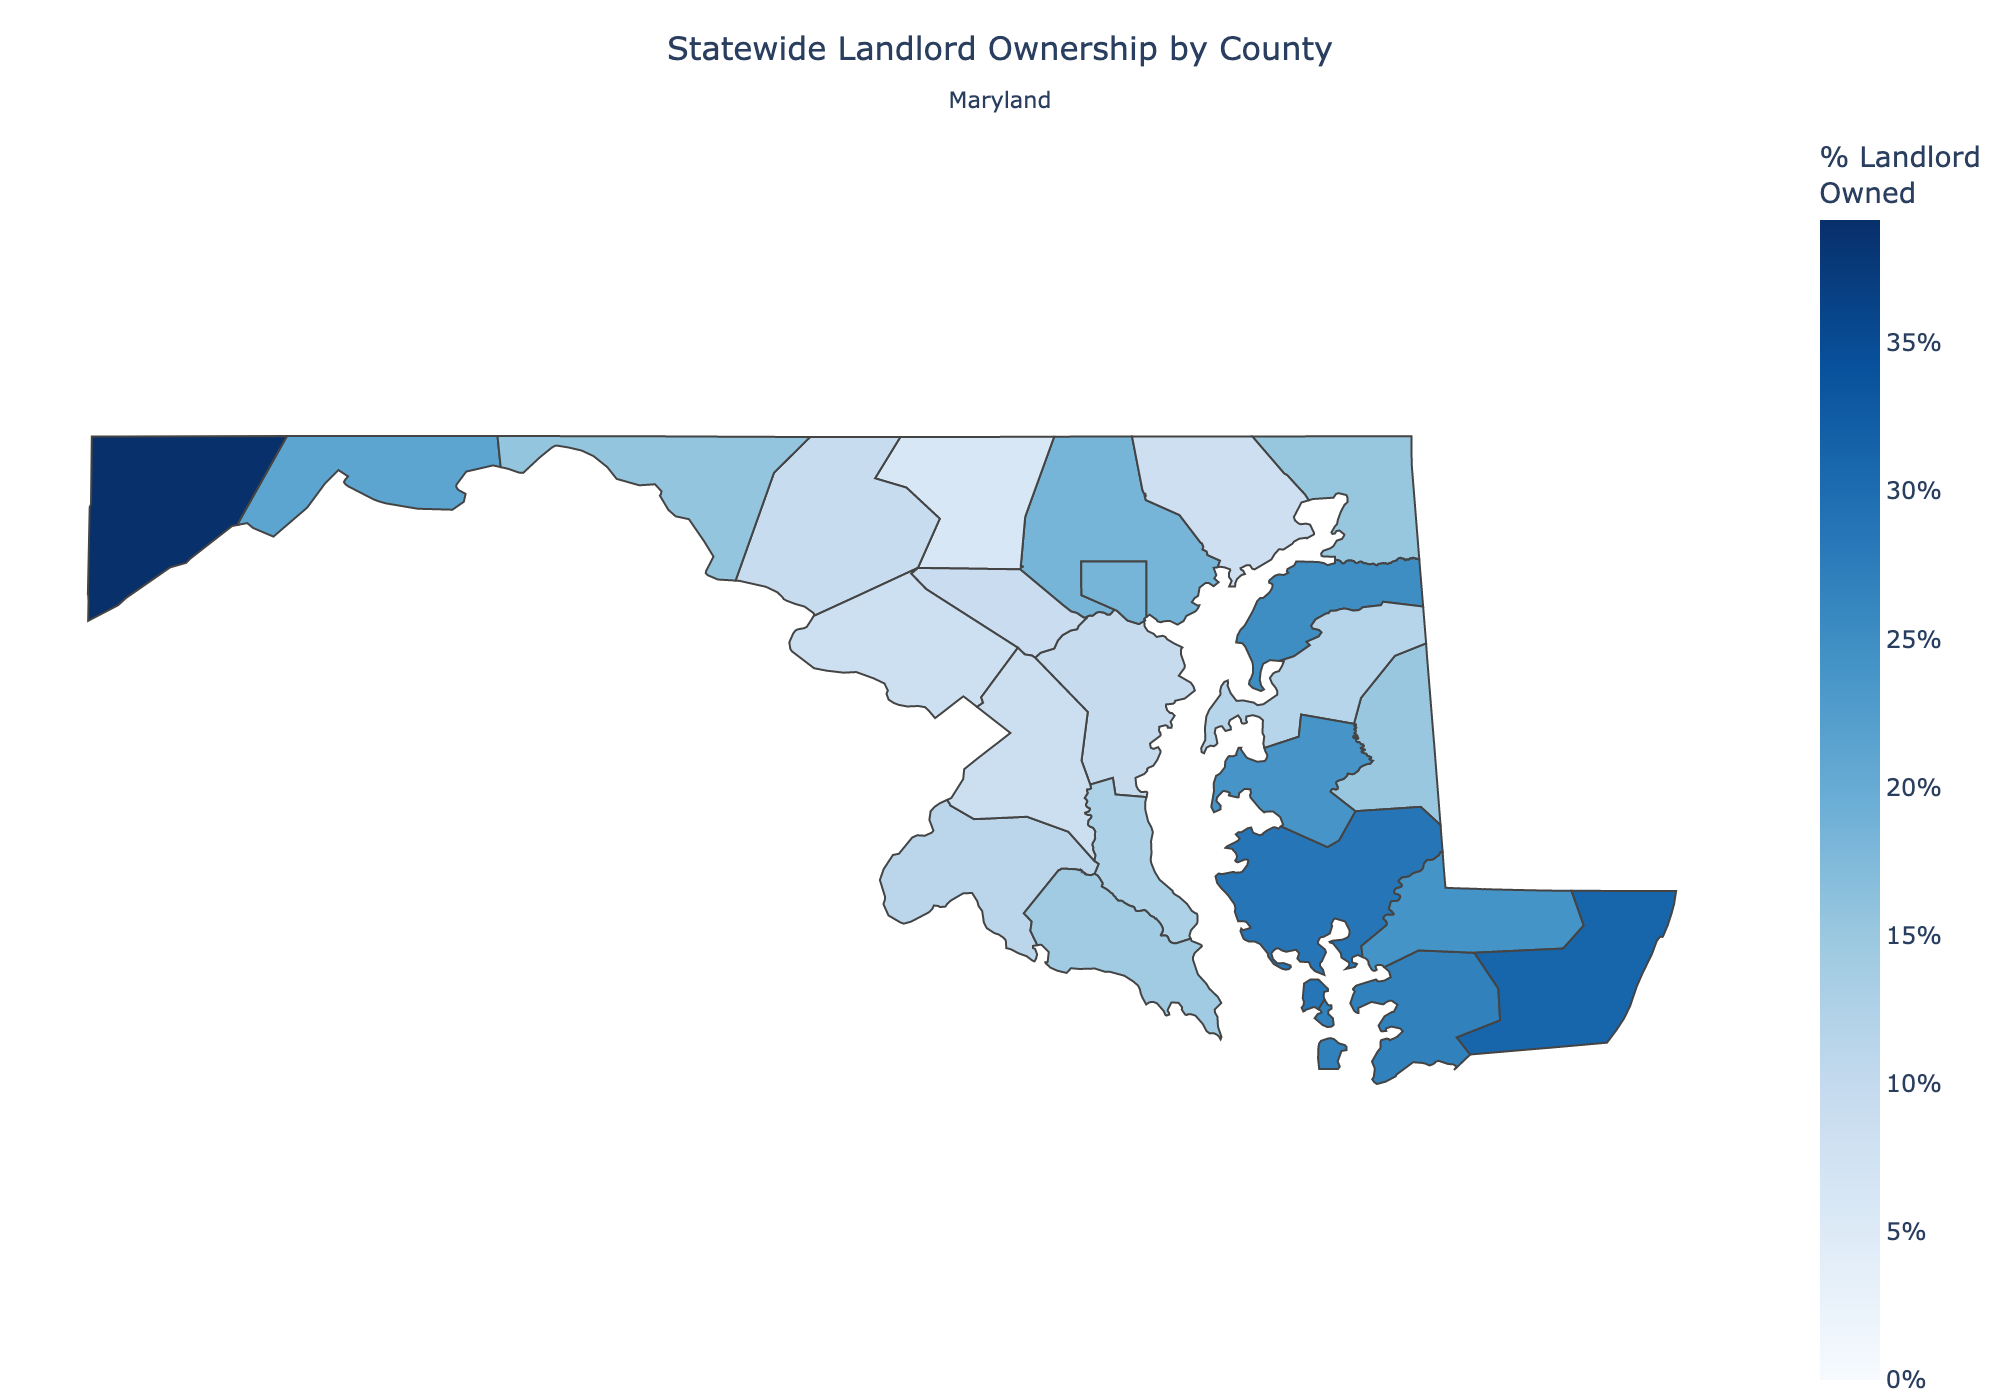
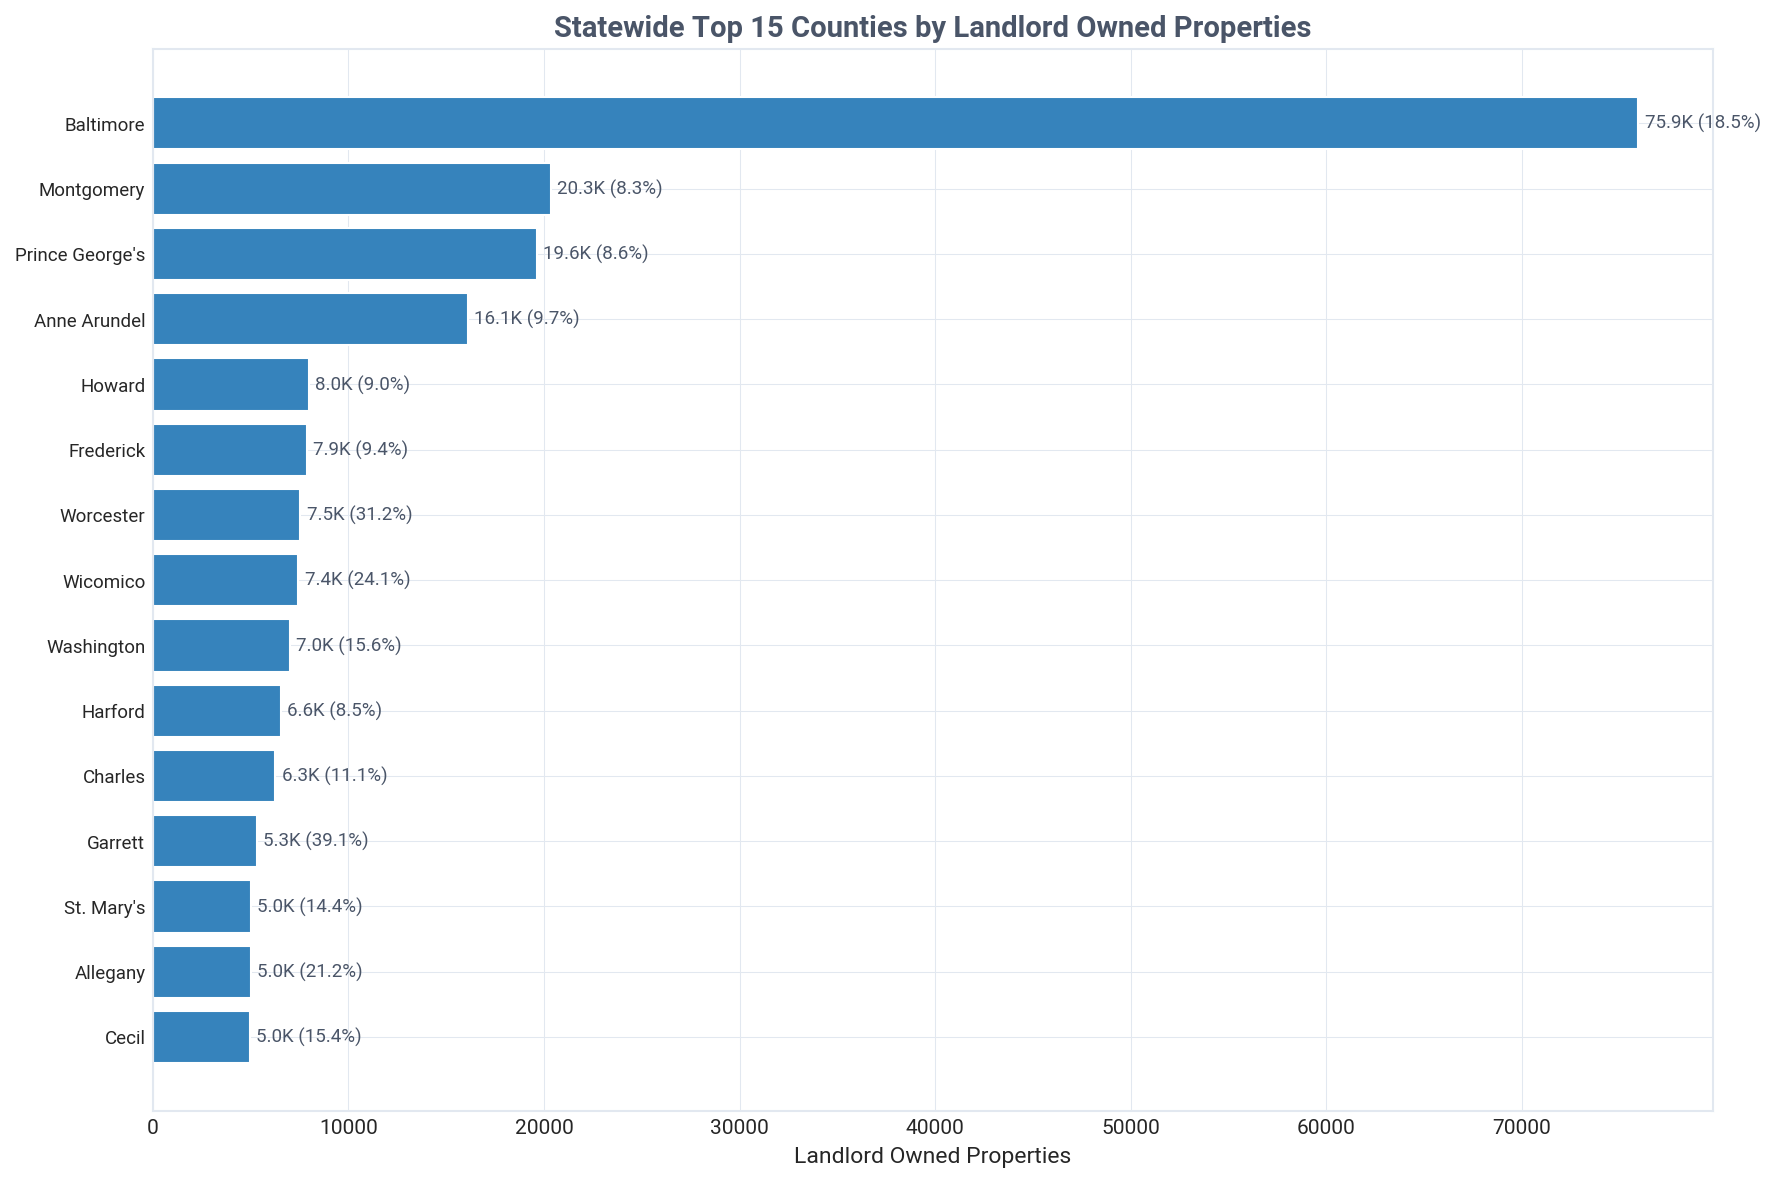
Baltimore City is the epicenter of investor ownership by volume, with 75,946 properties.
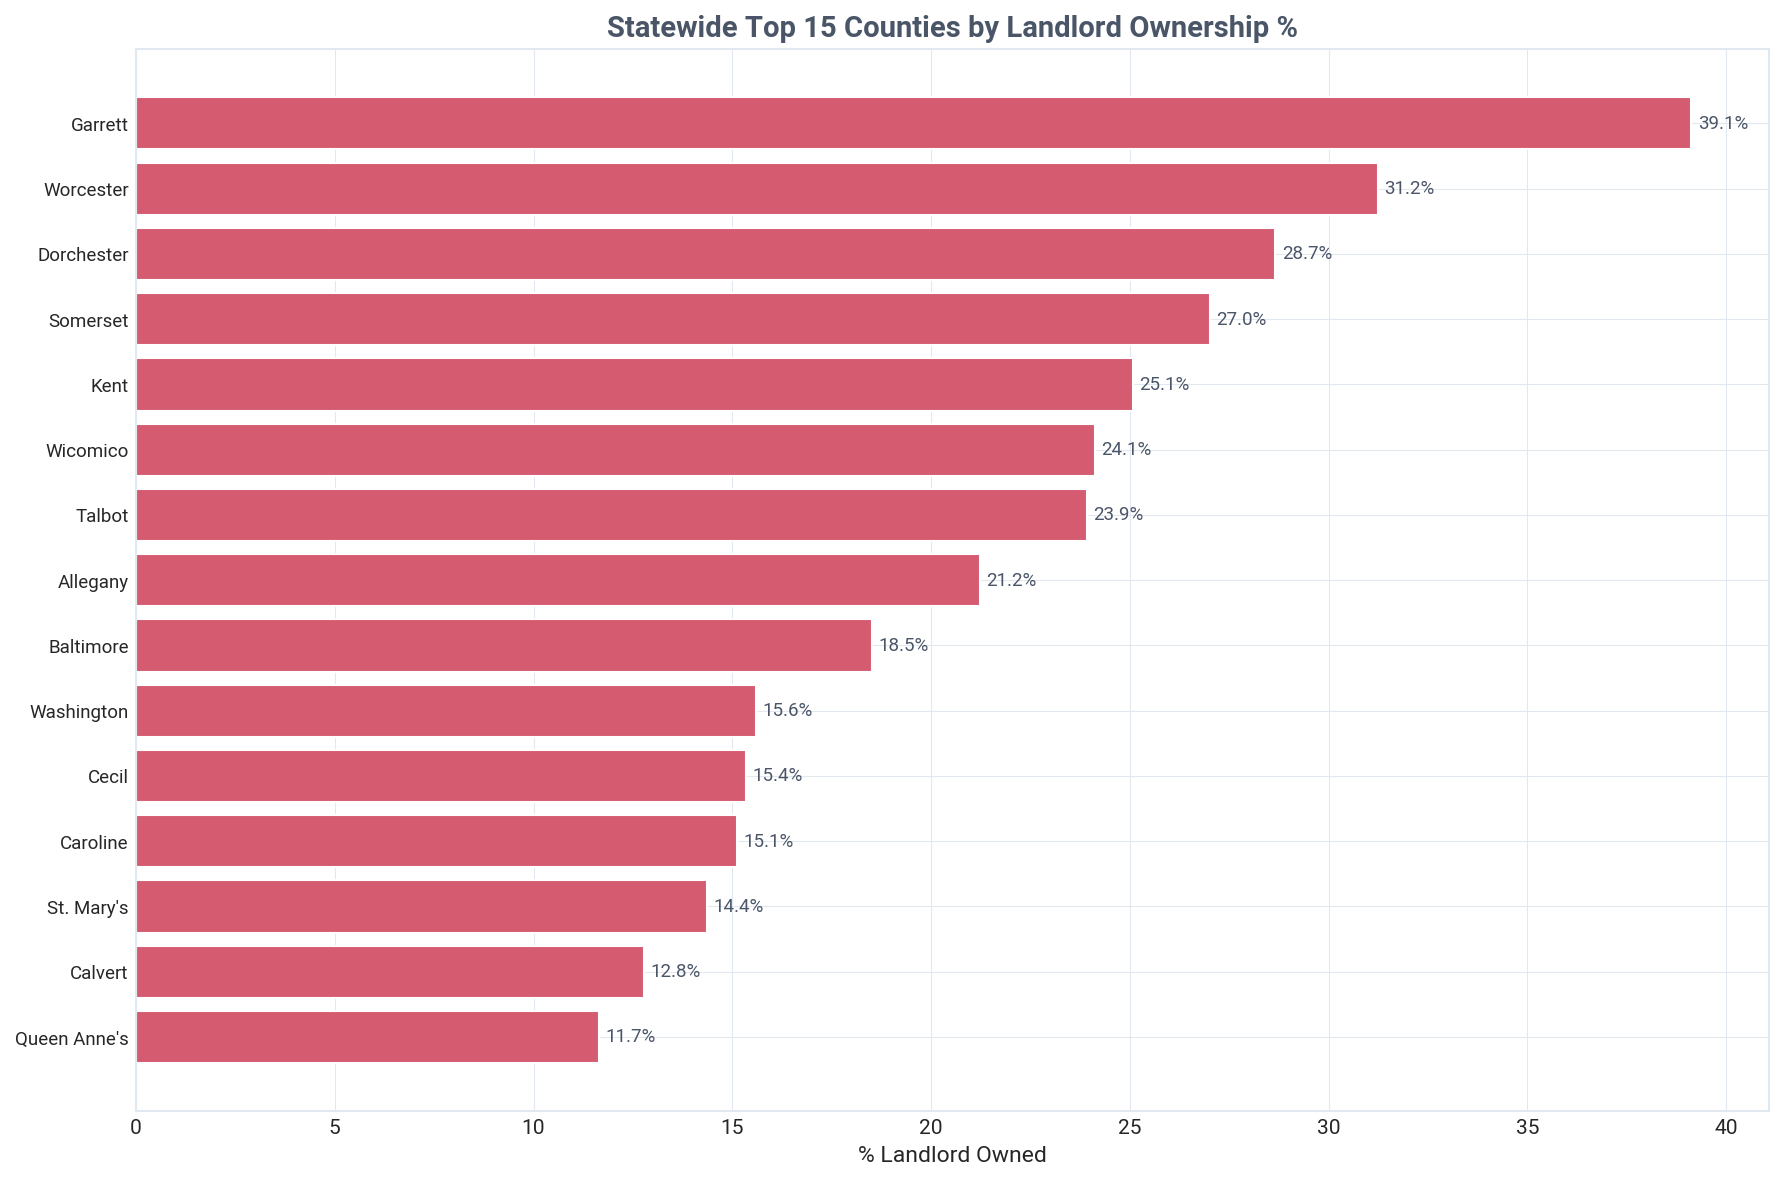
However, smaller counties show much higher penetration, led by Garrett County where investors own 39.1% of SFRs. The top three counties by count (Baltimore, Montgomery, and Prince George's) contain 51.5% of all investor-owned properties in Maryland.
Historical Transactions
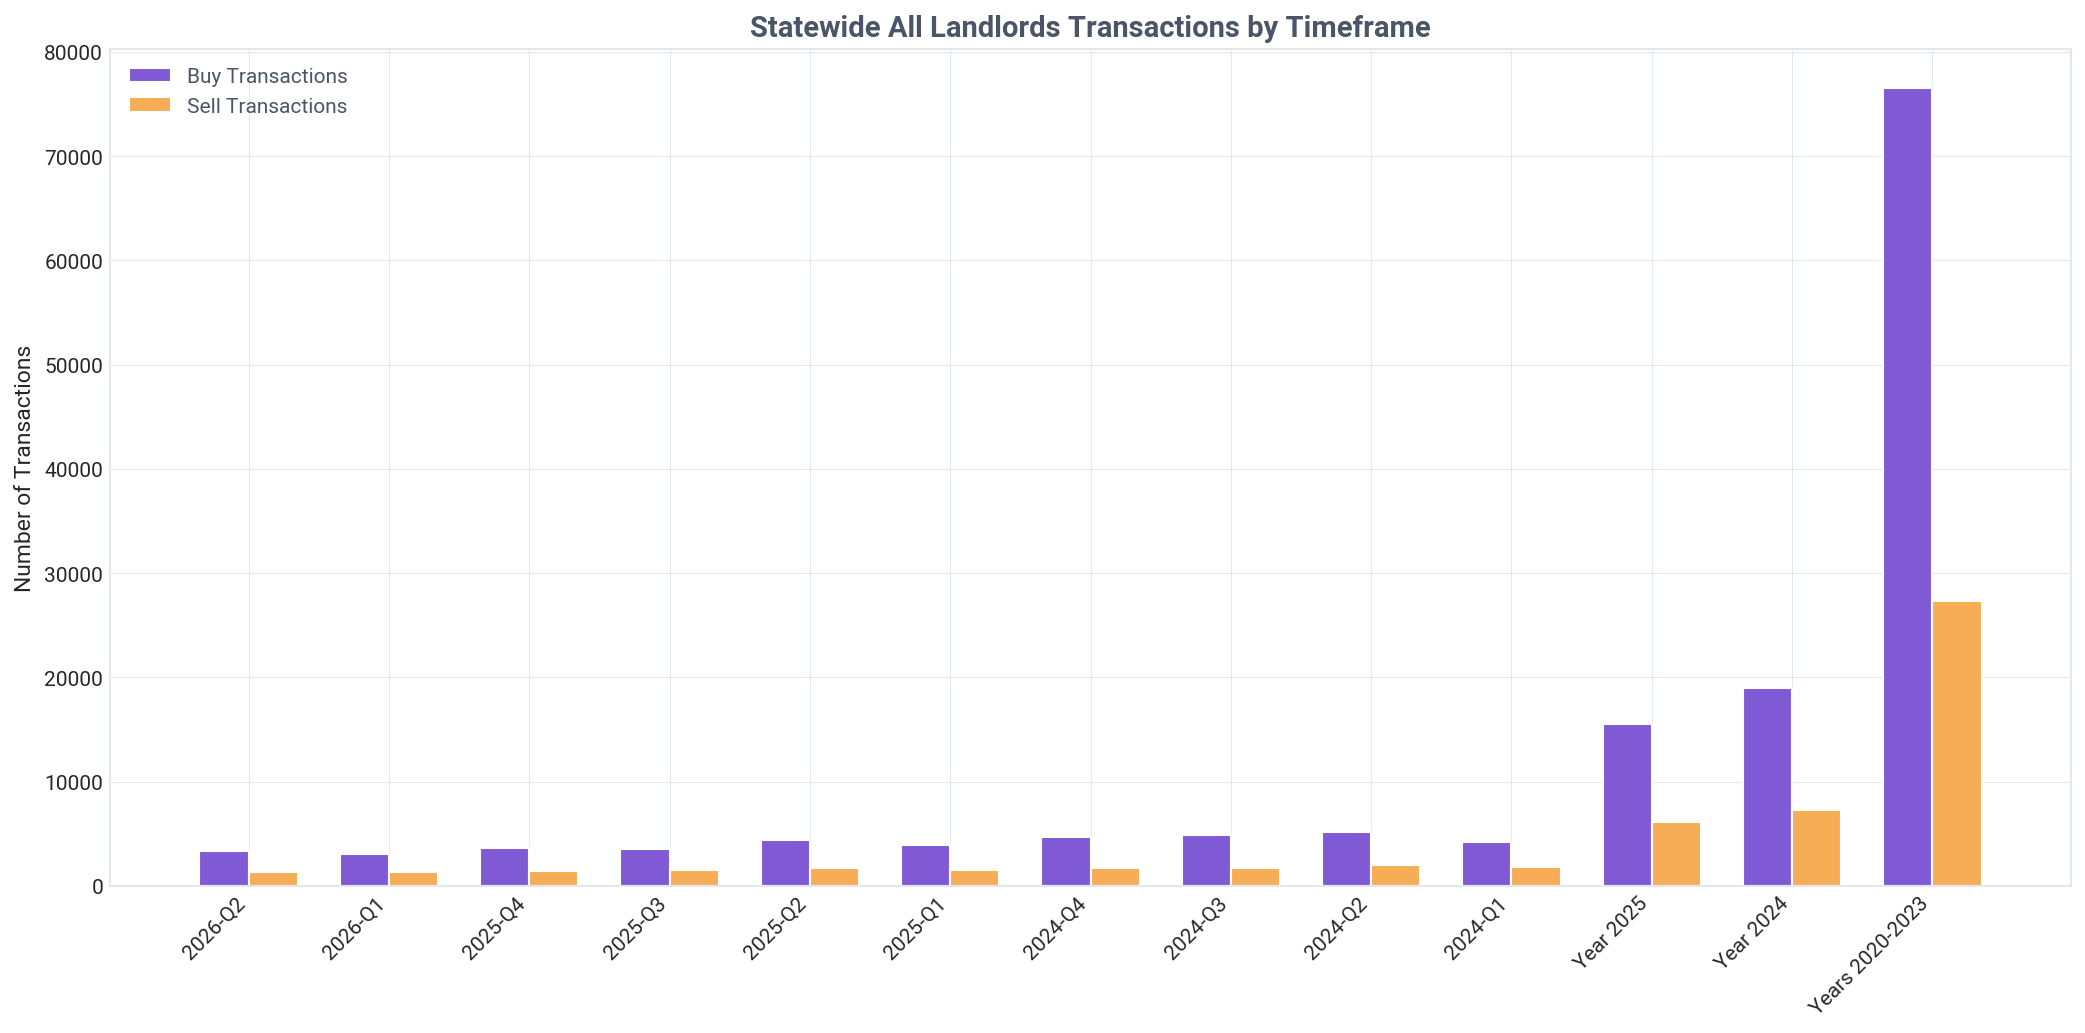
Maryland landlords are strong net buyers, acquiring 2.48 properties for every one sold in Q2 2026.
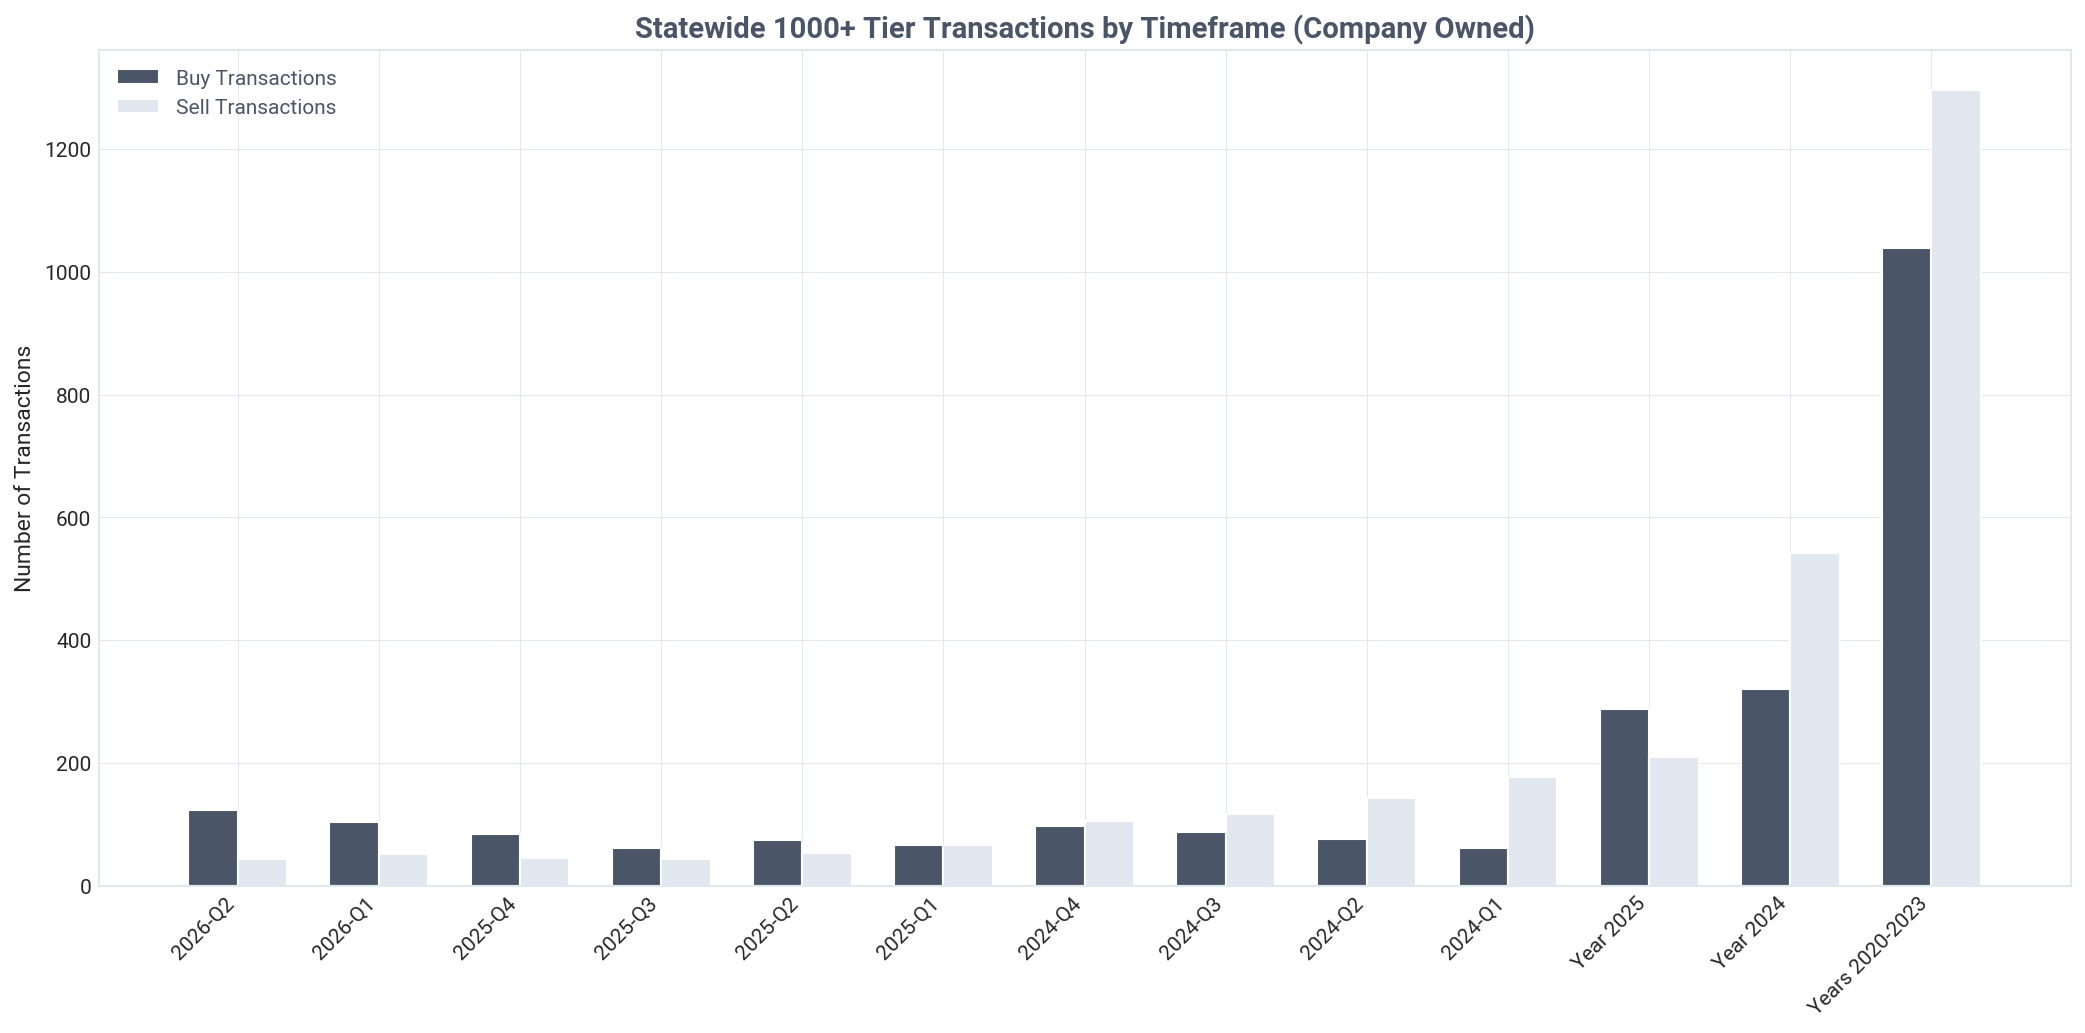
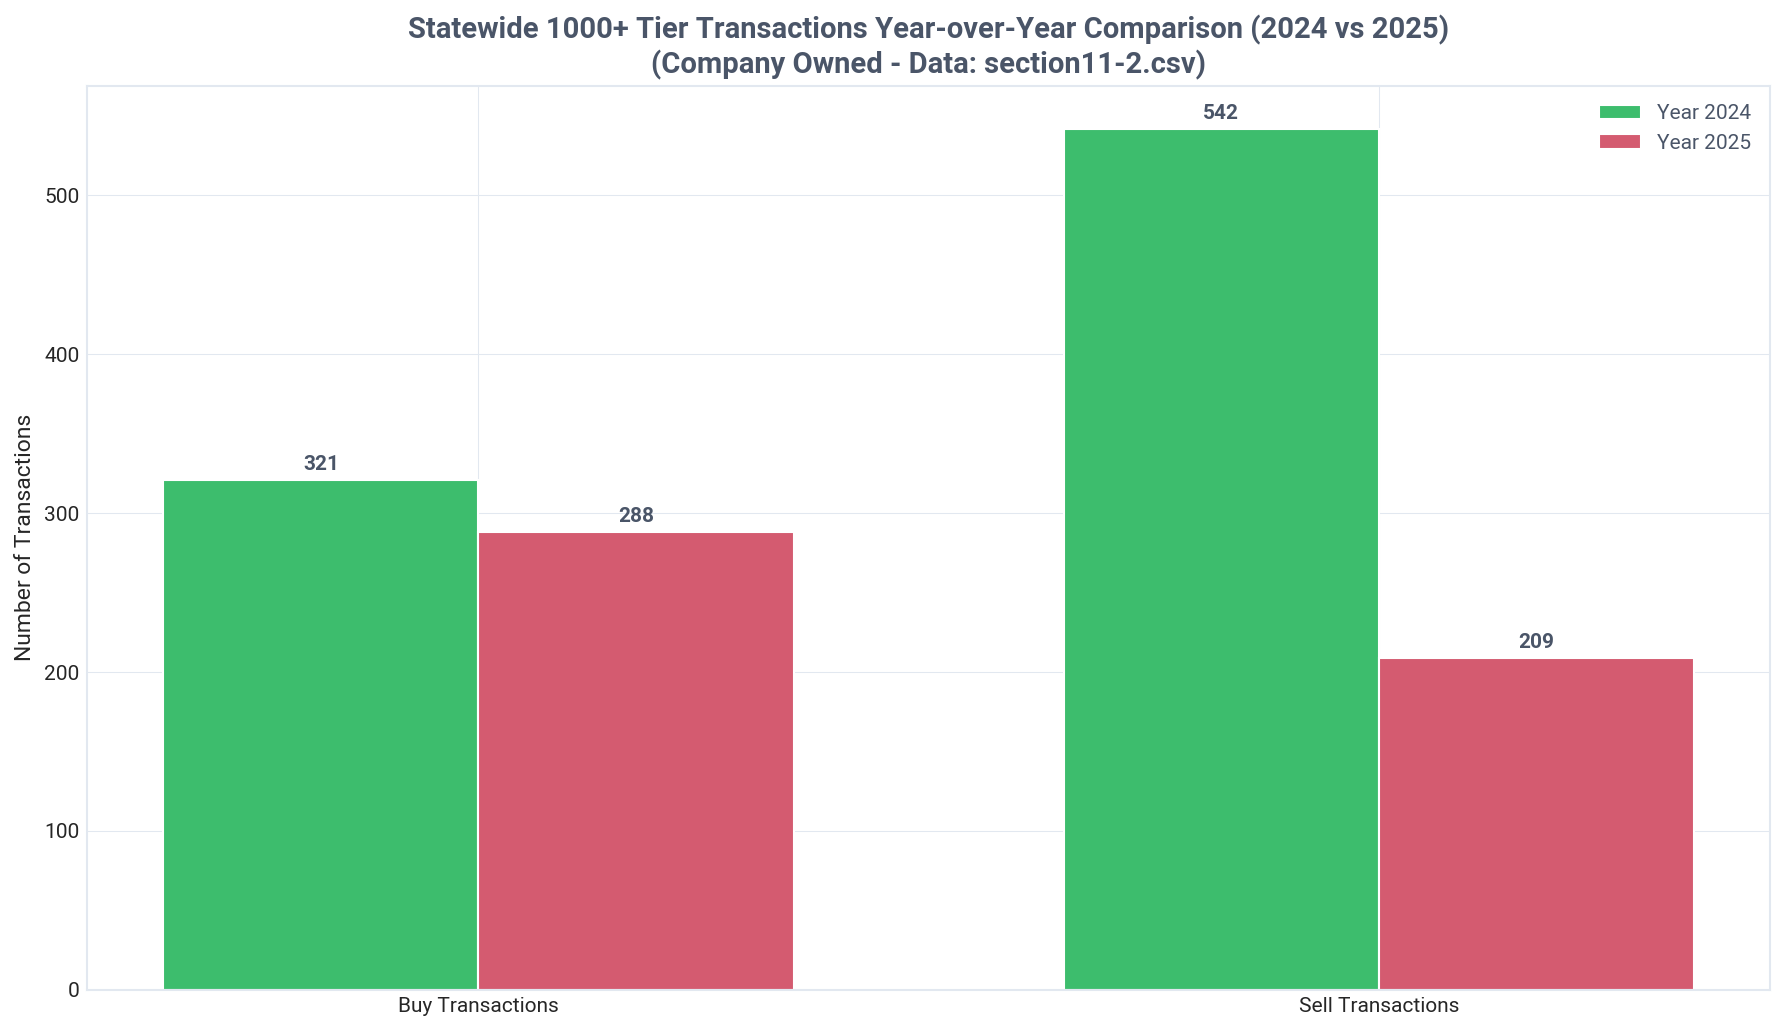
Institutional investors have shifted strategy, becoming net buyers in 2026 (123 buys vs 44 sells) after being net sellers in 2024 (321 buys vs 542 sells). This net acquisition trend has been consistent for the overall market across all recent periods.
Current Quarter Transactions
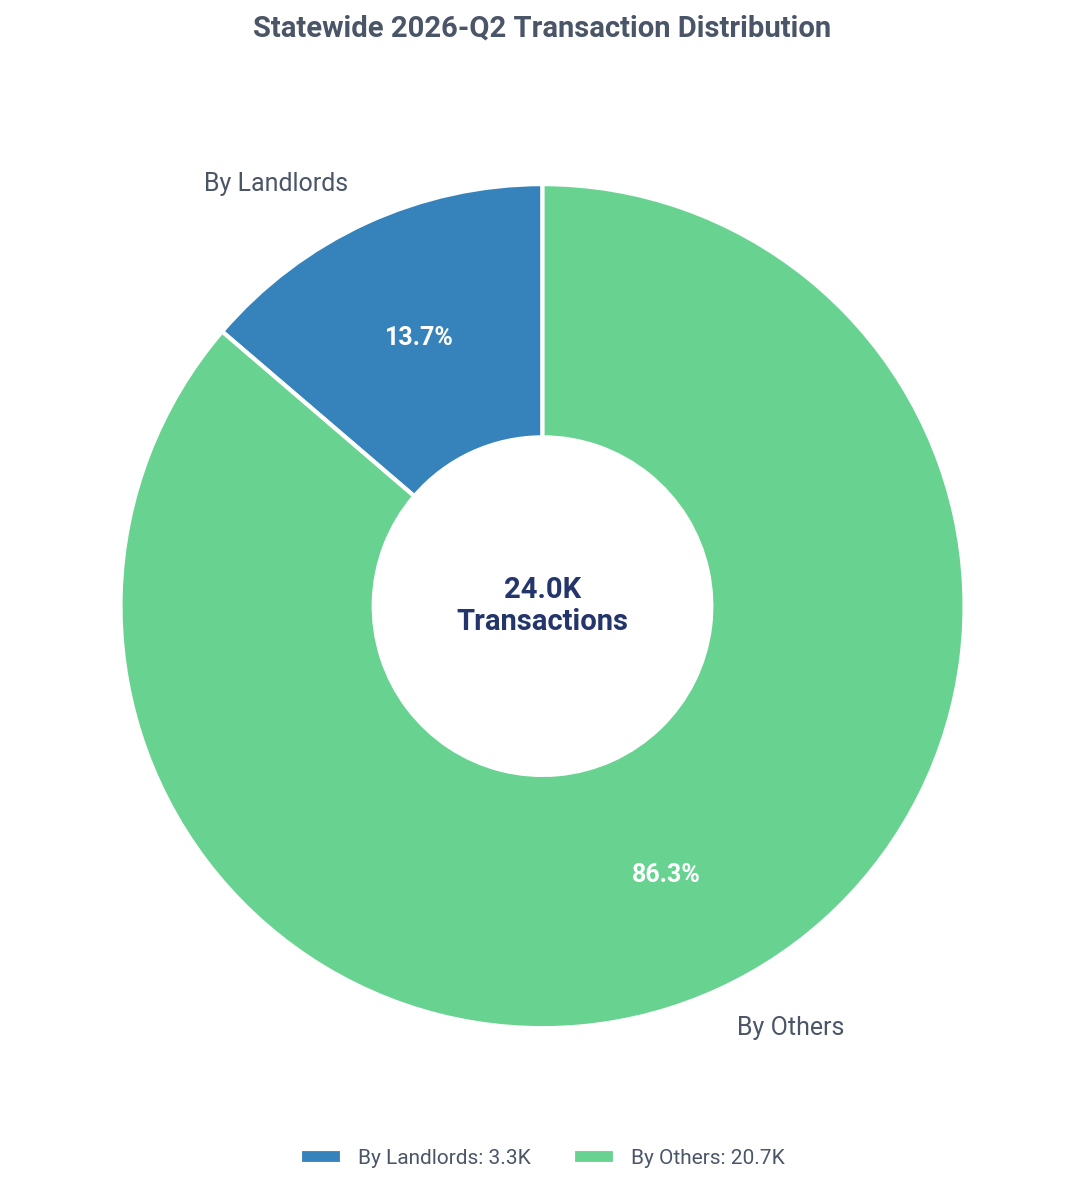
Landlords were involved in 13.7% of all Maryland SFR transactions in Q2 2026, making 3,299 purchases.
A significant price gap exists between tiers: new single-property buyers paid the most ($450,308), while institutional investors paid 35.9% less ($288,558). Mid-size investors (11-20 properties) sourced 18.3% of their deals from other landlords.

Want deeper insights tailored to your investment strategy?

TALK TO AN EXPERT

Current Holdings Portfolio

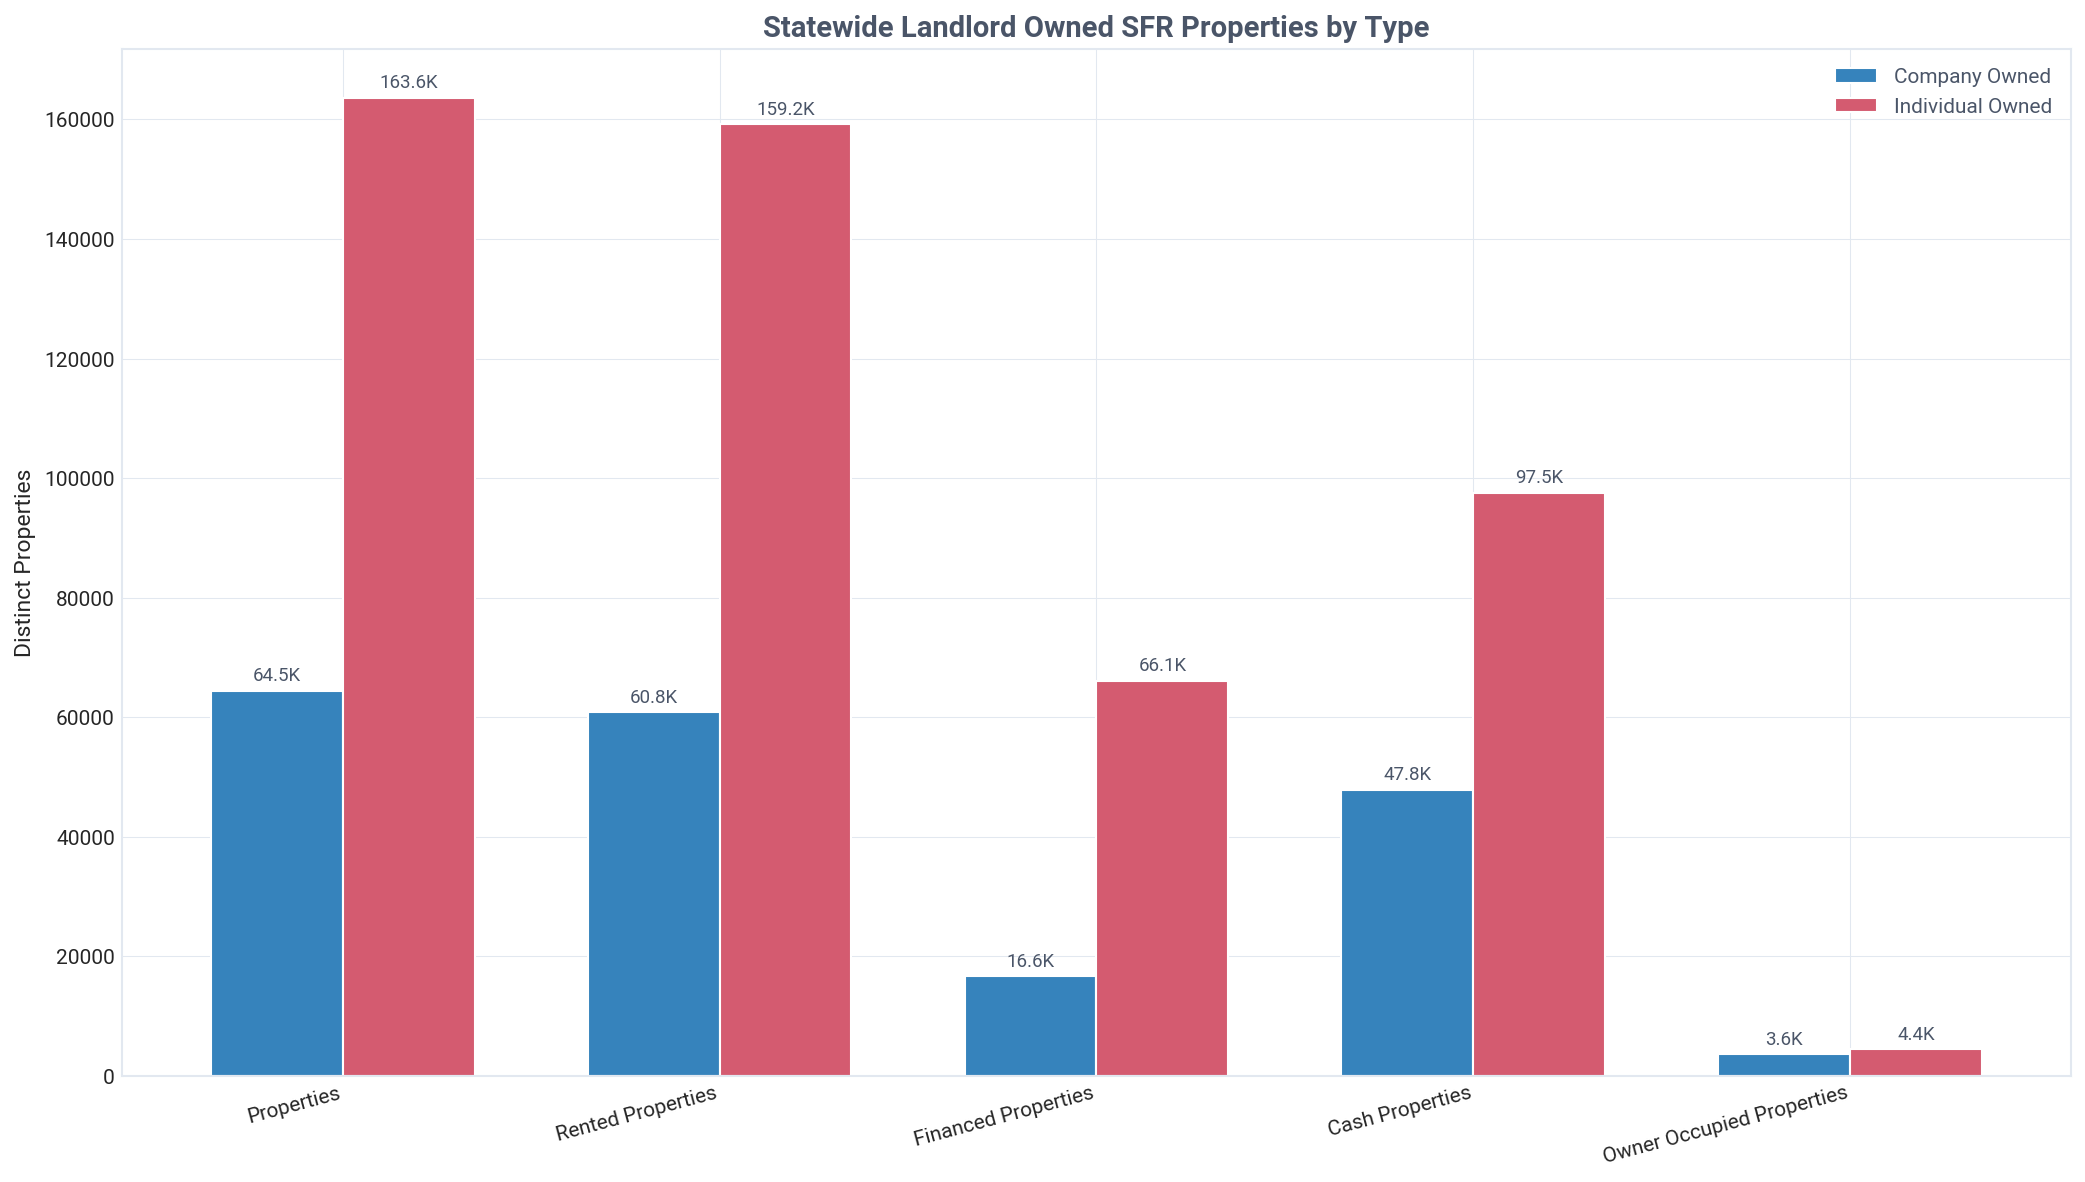
Analysis of landlord property holdings by type, financing method, and owner category

Maryland: landlord SFR holdings by type, Q2 2026
Key Insight
Investors own 225,121 Maryland SFRs, with individual landlords holding a 72.7% majority.
Detailed Findings

In Maryland, investors own 225,121 single-family residential properties, which constitutes 13.1% of the total 1,715,109 SFRs in the state. This demonstrates a significant, yet not majority, presence in the overall housing market.

The ownership structure is heavily skewed towards individuals over corporations. Individual investors own 163,608 properties, or 72.7% of the total investor portfolio, while companies own the remaining 64,451 properties (28.6%).

A similar pattern exists among landlord entities, where 203,968 individual landlords far outnumber the 31,545 company landlords. This reveals that while companies make up only 13.4% of investor entities, they control a larger share of properties (28.6%), indicating they operate larger portfolios on average than the typical individual real estate investor.

Maryland's investors show strong financial positioning, with cash-owned properties (143,180) outnumbering financed ones (81,941) by a wide margin. This means 63.6% of the investor-owned portfolio is held without a mortgage, suggesting lower leverage and greater market resilience.

The portfolio is overwhelmingly dedicated to providing rental housing, with 217,078 properties classified as rented. This accounts for 96.4% of all investor-owned SFRs, confirming that the primary activity of these owners is supplying homes for the rental market.
Acquisition Timing & Pricing

Comparison of acquisition prices between landlords and traditional homeowners

Key Insight
Maryland landlords paid 33.2% less than homeowners in Q2 2026, a $192,134 discount.
Detailed Findings

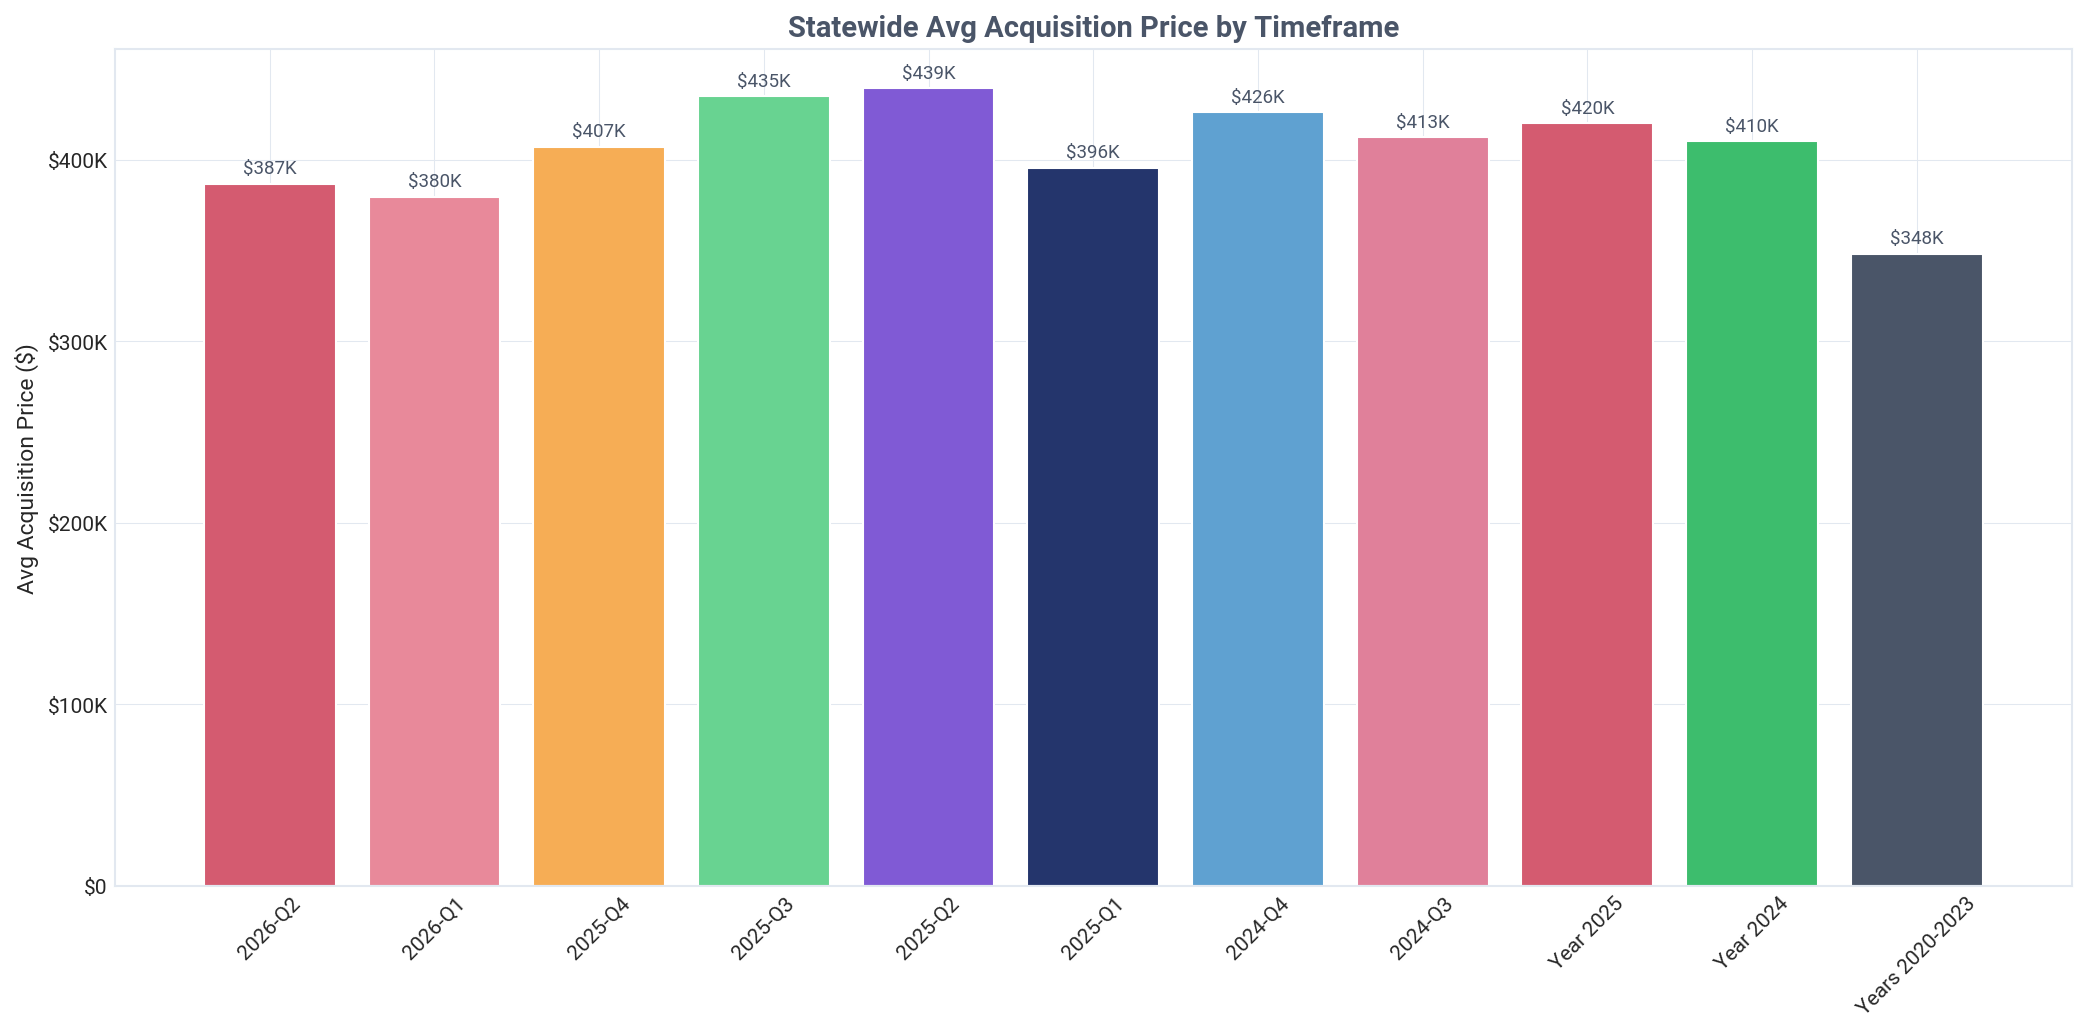
Investors in Maryland demonstrated a profound pricing advantage in Q2 2026, acquiring properties for an average of $386,973. This was $192,134, or 33.2%, below the $579,107 average paid by traditional homeowners, suggesting investors are targeting distressed assets or leveraging superior negotiation tactics.

The discount for landlords has been rapidly expanding. The 33.2% gap in Q2 2026 is a significant increase from 28.5% in Q1 2026 ($151,336 difference) and has grown substantially from the 21.5% gap recorded in Q3 2025 ($119,376 difference). This trend indicates investors are becoming more effective at finding undervalued properties compared to the general market.

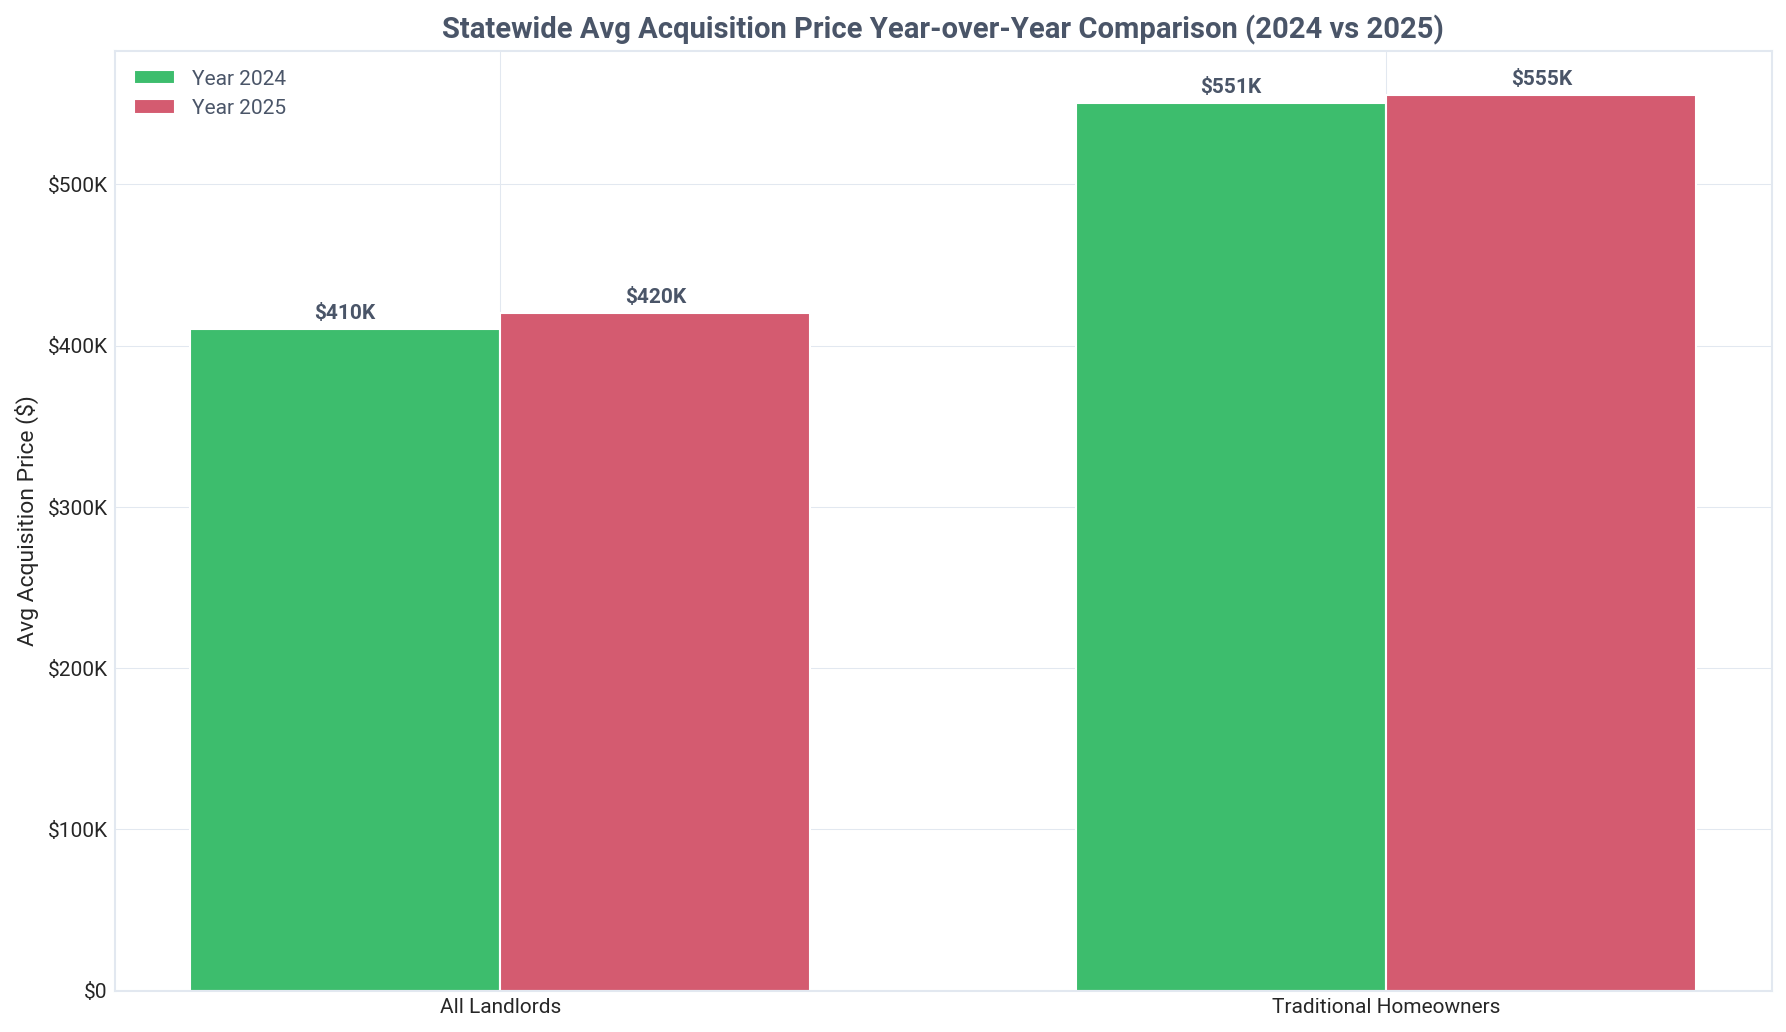
While securing discounts, investors are still participating in a market with rising values. The average acquisition price in Q2 2026 ($386,973) represents an 11.1% increase from the pandemic-era average of $348,388 (2020-2023), reflecting overall market appreciation. Using an automated valuation (AVM) can help track these price changes over time.

Acquisition prices have shown some volatility, dropping from a recent high of $439,380 in Q2 2025 to $386,973 in Q2 2026. This cooling may signal a shift in acquisition strategy towards lower-cost assets or a broader market price correction.

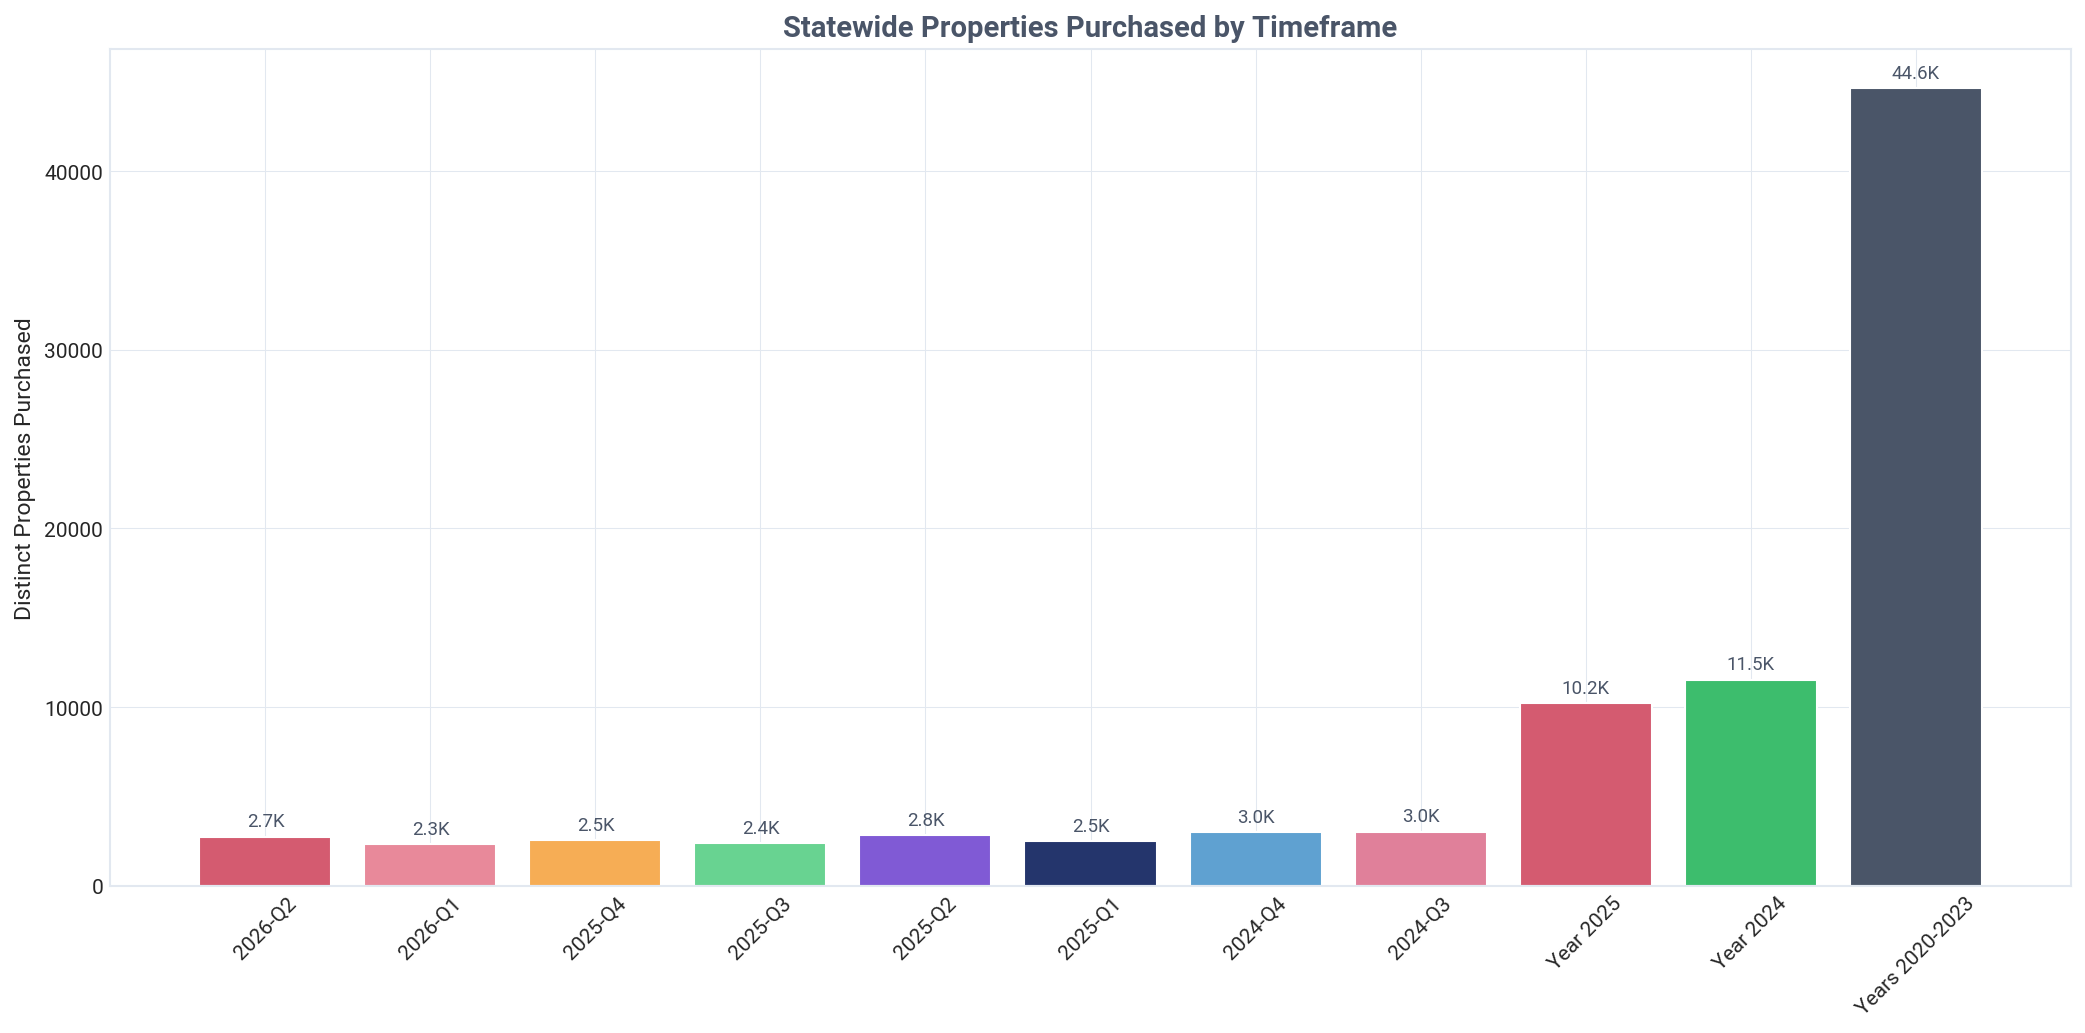
The volume of acquisitions remains steady, with landlords purchasing 2,748 properties in Q2 2026. This is comparable to the 2,826 properties bought in Q2 2025, indicating sustained investor demand despite price fluctuations.

Maryland: properties purchased by timeframe, Q2 2026
Maryland: average acquisition price by timeframe, Q2 2026
Maryland: average acquisition price by buyer type, Q2 2026
Maryland: average acquisition price year over year, Q2 2026

Current Quarter Purchase Summary

Analysis of Q2 2026 purchase activity by investor tier and type

Maryland: purchases by tier, Q2 2026
Maryland: purchased property share by tier, Q2 2026
Key Insight
Landlords acquired 15.3% of all Maryland SFRs sold in Q2 2026, totaling 2,748 properties.
Detailed Findings

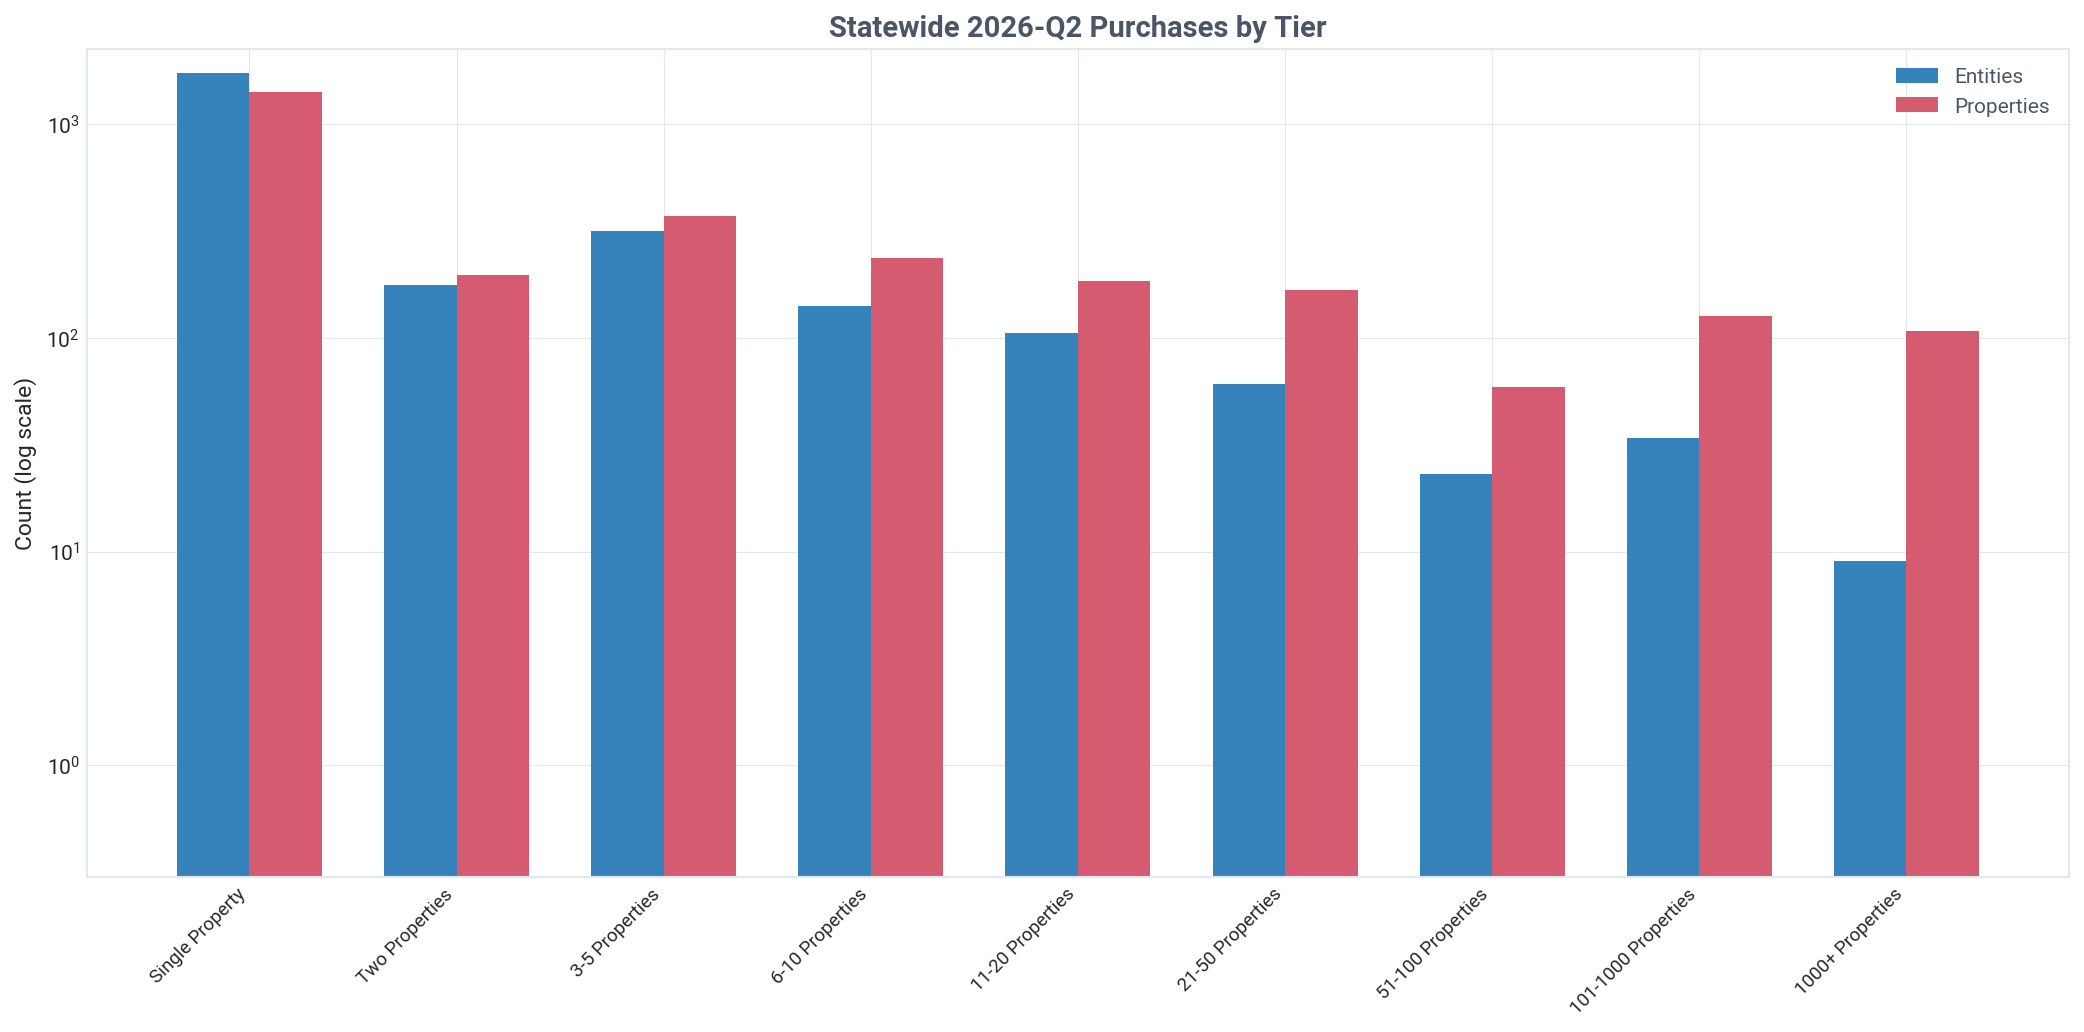
Investor purchasing accounted for 15.3% of the total Maryland SFR market in Q2 2026, with landlords acquiring 2,748 of the 17,935 homes sold. This shows a healthy, but not dominant, share of market activity.

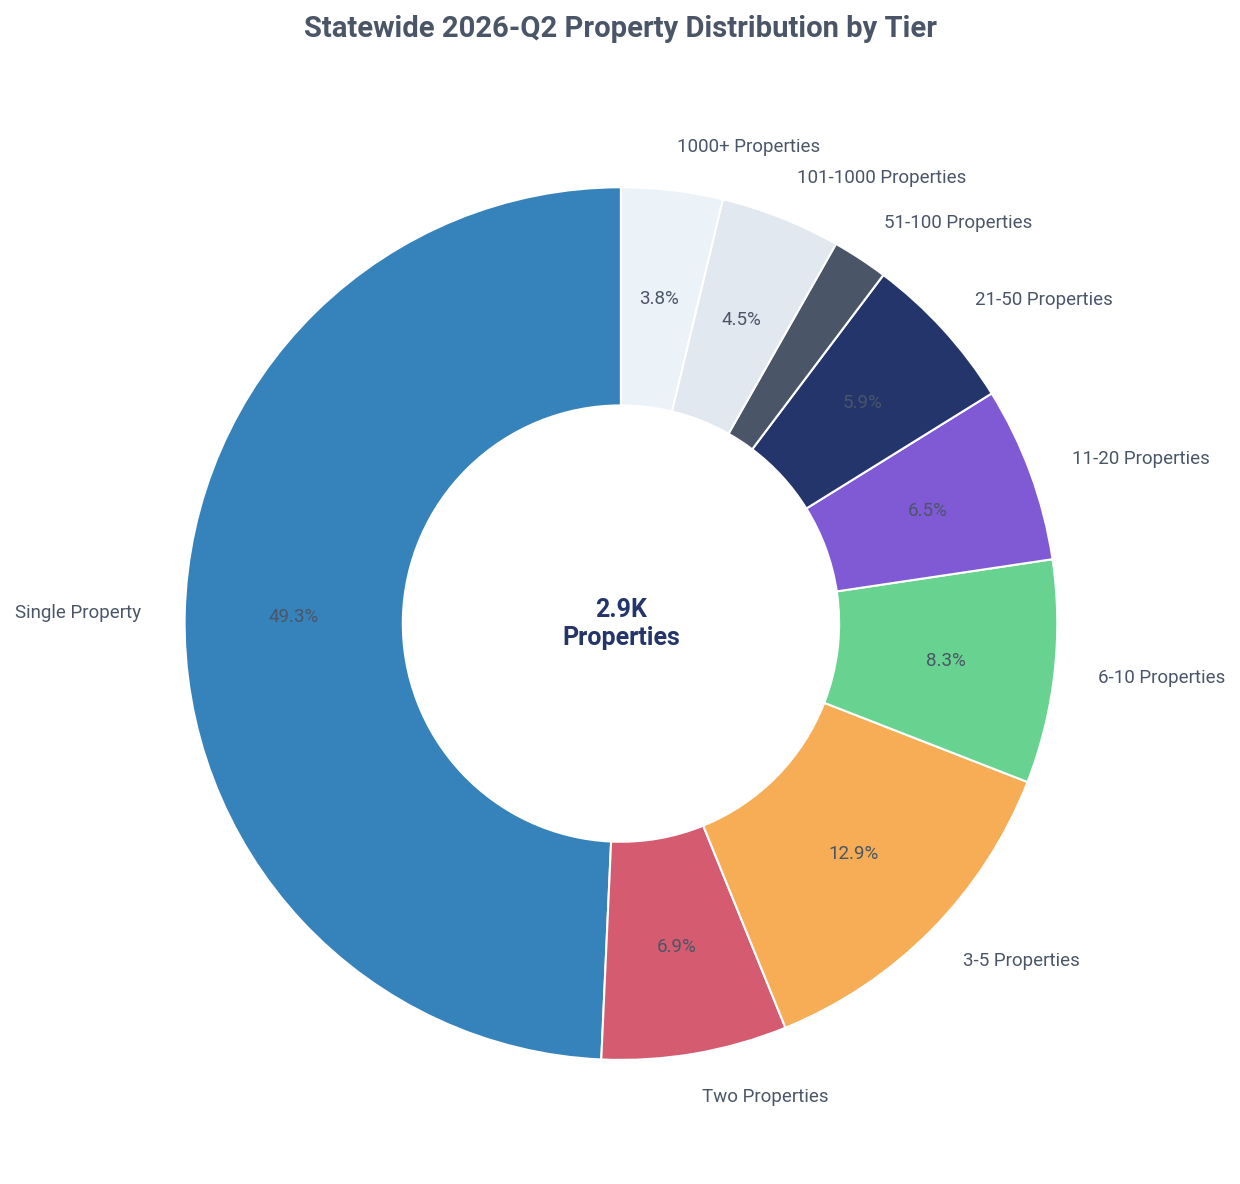
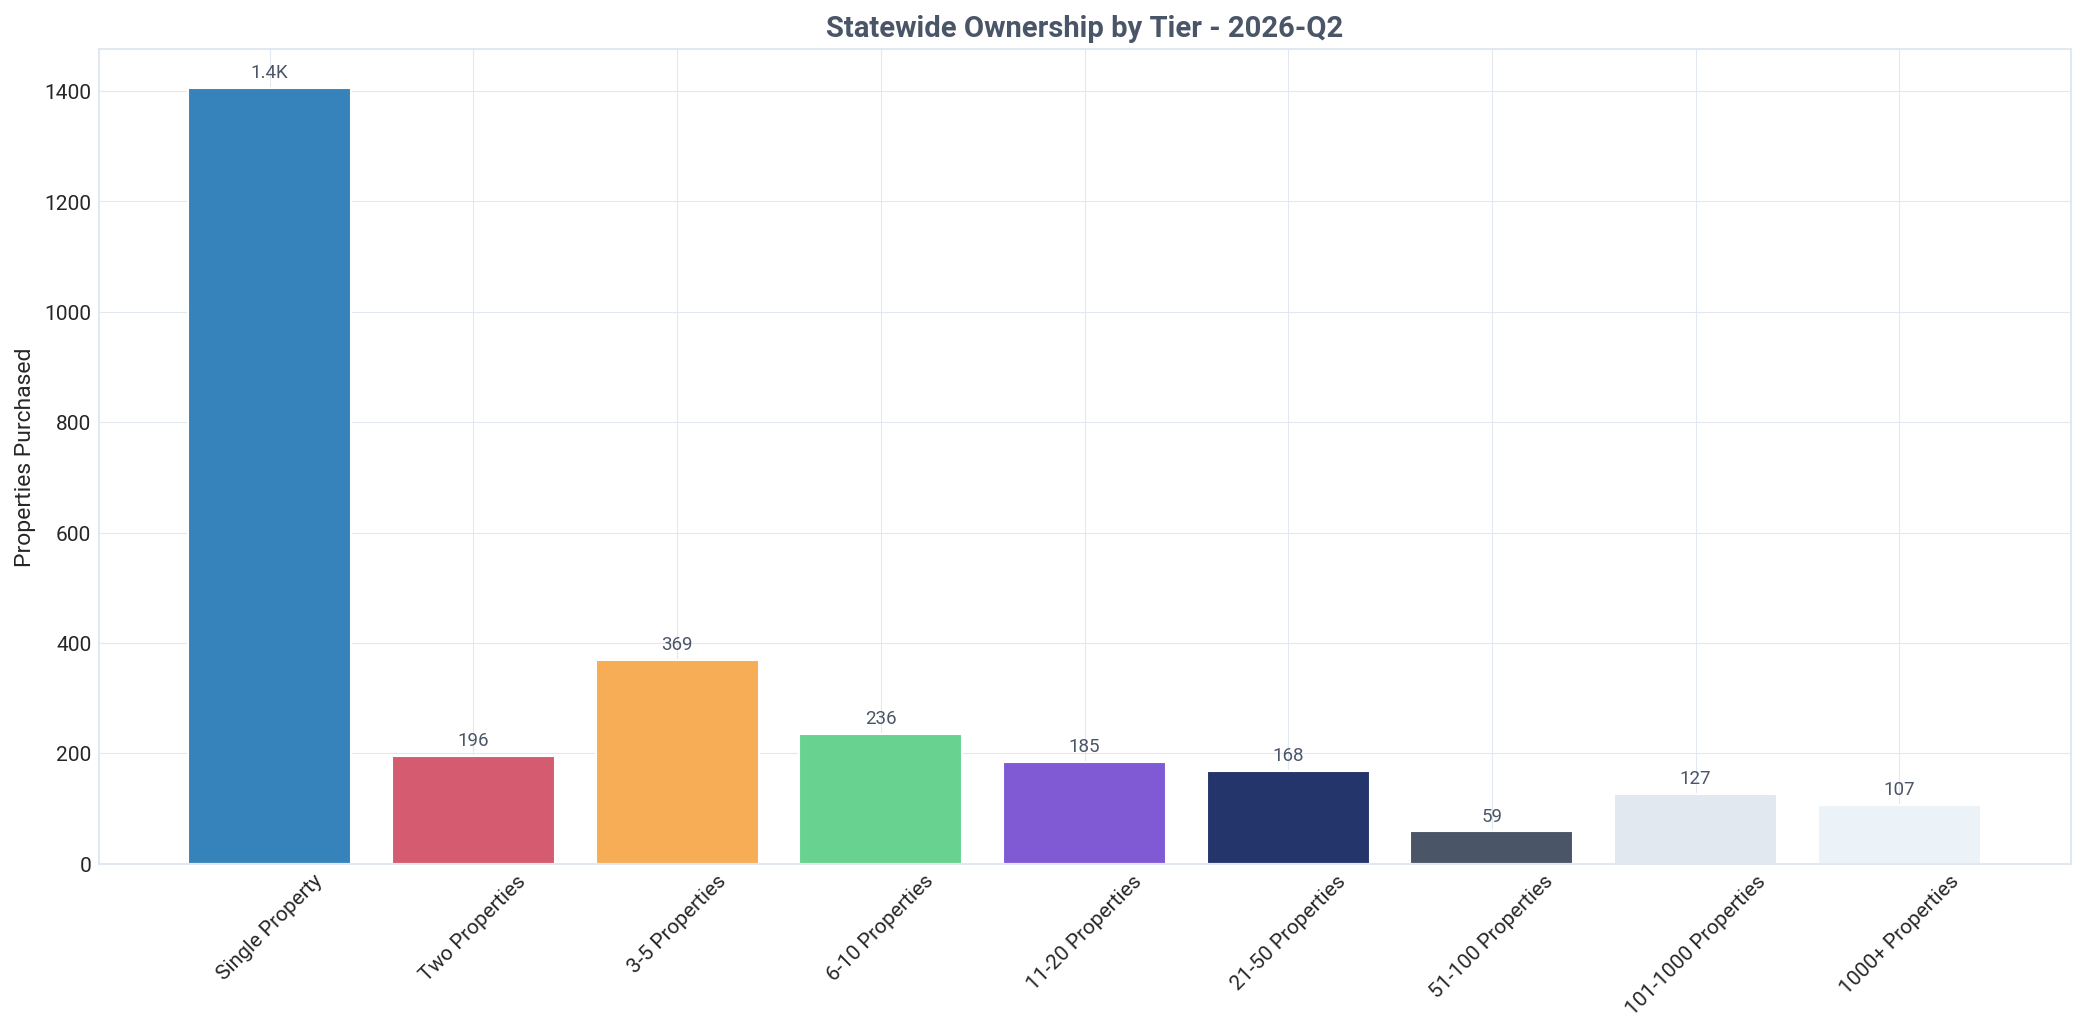
The overwhelming majority of acquisition activity came from small-scale investors. Mom-and-pop landlords (owning 1-10 properties) purchased 2,207 homes, representing 77.4% of all investor acquisitions. This highlights the decentralized nature of the Maryland rental market.
The market is expanding with new participants, as 1,726 new landlord entities entered the market by purchasing a single property. These first-time investors alone bought 1,406 properties, making up 49.3% of all Q2 2026 landlord purchases and underscoring the accessibility of the market.

In stark contrast, institutional investors (1,000+ properties) played a minor role in Q2 acquisitions. They purchased only 107 properties, or 3.8% of the investor total, a volume 20 times smaller than that of their mom-and-pop counterparts.

Mid-size landlords also contributed steadily to market activity. Investors in the 11-100 property tiers collectively purchased 412 properties, or 14.5% of the quarterly total, using tools like property search to find and acquire assets.

Ownership by Purchase Tier

Distribution of investor-owned properties across portfolio size tiers

Key Insight
Mom-and-pop landlords control a staggering 89.9% of Maryland's investor-owned SFR housing.
Detailed Findings

The structure of Maryland's rental market is defined by small-scale ownership, not large corporations. Mom-and-pop landlords, who own 1-10 properties, collectively hold 89.9% of all investor-owned SFRs in the state.

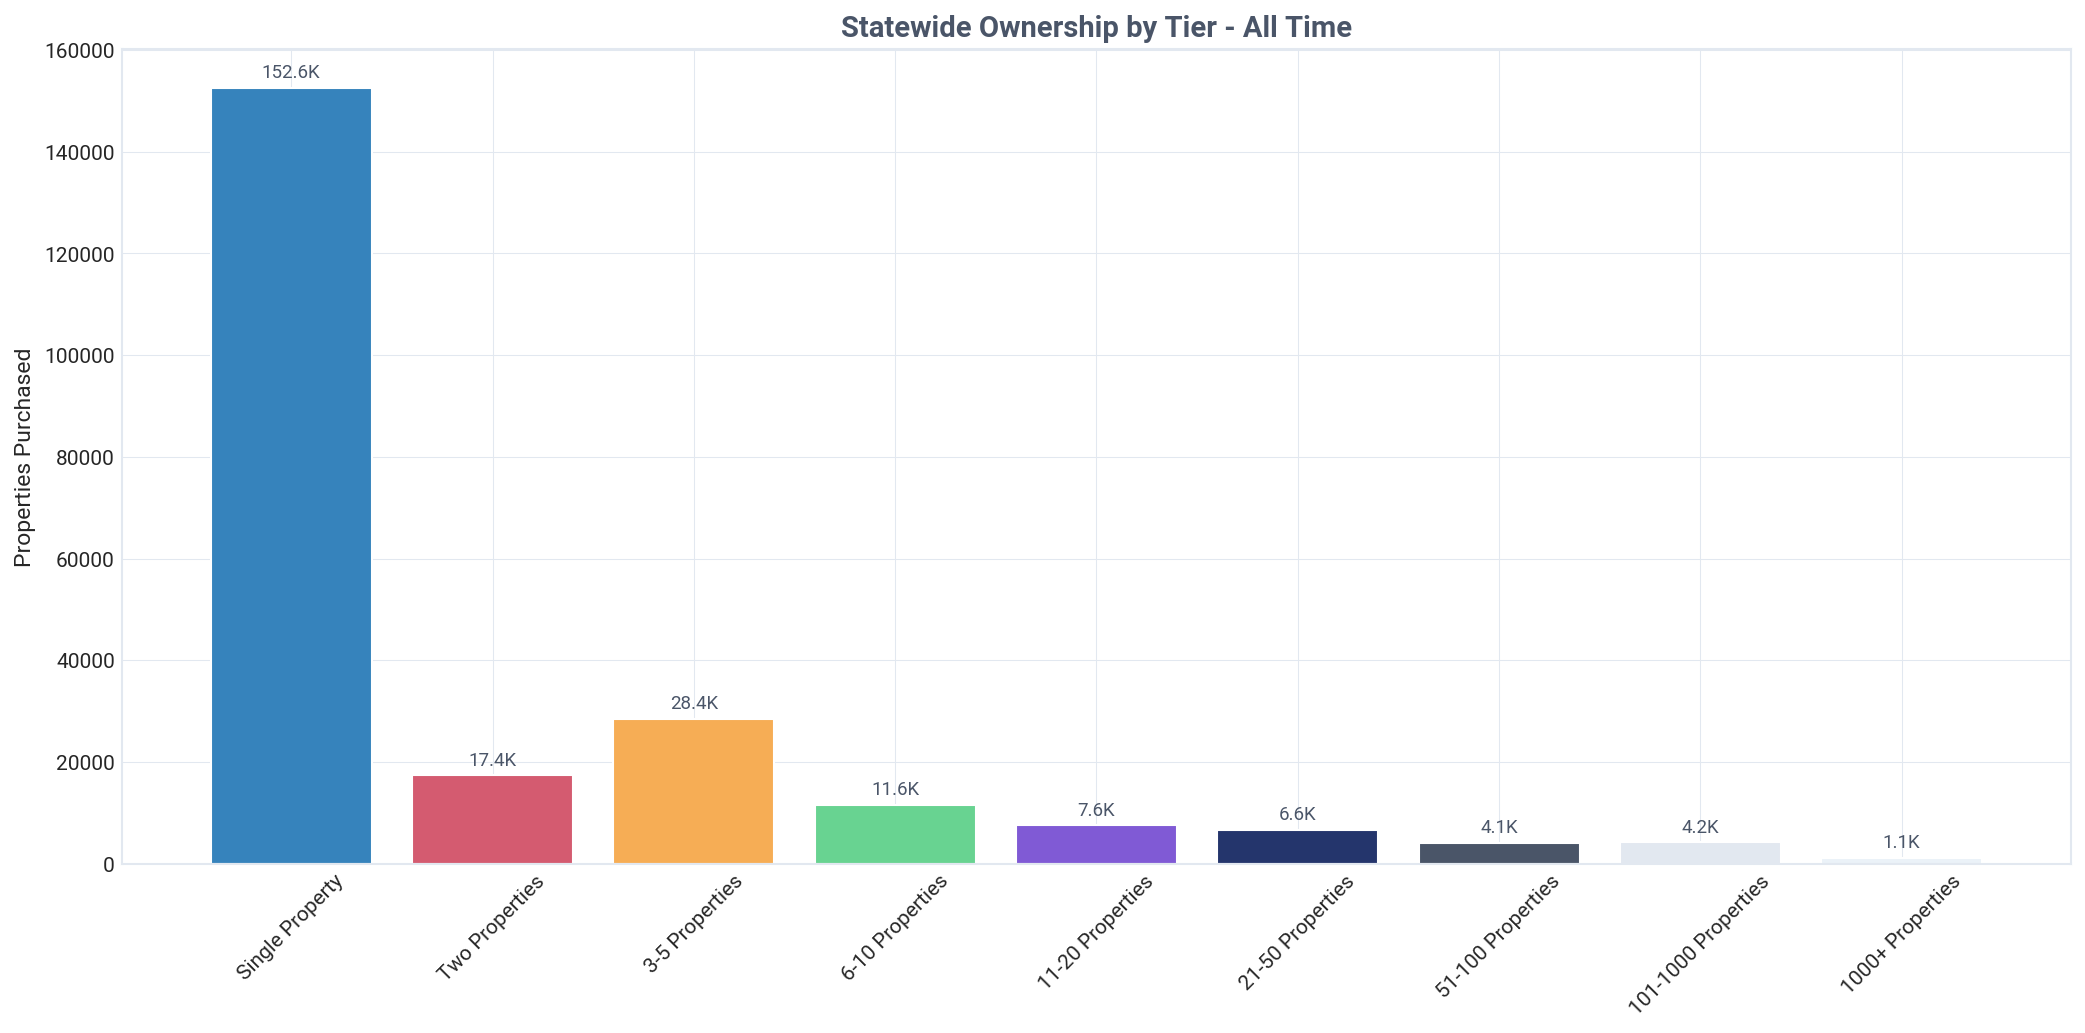
Dispelling the myth of a Wall Street takeover, institutional investors (1,000+ properties) have a minimal footprint, owning just 1,110 properties. This represents only 0.5% of the total investor portfolio, a share approximately 180 times smaller than that of mom-and-pop owners.

The single-property landlord is the cornerstone of the market. This tier alone accounts for 152,588 properties, or 65.3% of all investor-owned housing, demonstrating that the market is dominated by first-time and small-scale investors.

Acquisition pricing strategies differ dramatically by investor size. In Q2 2026, new single-property buyers paid the highest average price at $450,308 per home. In contrast, institutional investors paid 35.9% less, averaging just $288,558, suggesting they target different asset types or have greater purchasing power.

This market structure, supported by various proptech platforms, shows remarkable stability and is characterized by a vast number of small participants rather than a few dominant players. The combined mid-to-large tiers (11-1,000 properties) only account for 9.6% of the investor-owned housing stock.

Maryland: current ownership by purchase tier, Q2 2026
Maryland: properties purchased by tier, all time, Q2 2026
Maryland: properties purchased by tier this quarter, Q2 2026
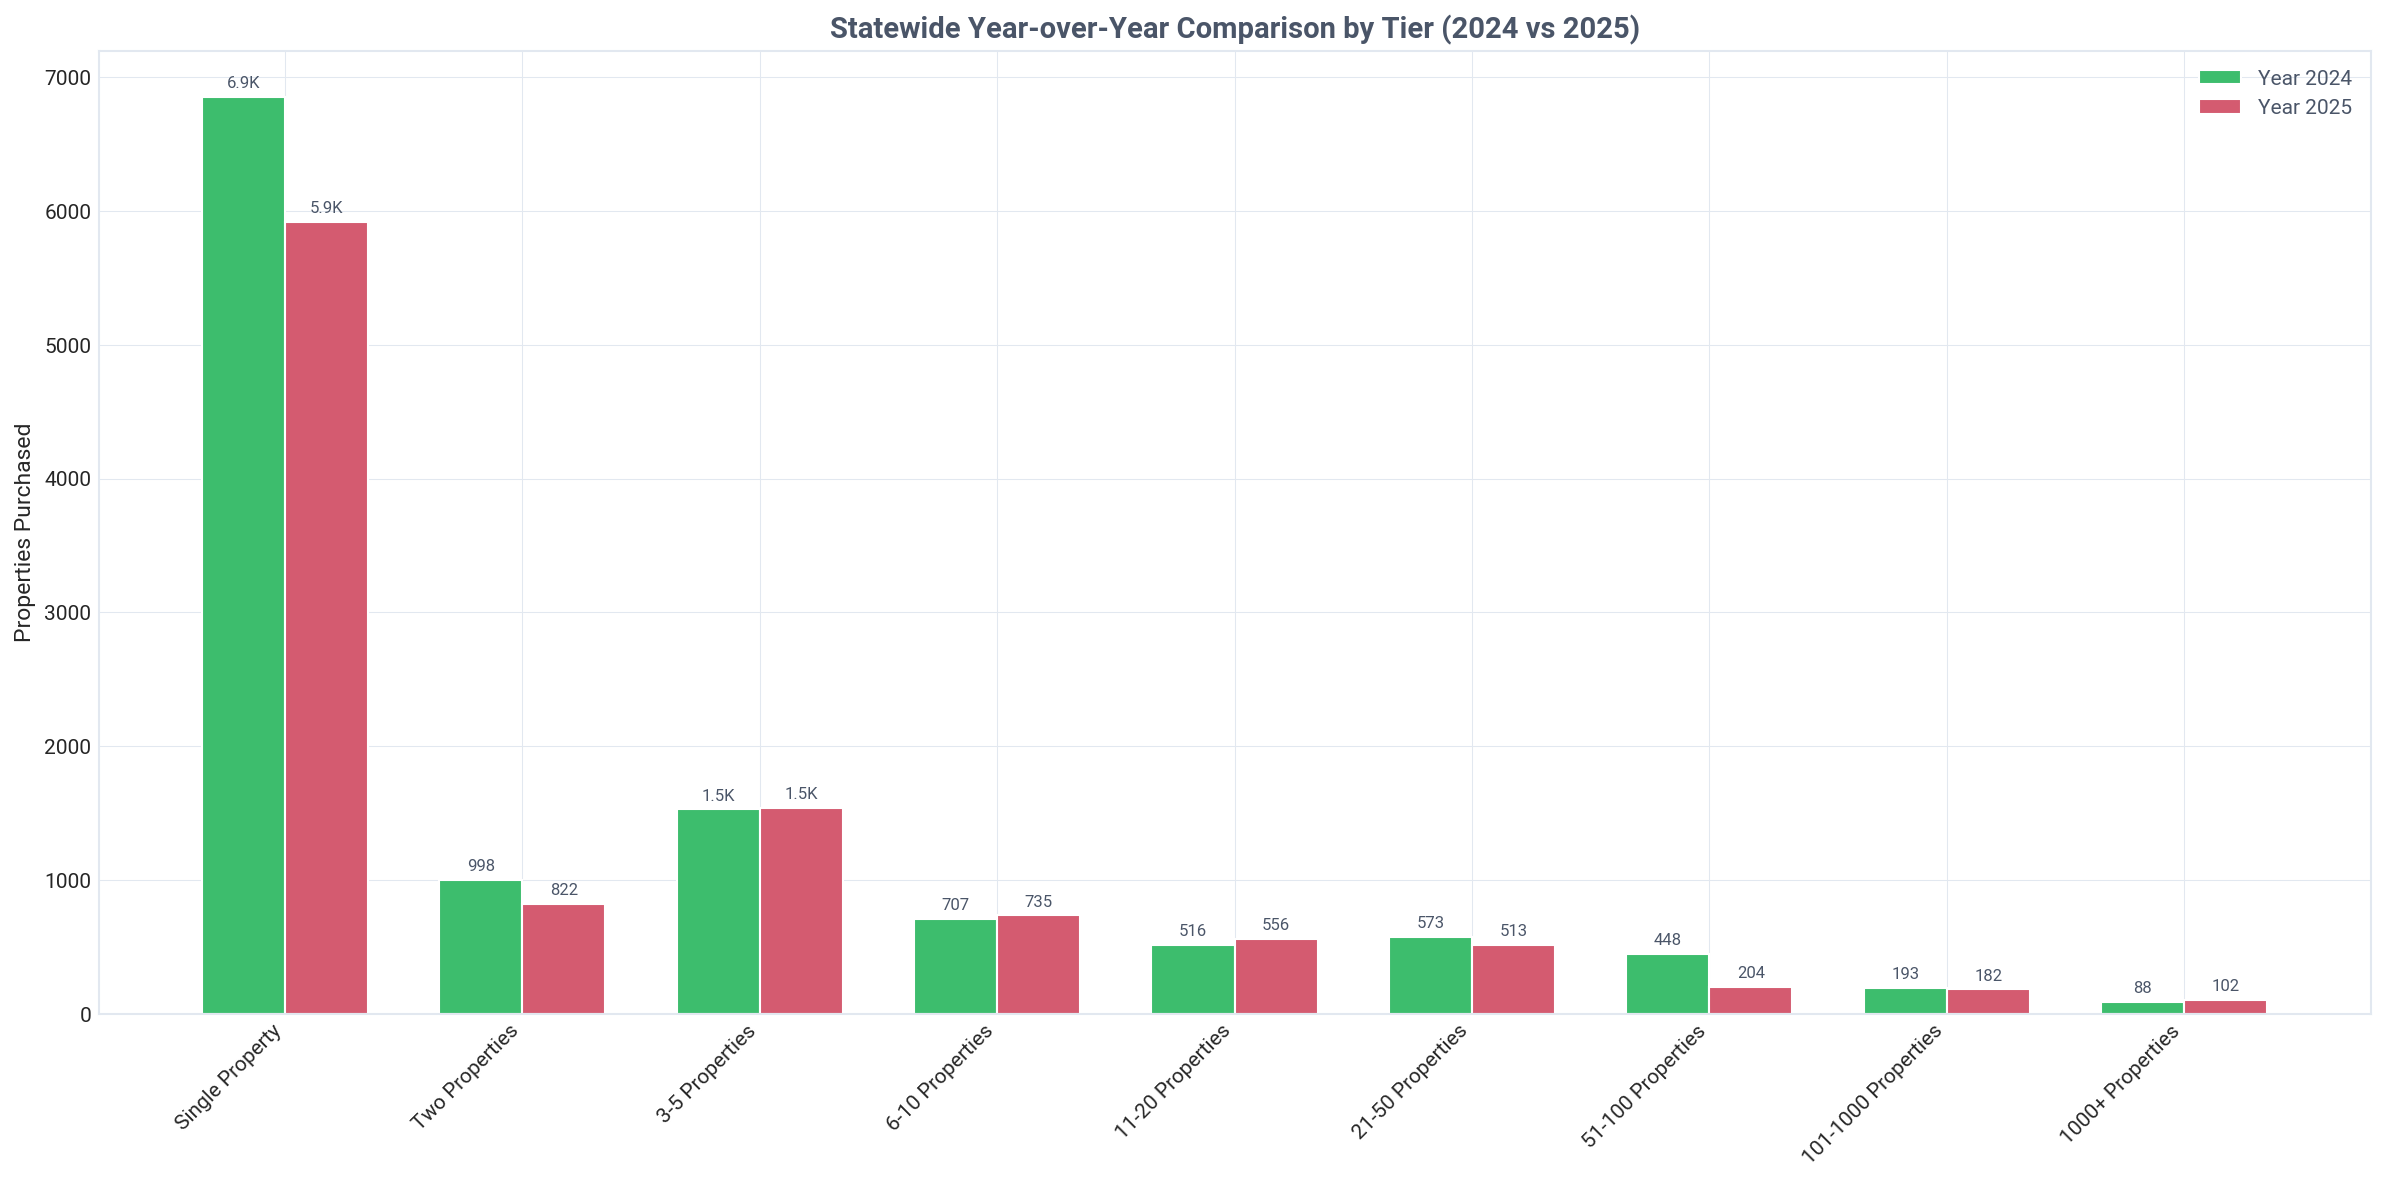
Maryland: properties purchased by tier year over year, Q2 2026

Need custom portfolio analysis based on these tier insights?

TALK TO AN EXPERT

Ownership by Tier & Owner Type

Breakdown of individual vs corporate ownership across portfolio tiers

Maryland: ownership by tier and owner type, Q2 2026
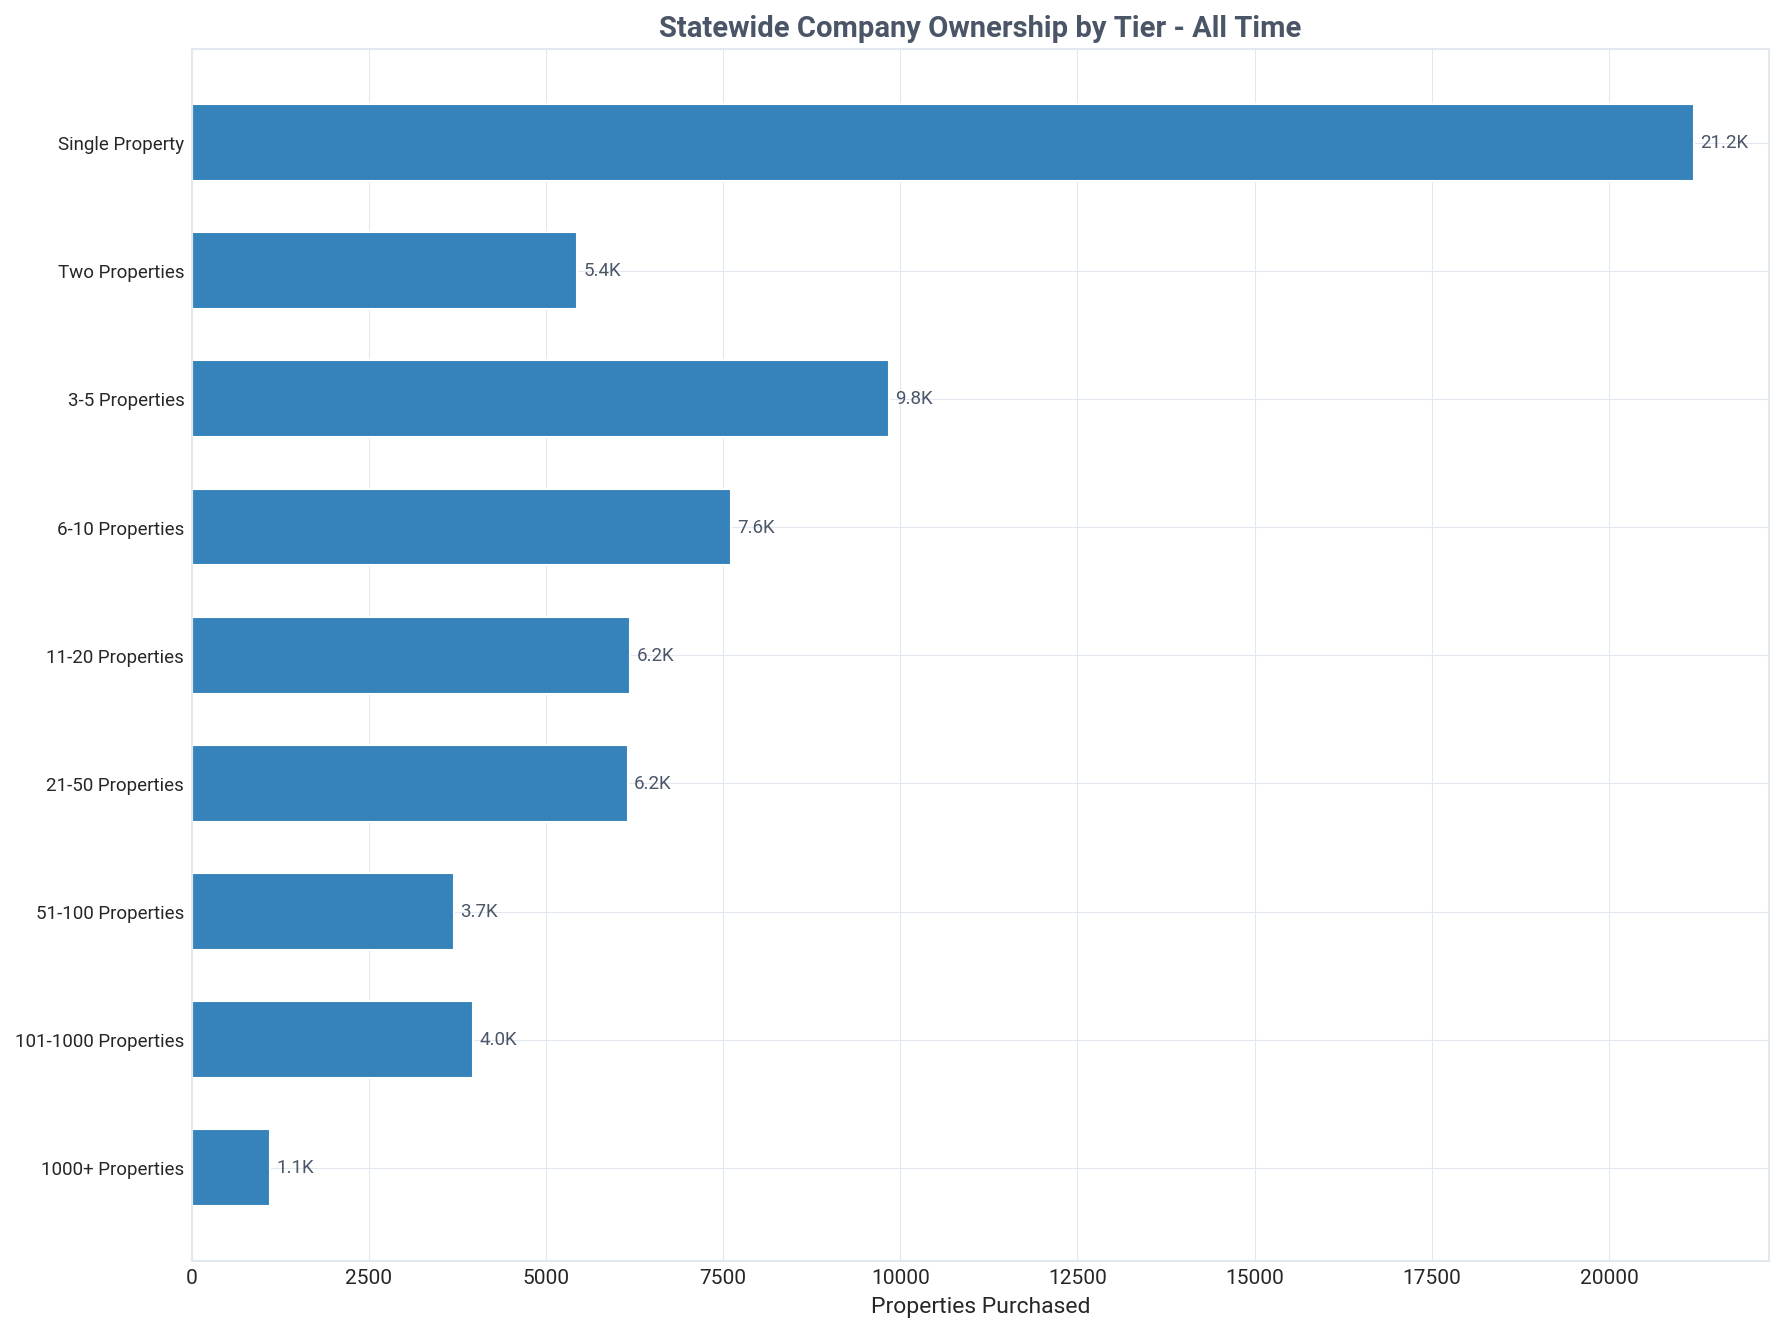
Maryland: company purchases by tier, all time, Q2 2026
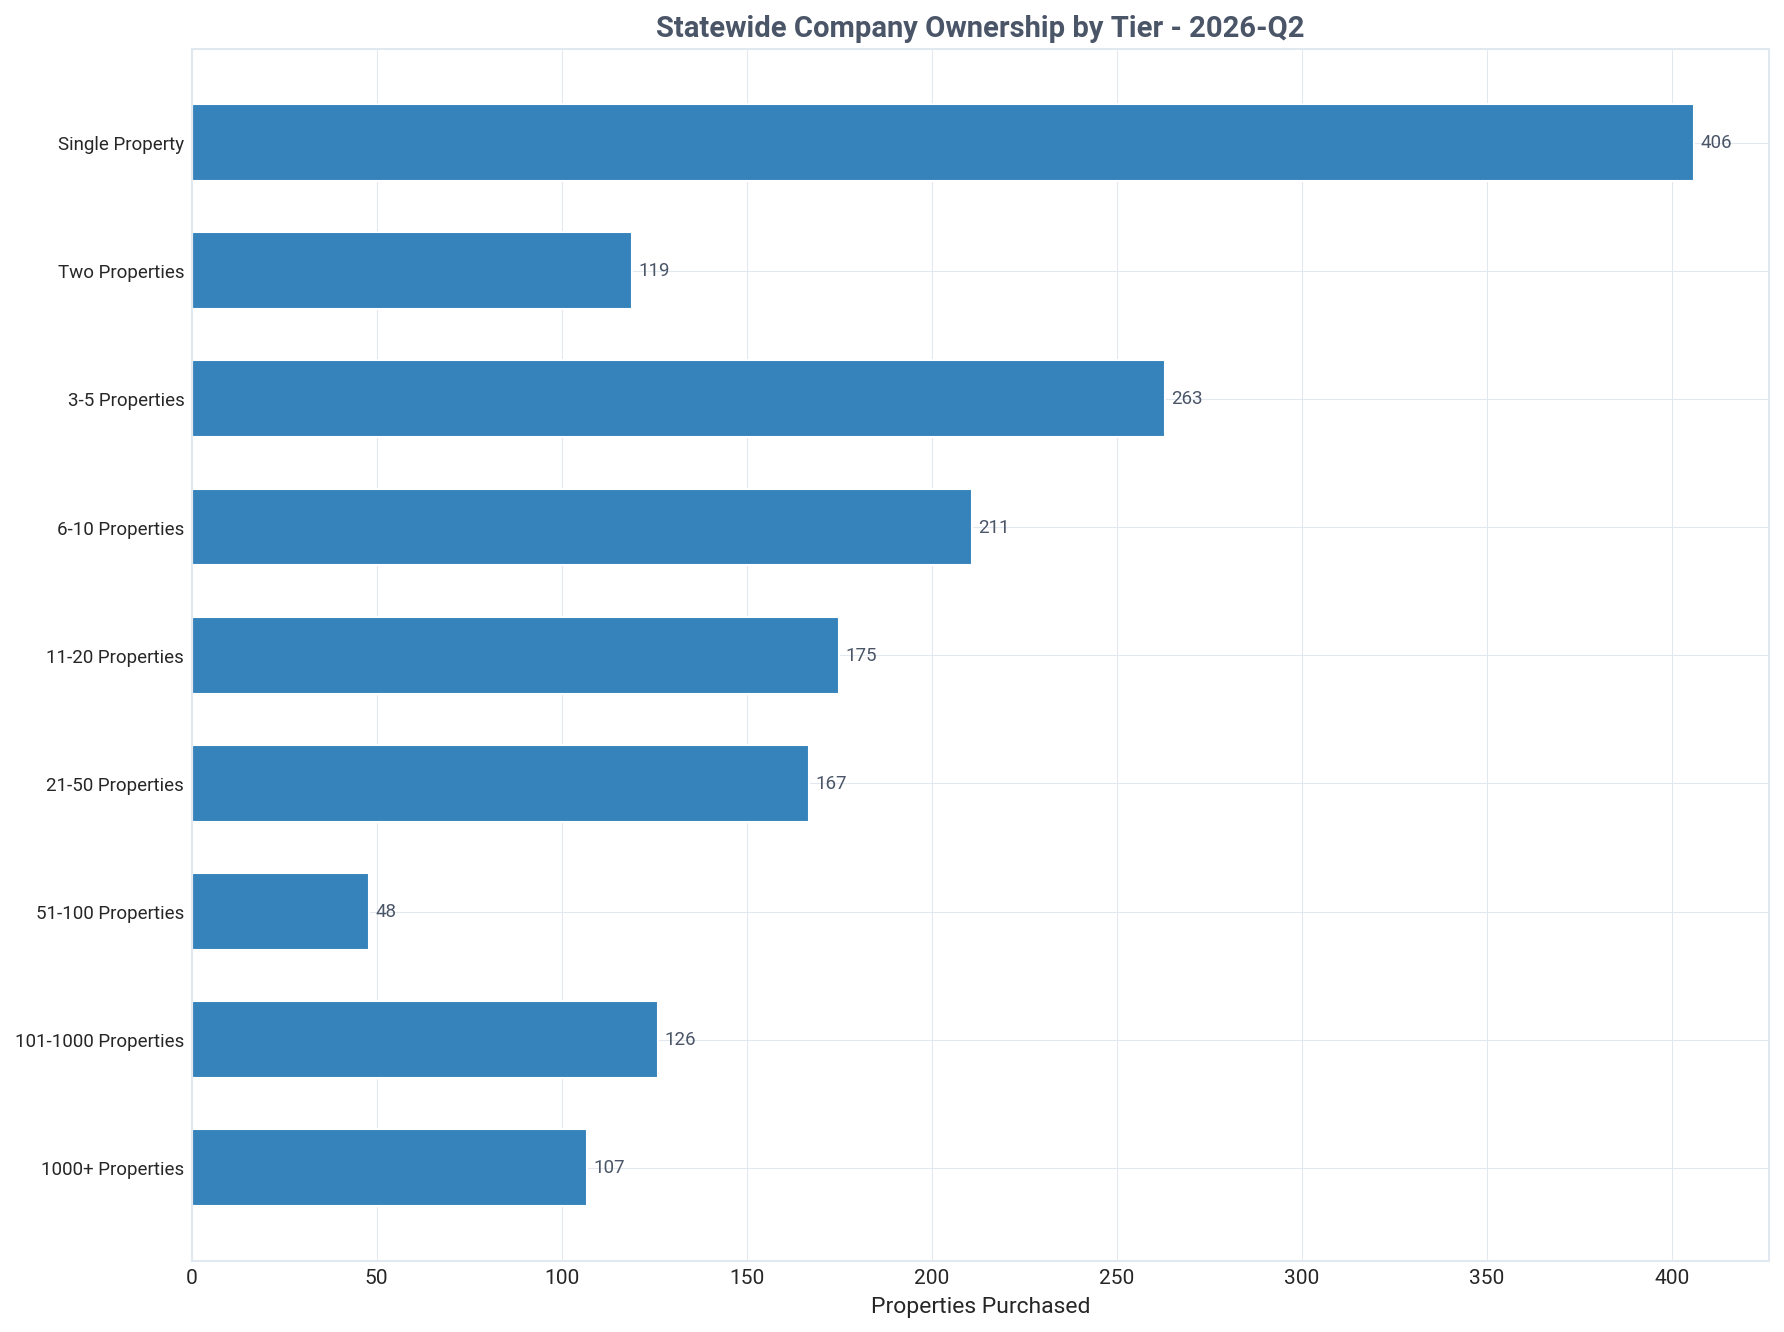
Maryland: company purchases by tier this quarter, Q2 2026
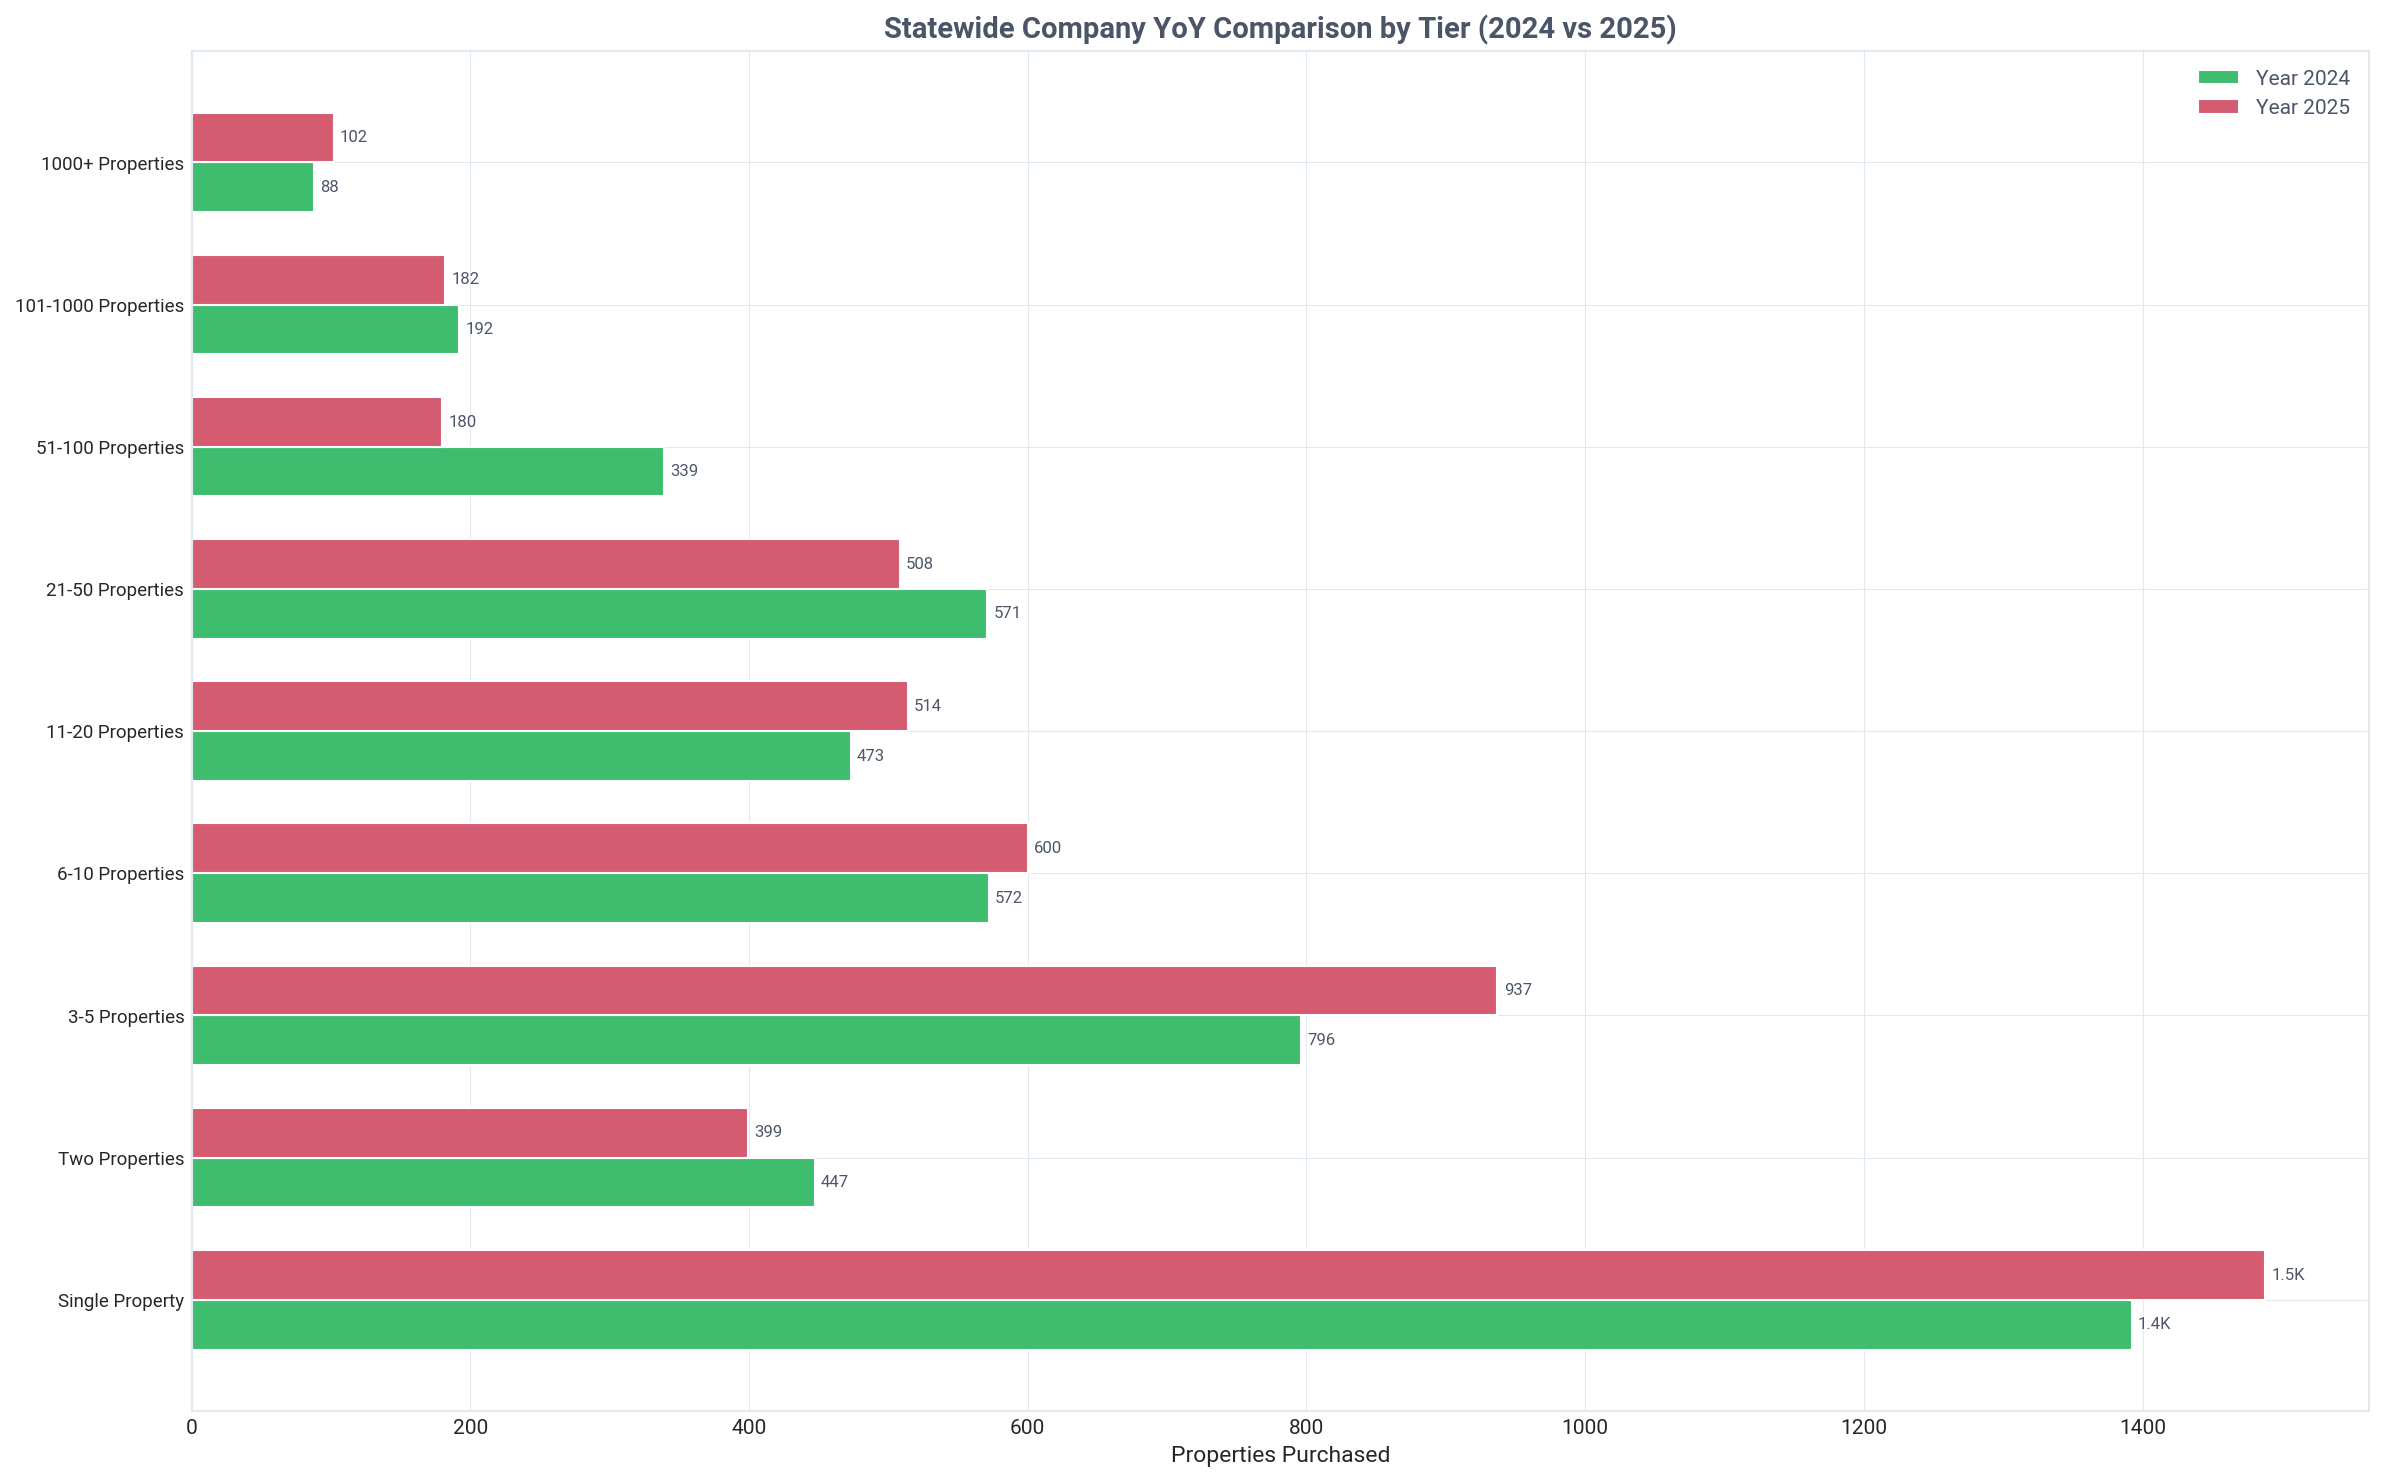
Maryland: company purchases by tier year over year, Q2 2026
Key Insight
Individuals dominate small portfolios, but companies become the majority owner at the 6-10 property tier.
Detailed Findings

A clear demarcation exists between individual and company ownership based on portfolio size. Individuals are the dominant force in smaller tiers, owning 86.3% of single-property investments and 68.9% in the two-property tier.

The crossover point where corporate ownership prevails occurs in the 6-10 property tier. At this level, companies own 7,613 properties (65.8%), surpassing the 3,952 properties (34.2%) held by individuals. This suggests investors often incorporate as their portfolios reach a certain scale.

Company ownership becomes increasingly concentrated in larger portfolios. For investors holding 11-20 properties, companies own 81.6% of the homes. This dominance grows to 90.2% in the 51-100 property tier and 94.5% in the 101-1,000 property tier.

Even at the smallest scale, corporate structures are present. Companies own 21,198 single-property investments, representing 13.7% of that tier. This indicates some investors choose to incorporate from their very first purchase for liability or financial reasons.

This ownership pattern highlights a professionalization curve in real estate investing. As investors scale their operations beyond five properties, they increasingly transition from personal ownership to formal business structures to manage their growing assets.

Geographic Distribution

Regional breakdown of investor activity and ownership patterns

Key Insight
Baltimore City is the epicenter of investor ownership by volume, with 75,946 properties.
Detailed Findings

Investor activity in Maryland is highly concentrated geographically, with Baltimore City serving as the primary hub. The city contains 75,946 investor-owned properties, representing 18.5% of its local SFR market and a third of the entire state's investor portfolio.

While Baltimore leads in volume, several smaller counties exhibit a much higher rate of investor ownership. Garrett County has the highest concentration at 39.1%, followed by Worcester County (31.2%) and Dorchester County (28.7%), likely driven by demand for vacation and second-home rentals.

The three most populous areas for investors, Baltimore (75,946), Montgomery (20,349), and Prince George's (19,638) counties, collectively hold 115,933 properties. This accounts for 51.5% of all investor-owned SFRs in Maryland, underscoring the importance of these urban and suburban centers.

The data reveals two distinct geographic strategies: high-volume investment in dense urban centers like Baltimore and high-penetration investment in smaller, specialized markets like Garrett County. This can be verified with detailed assessor data.

Suburban counties near major metropolitan areas also show significant investor presence. Anne Arundel County (16,117 properties, 9.7% rate) and Howard County (8,001 properties, 9.0% rate) round out the top five for investor property counts, indicating strong rental demand in these affluent areas.

Maryland: landlord ownership map, Q2 2026
Maryland: top 15 areas by landlord-owned properties, Q2 2026
Maryland: top 15 areas by landlord ownership share, Q2 2026

Historical Transactions

Buy/sell transaction trends over time for all landlords and institutional investors

Maryland: landlord buy and sell transactions, Q2 2026
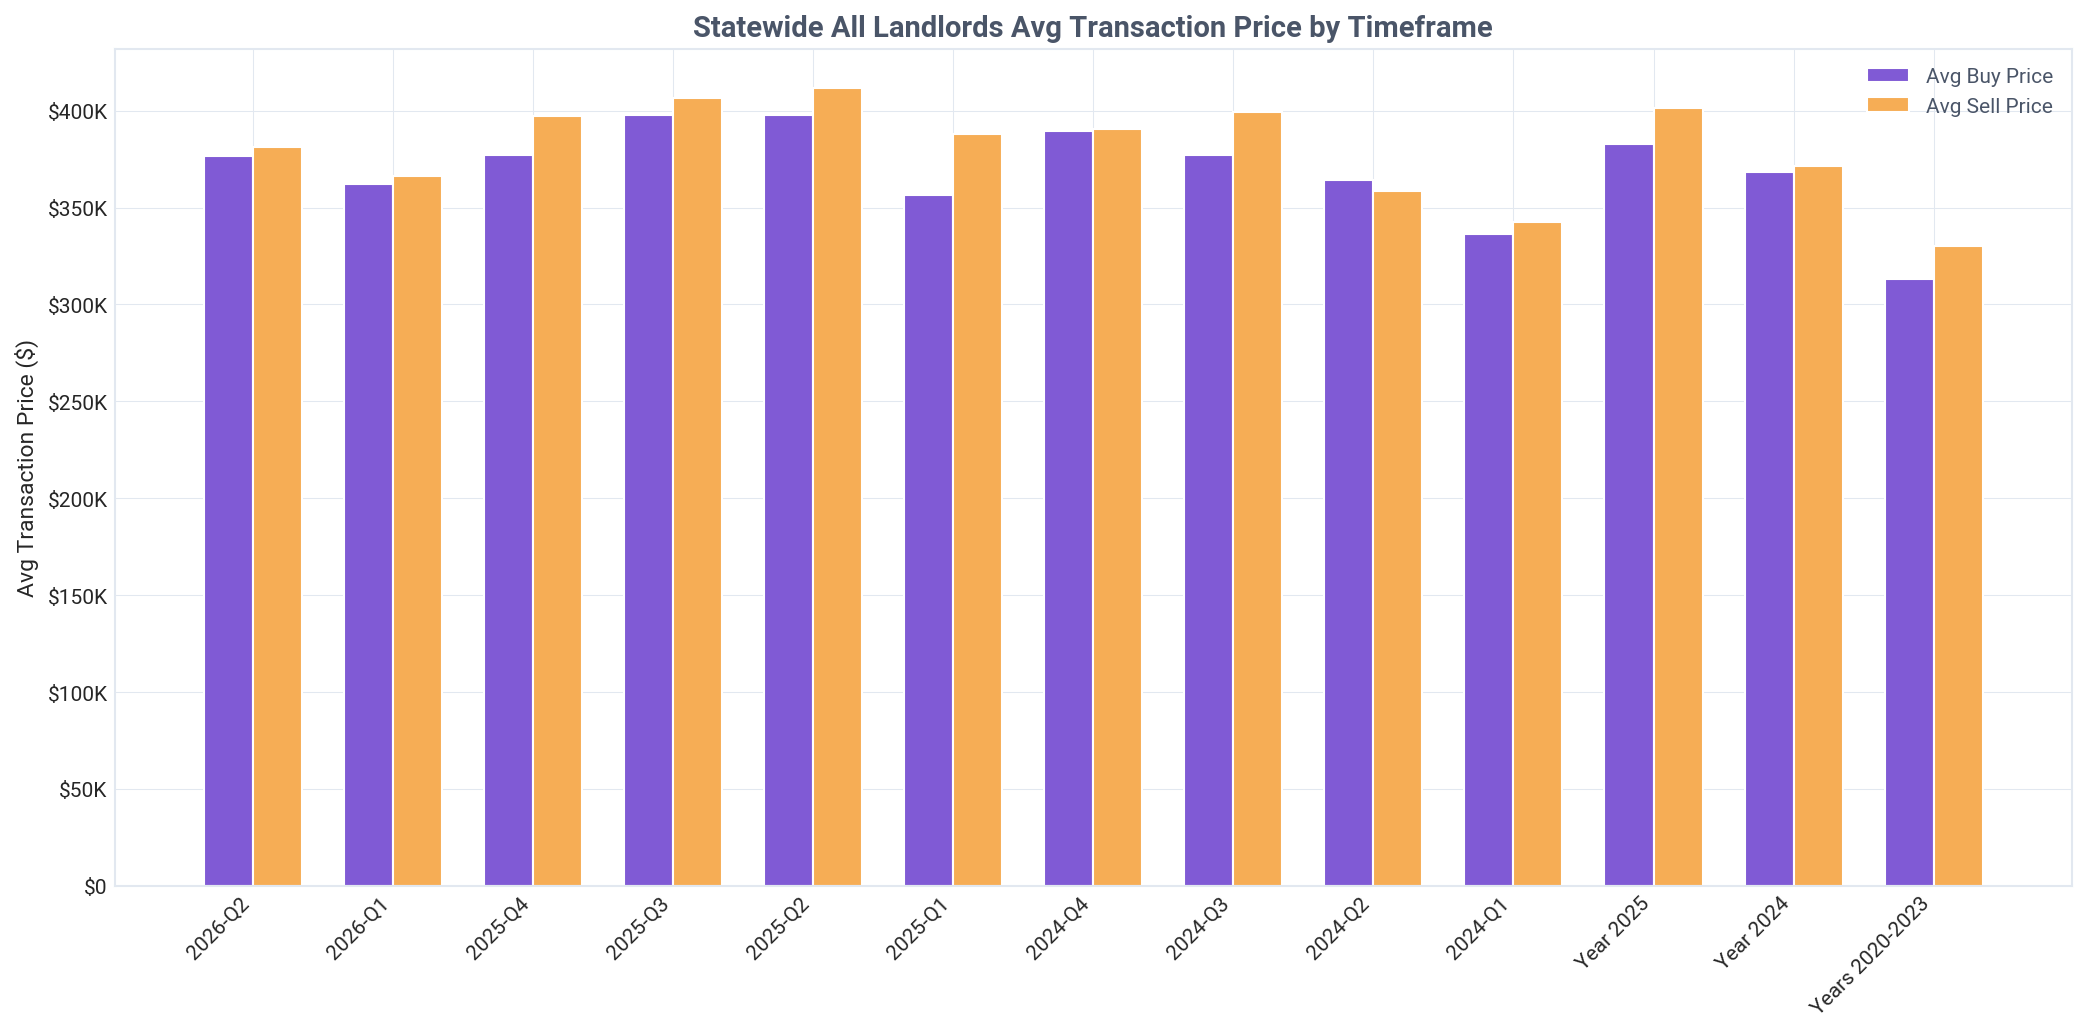
Maryland: landlord average buy and sell prices, Q2 2026
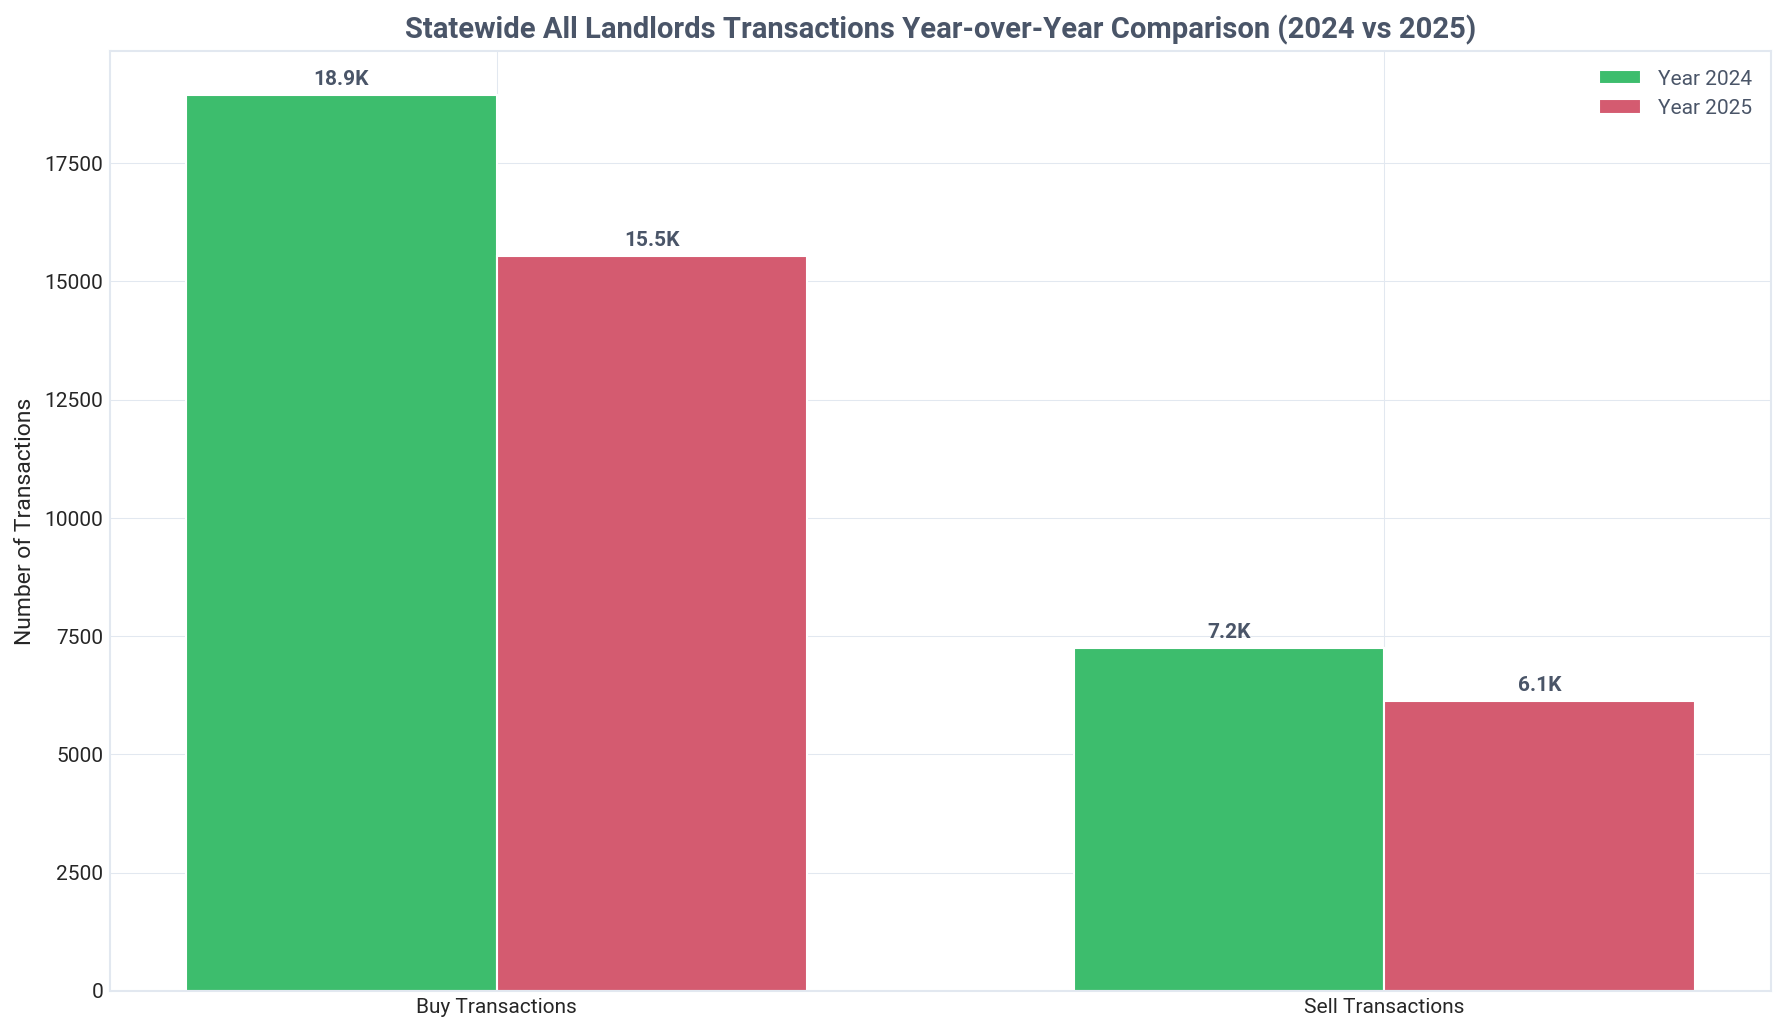
Maryland: landlord transactions year over year, Q2 2026
Maryland: 1000+ tier company transactions, Q2 2026
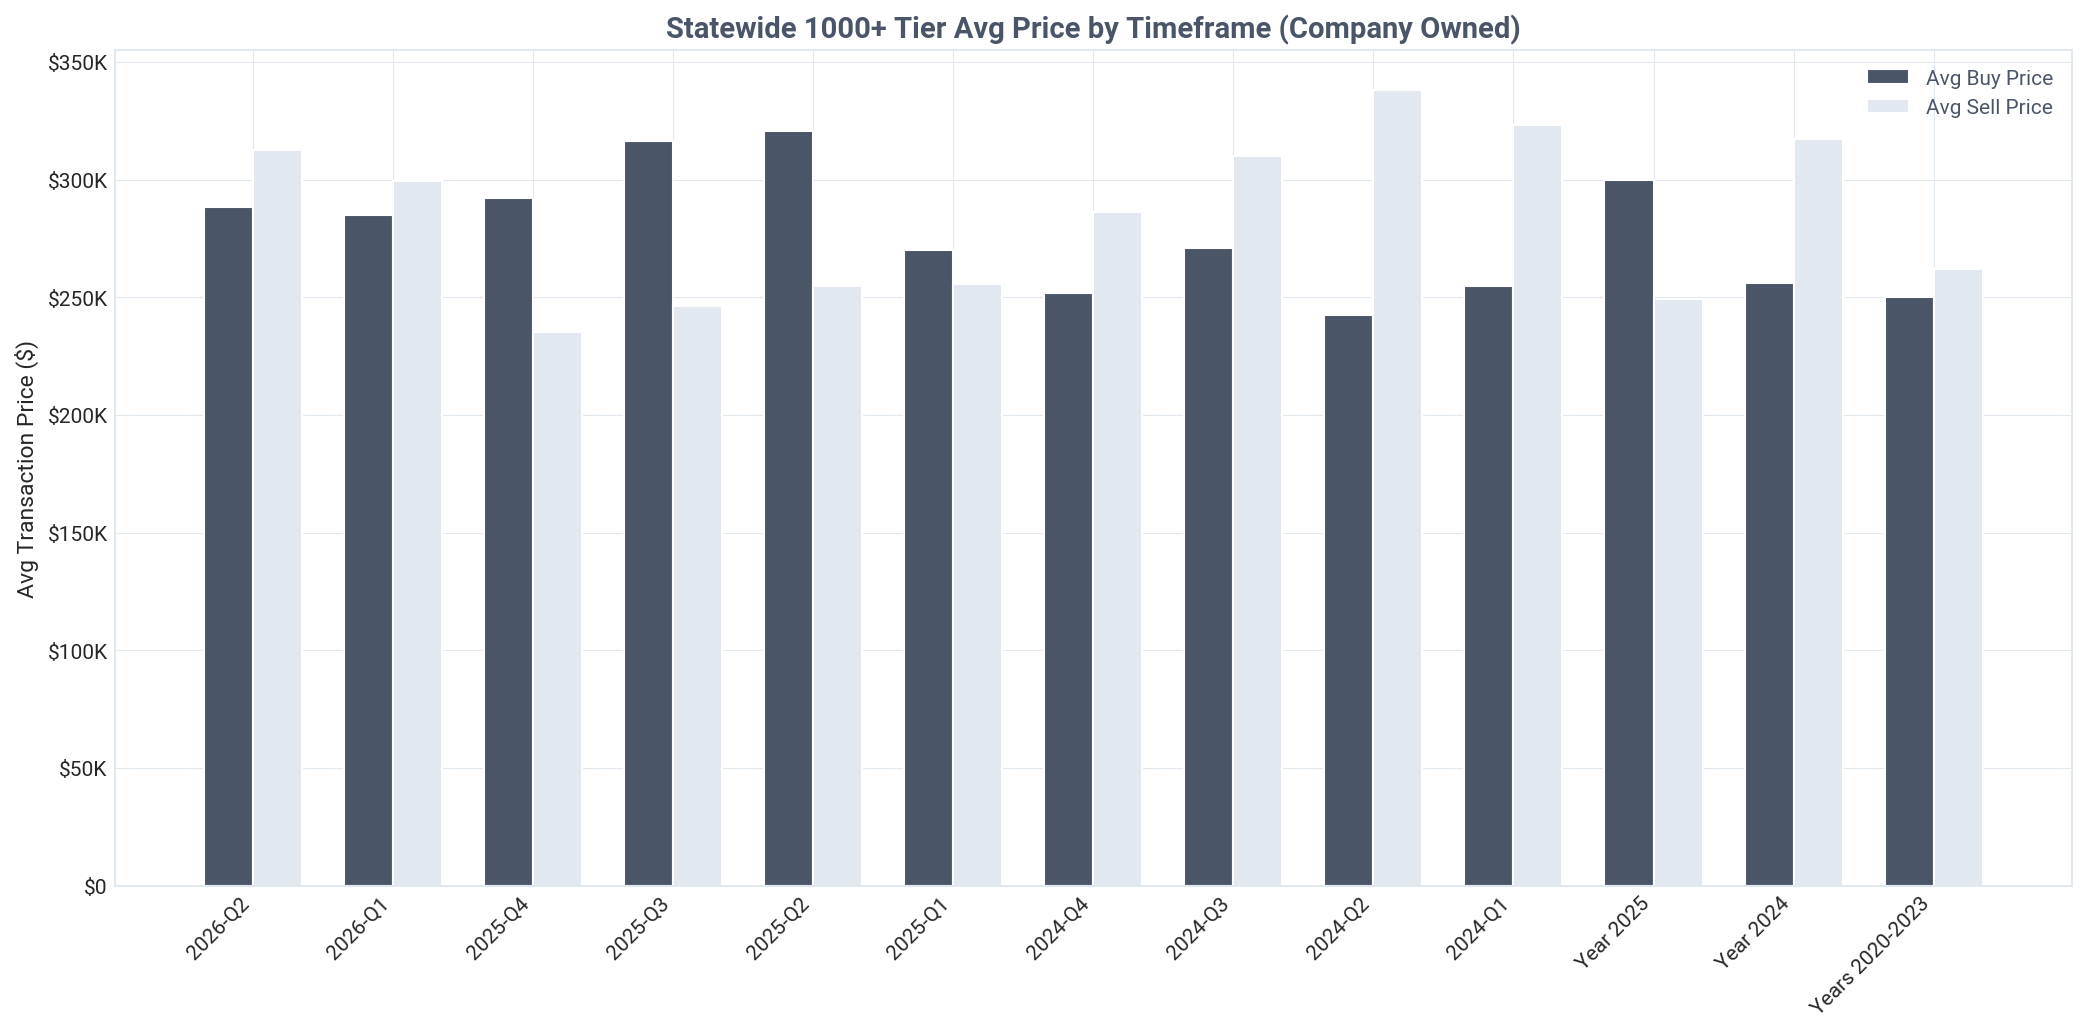
Maryland: 1000+ tier company average prices, Q2 2026
Maryland: 1000+ tier transactions year over year, Q2 2026
Key Insight
Maryland landlords are strong net buyers, acquiring 2.48 properties for every one sold in Q2 2026.
Detailed Findings

The Maryland investor market is in a clear expansion phase, with landlords acting as decisive net buyers. In Q2 2026, they purchased 3,299 properties while selling only 1,330, resulting in a net gain of 1,969 properties and a buy-to-sell ratio of 2.48.

This aggressive acquisition trend is not new; it has been consistent over the past year. Landlords were also net buyers in Q1 2026 (3,074 buys vs. 1,293 sells) and throughout 2025, when they added a net 9,409 properties to their portfolios for the year.

Institutional investors (1,000+ tier) have notably reversed their strategy. After being net sellers in 2024 with 221 more sales than purchases, they have become net buyers in 2026. In Q2 2026, they bought 123 properties and sold only 44, a buy-to-sell ratio of 2.80, indicating a renewed appetite for Maryland assets.

Transaction volumes for all landlords have remained robust, with 15,535 purchases in 2025 and 18,933 in 2024. The pace in the first half of 2026 suggests another strong year of investment activity is underway, a trend visible in ongoing Investor Pulse reports.

The consistent net buying across different market segments, including the recent pivot by institutions, signals broad confidence in Maryland's rental market and a collective effort to grow rental housing inventory.

Current Quarter Transactions

Q2 2026 transaction analysis by tier, price, and inter-landlord activity

Key Insight
Landlords were involved in 13.7% of all Maryland SFR transactions in Q2 2026, making 3,299 purchases.
Detailed Findings

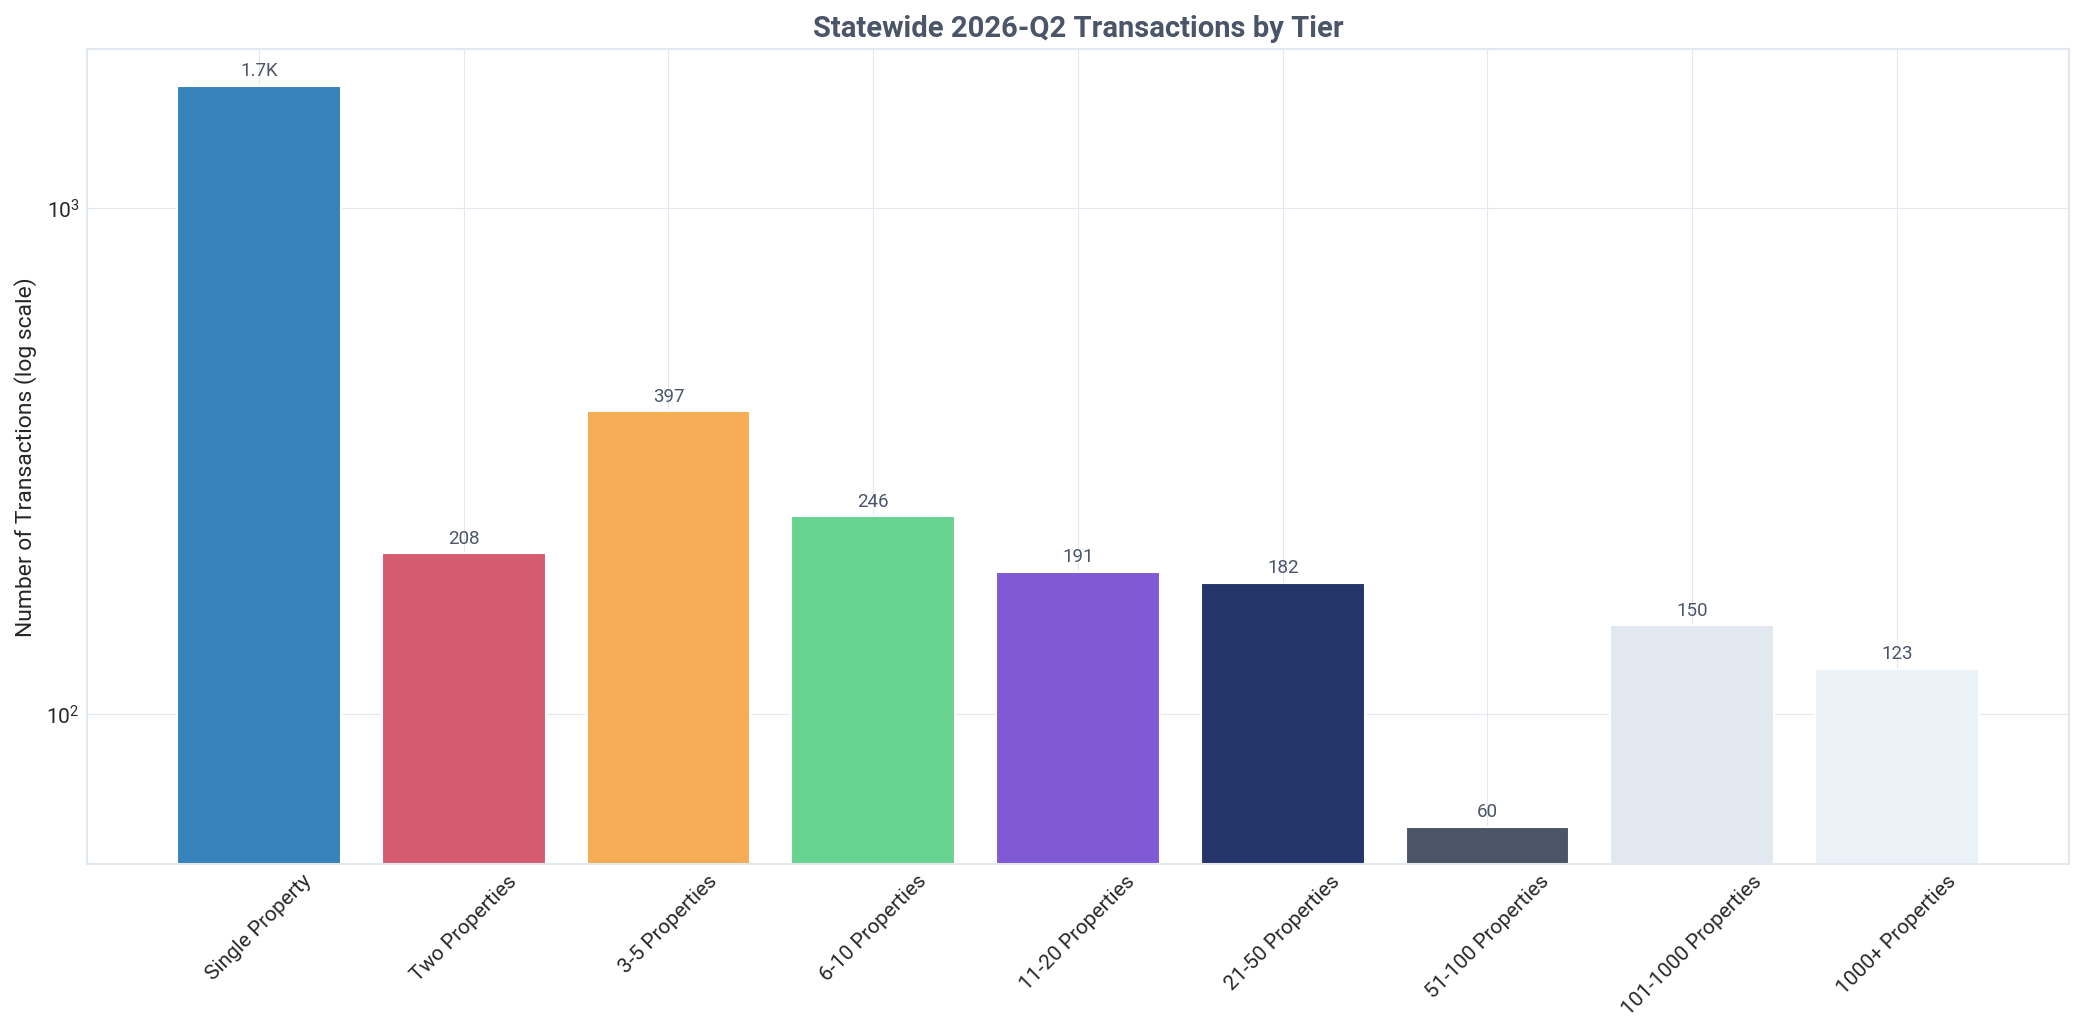
In Q2 2026, landlords participated in 13.7% of all 24,040 SFR transactions in Maryland, acquiring 3,299 properties. This activity was heavily driven by mom-and-pop investors (Tiers 01-04), who were responsible for 2,593 of these transactions.

A clear pattern in acquisition pricing emerges, with the smallest investors paying the highest prices. Single-property buyers, often new to the market, paid an average of $450,308. In stark contrast, institutional investors paid an average of $288,558, securing a 35.9% discount compared to new entrants.

This pricing disparity suggests different acquisition strategies. New buyers may be purchasing turn-key properties at market rates, while larger, more experienced investors use tools like smart search to target off-market or distressed assets at a significant discount.

Inter-landlord trading activity varies by investor size. Mid-size investors in the 11-20 property tier were the most active in this channel, with 18.3% of their purchases coming from other landlords. This indicates a liquid secondary market for established portfolios.

Conversely, the largest investors (101-1,000 tier) sourced very few properties from other landlords, with only 2.7% of their purchases coming from this channel. This suggests they rely on different acquisition pipelines, such as bulk purchases or direct-to-seller marketing, rather than buying from the existing investor pool.

Maryland: landlord share of transactions, Q2 2026
Maryland: transactions by tier this quarter, Q2 2026
Maryland: average purchase price by tier, Q2 2026

Ready to leverage this data for your real estate investment decisions?

TALK TO AN EXPERT

Executive Summary

Maryland's rental market is dominated by small landlords who own 89.9% of stock and pay 33% less than homeowners.
Holdings
In Maryland, landlords own 225,121 single-family residential properties, representing 13.1% of the total market. Individual investors are the primary owners, holding 163,608 properties (72.7%) compared to 64,451 (28.6%) for companies.
Pricing
Landlords in Q2 2026 secured a significant 33.2% discount compared to traditional homeowners, paying an average of $386,973 while homeowners paid $579,107, a gap of $192,134 per property.
Activity
Investor activity accounted for 15.3% of all SFR purchases in Q2 2026, with 2,748 properties acquired. The market saw a major influx of small investors, as 1,726 new single-property landlords entered.
Market Share
The market is overwhelmingly controlled by small-scale investors, with mom-and-pop landlords (1-10 properties) owning 89.9% of all investor-held SFRs. In stark contrast, institutional investors (1,000+ properties) control just 0.5%.
Ownership Type
Individual investors form the backbone of smaller portfolios, but companies become the majority owners in the 6-10 property tier, holding 65.8% of properties. This trend accelerates in larger tiers, where companies represent over 90% of ownership.
Transactions
Landlords remain aggressive net buyers with a 2.48 buy-to-sell ratio in Q2 2026 (3,299 buys vs. 1,330 sells). Institutional investors have also returned to acquisition mode, becoming net buyers after being net sellers in 2024.
Market Narrative

The single-family rental market in Maryland is overwhelmingly shaped by small, individual investors, not large corporations. Landlords own 225,121 properties, or 13.1% of the state's total SFR housing stock. This portfolio is dominated by mom-and-pop investors (1-10 properties), who control 89.9% of all investor-owned homes. In stark contrast, institutional investors (1,000+ properties) own a mere 0.5%. Ownership is primarily in the hands of individuals, who hold 72.7% of these properties, while companies own the remaining 28.6%, typically in larger, more professionalized portfolios. Analysis of these property datasets reveals a highly fragmented and decentralized market structure.

In terms of behavior, Maryland's investors are skilled and active acquirers. In Q2 2026, they purchased 15.3% of all homes sold, demonstrating a significant appetite for new properties. They achieved this while securing a remarkable 33.2% average discount compared to traditional homeowners, paying $386,973 versus the homeowner average of $579,107. The market is also in a clear growth phase, with landlords acting as strong net buyers, acquiring 2.48 homes for every one they sold. This trend includes a notable reversal from institutional investors, who have pivoted from being net sellers in 2024 to active net buyers in 2026, often leveraging mortgage transaction data to identify opportunities.

The key takeaway for the Maryland housing market is that its rental supply is sustained by a vast base of local, small-scale entrepreneurs. The narrative of a 'Wall Street' takeover does not apply here. Instead, the data points to a competitive and accessible market where 1,726 new landlords entered in a single quarter. These investors' ability to find and acquire properties at a deep discount is a critical advantage, ensuring a continued flow of capital into the rental housing sector. This dynamic, visible in ongoing market reports dashboard, suggests a resilient and growing market driven by individual ambition rather than institutional strategy.

About This Report

Report Methodology

This report analyzes BatchData's Investor Pulse dataset, covering single-family residential (SFR) investor activity across the United States.

Data is extracted from 15 CSV files covering ownership, transactions, and pricing trends, then analyzed using AI-powered insights.

Property Counting Methodology:

Distinct Counts: All headline totals represent distinct properties. If 2+ landlords co-own the same property, it's counted only once. This provides accurate market representation.

Category Breakdowns: When analyzing by tier (01-09), owner type (Individual/Corporate), or occupancy status, properties with co-ownership across categories are counted once per category. This causes breakdowns to sum 2-4% higher than totals, and percentages may sum to 100-104%. This is expected and reflects co-ownership patterns.

Tier Properties Category
01-041-10Mom-and-Pop
05-0711-100Mid-Size
08101-1000Large
091000+Institutional
About BatchData

BatchData provides comprehensive real estate data and analytics, offering insights into property ownership, investor activity, and market trends across the United States.

The Investor Pulse dataset tracks single-family residential (SFR) investor behavior at national, state, county, and MSA levels.

For more information, visit batchdata.io or explore our API documentation.

Data Freshness
Report Generated October 28, 2026 at 11:22 PM
Data Period Q2 2026
Geography Level State
Geography Maryland
×
Chart Section2 Coverage
Maryland: SFR vs other property coverage, Q2 2026
×
Chart Section3 Ownership Donut
Maryland: SFR ownership share, company vs individual, Q2 2026
×
Chart Section3 Ownership Bar
Maryland: SFR properties by owner type, Q2 2026
×
Chart Section4 Distribution
Maryland: company vs individual landlords, Q2 2026
×
Chart Section5 Holdings
Maryland: landlord SFR holdings by type, Q2 2026
×
Chart Section6 Prices
Maryland: properties purchased by timeframe, Q2 2026
×
Chart Section6 Prices Alt
Maryland: average acquisition price by timeframe, Q2 2026
×
Chart Section6 Yoy Comparison
Maryland: average acquisition price year over year, Q2 2026
×
Chart Section6 Trends
Maryland: average acquisition price by buyer type, Q2 2026
×
Chart Section7 Purchases
Maryland: purchases by tier, Q2 2026
×
Chart Section7 Tiers
Maryland: purchased property share by tier, Q2 2026
×
Chart Section8 Distribution
Maryland: current ownership by purchase tier, Q2 2026
×
Chart Section8 Prices
Maryland: properties purchased by tier, all time, Q2 2026
×
Chart Section8 Prices Q4
Maryland: properties purchased by tier this quarter, Q2 2026
×
Chart Section8 Prices 2020
Maryland: properties purchased by tier, historical, Q2 2026
×
Chart Section8 Yoy Comparison
Maryland: properties purchased by tier year over year, Q2 2026
×
Chart Section9 Ownership
Maryland: ownership by tier and owner type, Q2 2026
×
Chart Section9 Growth
Maryland: company purchases by tier, all time, Q2 2026
×
Chart Section9 Growth Q4
Maryland: company purchases by tier this quarter, Q2 2026
×
Chart Section9 Yoy Comparison
Maryland: company purchases by tier year over year, Q2 2026
×
Chart Section10 Top Regions
Maryland: top 15 areas by landlord-owned properties, Q2 2026
×
Chart Section10 Top Pct
Maryland: top 15 areas by landlord ownership share, Q2 2026
×
Chart Section10 Map
Maryland: landlord ownership map, Q2 2026
×
Chart Section11 Buysell
Maryland: landlord buy and sell transactions, Q2 2026
×
Chart Section11 Buysell Price
Maryland: landlord average buy and sell prices, Q2 2026
×
Chart Section11 Yoy All Landlords
Maryland: landlord transactions year over year, Q2 2026
×
Chart Section11 Institutional
Maryland: 1000+ tier company transactions, Q2 2026
×
Chart Section11 Institutional Price
Maryland: 1000+ tier company average prices, Q2 2026
×
Chart Section11 Yoy Institutional
Maryland: 1000+ tier transactions year over year, Q2 2026
×
Chart Section12 Transactions
Maryland: landlord share of transactions, Q2 2026
×
Chart Section12 Prices
Maryland: transactions by tier this quarter, Q2 2026
×
Chart Section12 Prices Detail
Maryland: average purchase price by tier, Q2 2026

Licensing & Usage Rights

This report, data, and all visual analyses are the property of BatchData © 2026 BatchService, Inc. and are licensed under Creative Commons Attribution-NonCommercial-NoDerivatives 4.0 International (CC BY-NC-ND 4.0).

You MAY: Download, share, or excerpt this content for personal or non-commercial purposes, provided you give clear attribution to BatchData with a link back to this original page.

You MAY NOT: Use this data commercially, resell or redistribute it as your own, or publish modified versions.

For commercial licensing: batchdata.io/contact-sales

Creative Commons BY-NC-ND 4.0 - creativecommons.org/licenses/by-nc-nd/4.0/

How to cite this report

BatchData. (2026). Q2 2026 MD State Report. BatchService, Inc. Retrieved from https://reports.batchdata.io/investorpulse-reports/2026-q2-state-md/. Licensed under CC BY-NC-ND 4.0.