Indiana Investor Pulse Report (2026-Q2)

Real Estate comprehensive investment analysis of investor activity in the Indiana single-family residential housing market. Discover ownership trends, transaction patterns, and market insights.

Market Overview

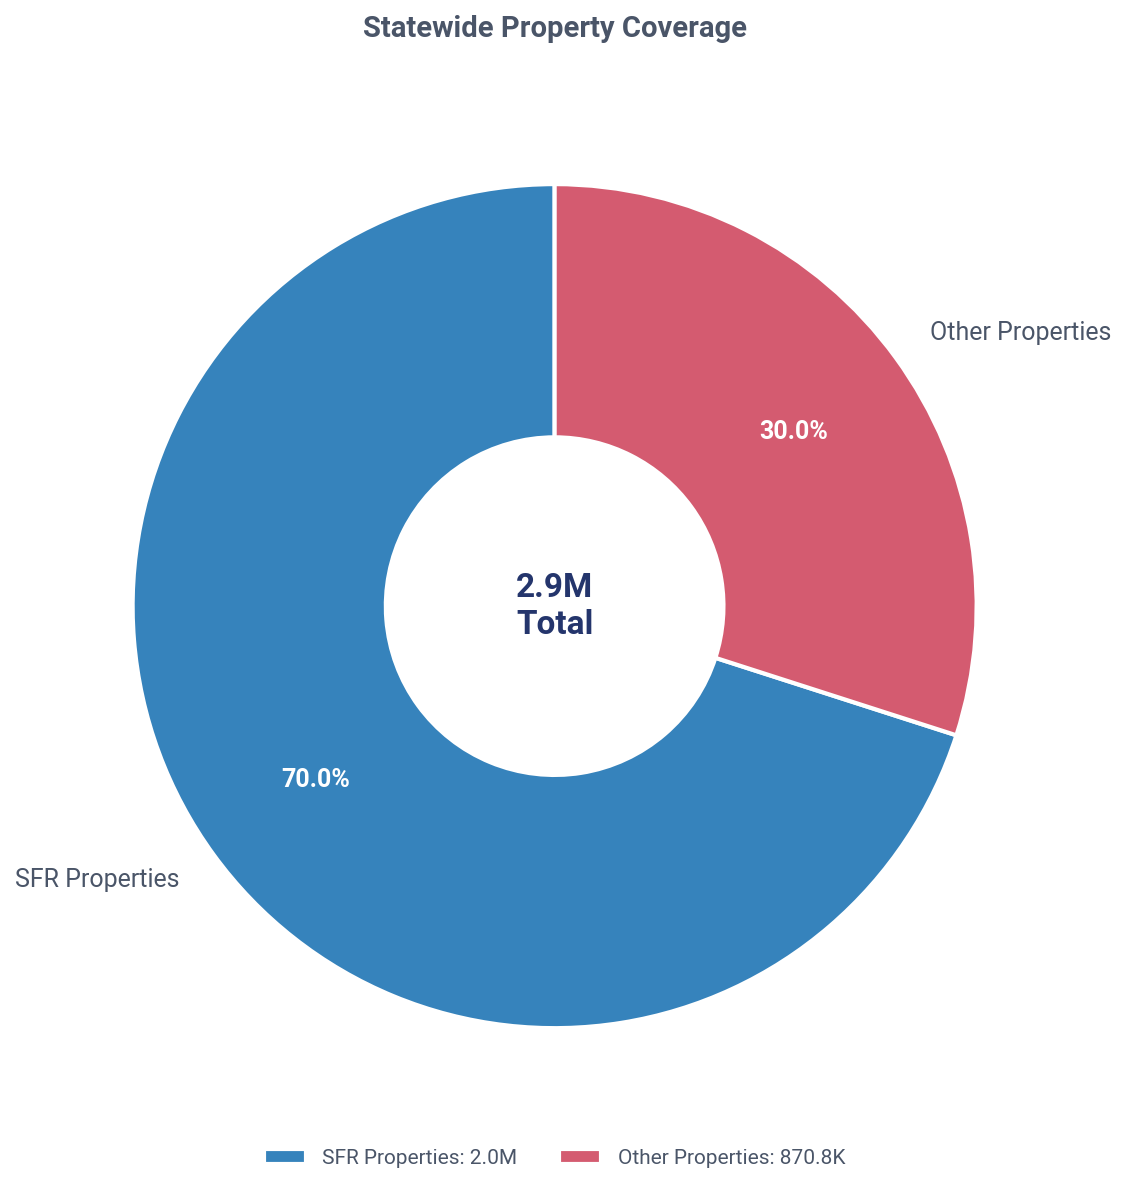
Total SFR Properties in Indiana
2,036,560
Total Investors in Indiana
226,199
Investor Owned SFR in Indiana
270,969(13.3%)
Individual Landlords
Landlords
187,479
SFR Owned
175,203
Corporate Landlords
Landlords
38,720
SFR Owned
99,250
Understanding Property Counts

Distinct Count Methodology: The total 270,969 represents distinct properties - if 2+ landlords co-own the same property, it's counted only once. This provides the most accurate representation of investor-owned SFR properties.

Why totals don't sum: When broken down by Individual vs Corporate ownership (or by tier), properties with co-ownership across categories are counted once per category. For example, if a property is co-owned by an individual AND a corporate landlord, it appears in both counts. This is why Individual + Corporate totals may exceed the distinct total by 2-4%, and percentages may sum to 100-104%.

Market Visualization

Indiana: SFR vs other property coverage, Q2 2026
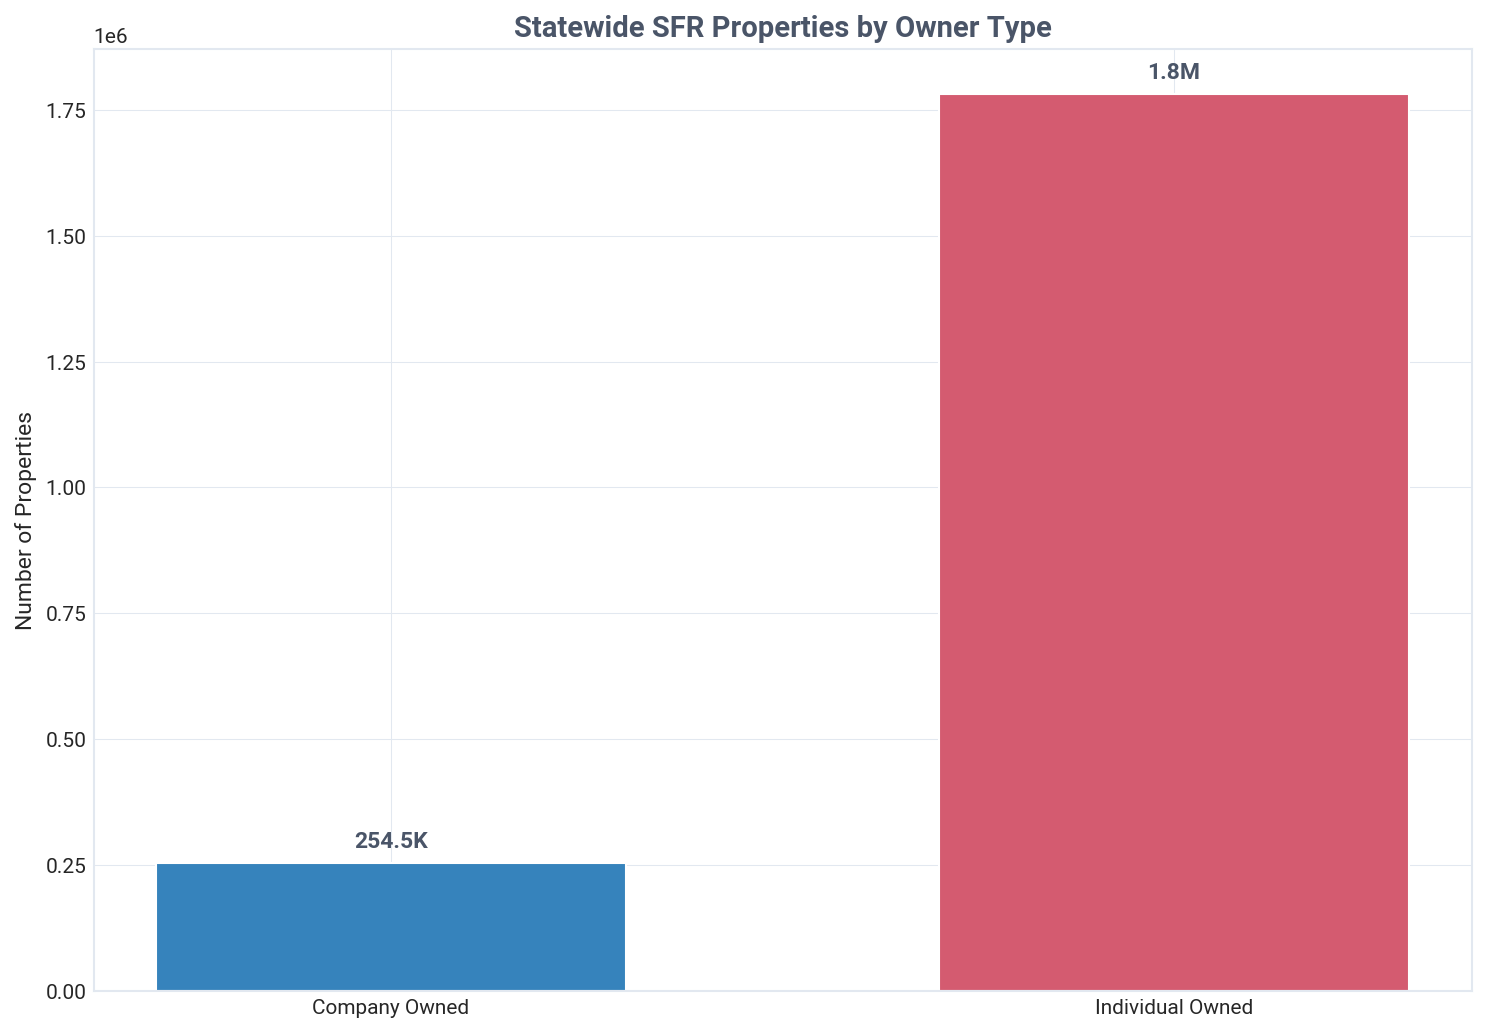
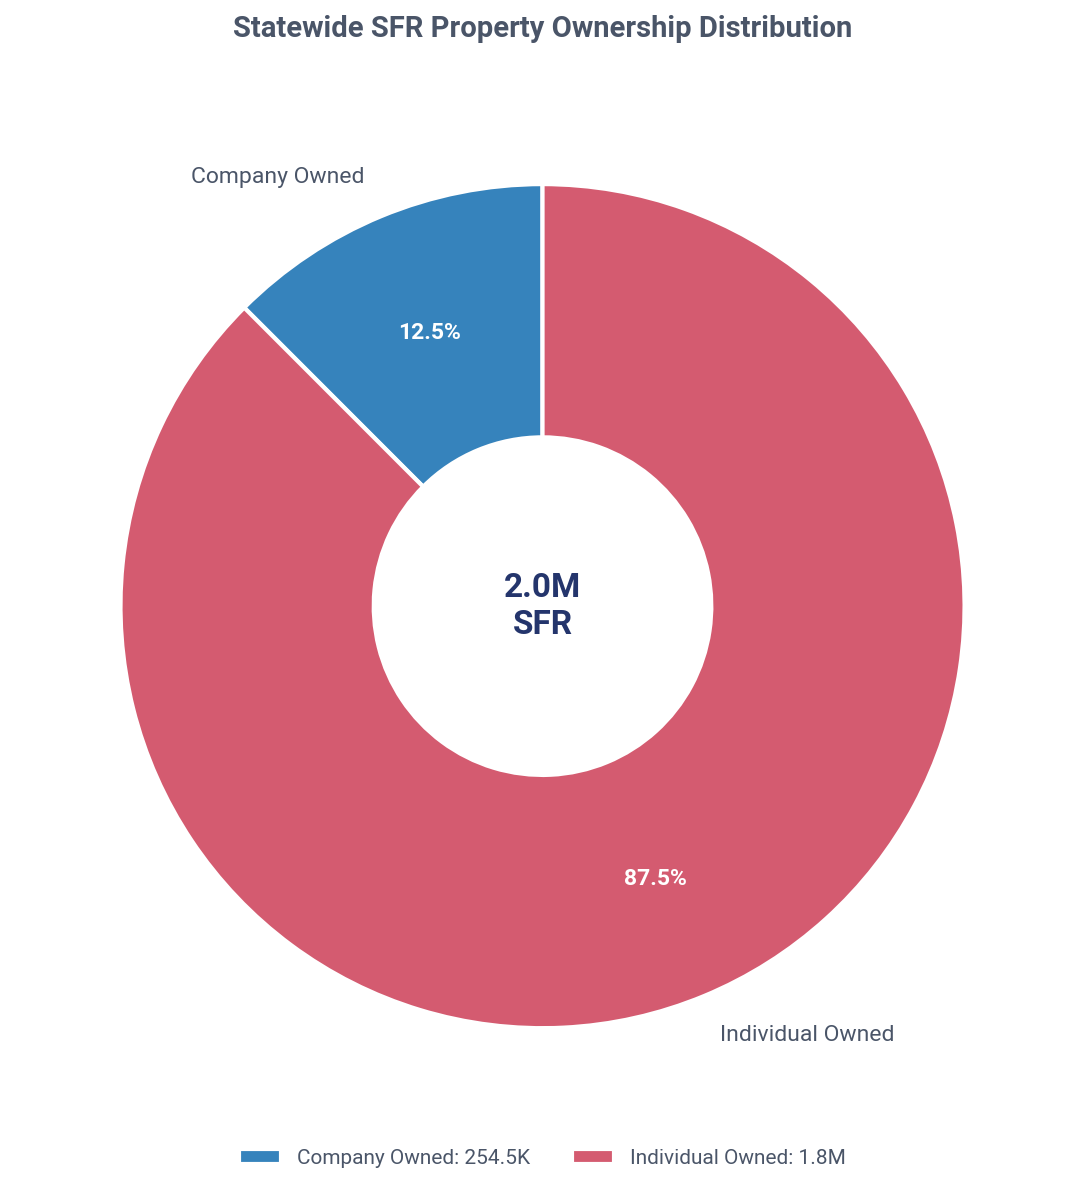
Indiana: SFR ownership share, company vs individual, Q2 2026
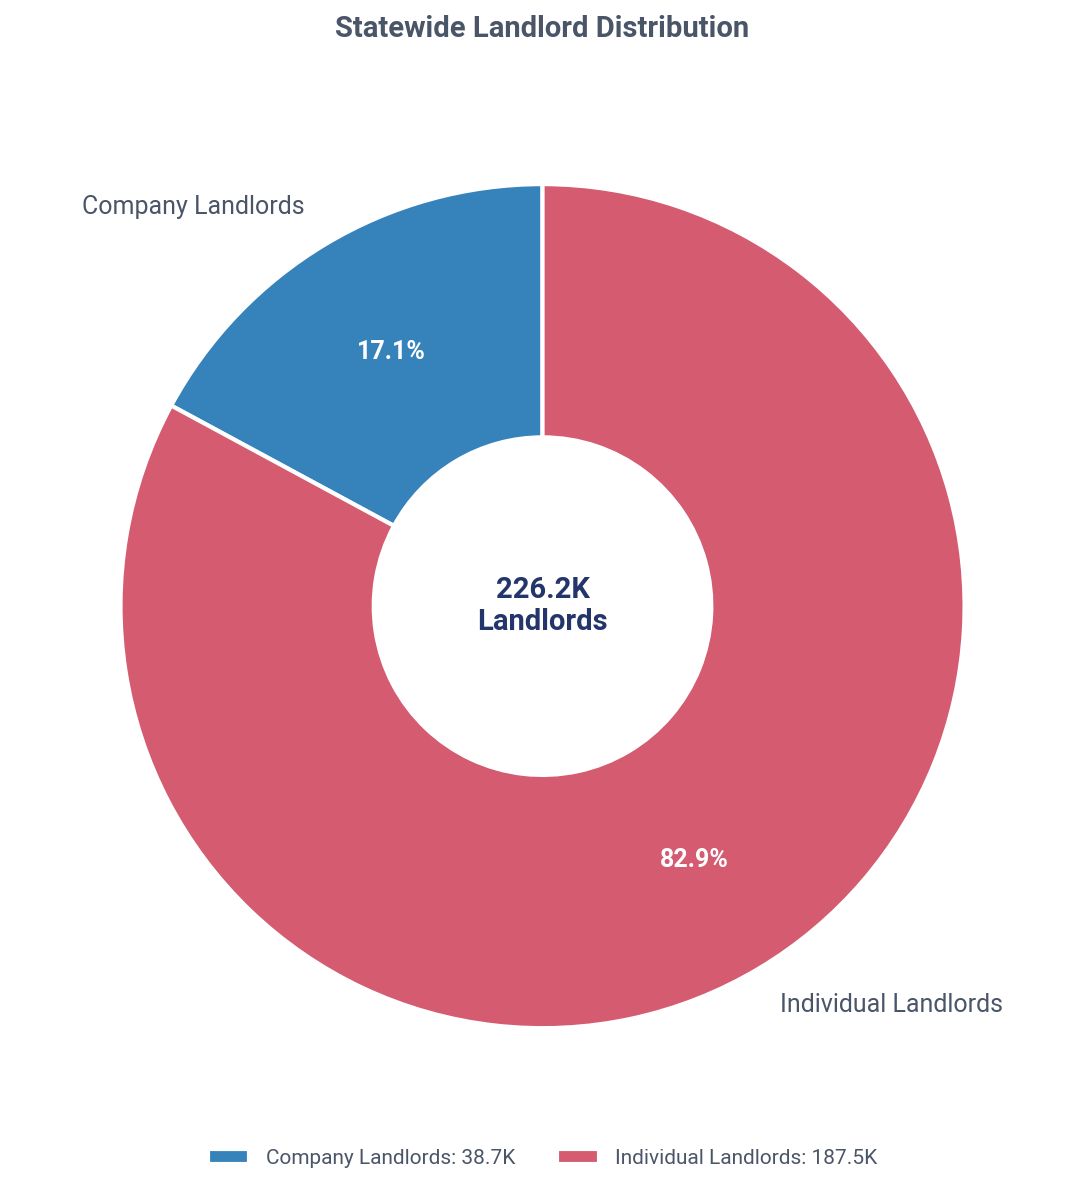
Indiana: company vs individual landlords, Q2 2026

Key Market Insights

Mom-and-Pop Landlords Dominate Indiana's Market While Institutional Investors Retreat as Net Sellers
Investors own 270,969 SFR properties in Indiana, 13.3% of the market, with small mom-and-pop landlords controlling 82.5% versus just 4.0% for institutional investors. In Q2 2026, landlords purchased 14.9% of homes sold at a significant 30.0% discount compared to homeowners. While the overall market saw investors as net buyers, institutional firms were net sellers, signaling a strategic shift.
Landlord Owned Current Holdings
Investors own 270,969 SFR properties in Indiana, with individuals holding 64.7% of the portfolio.
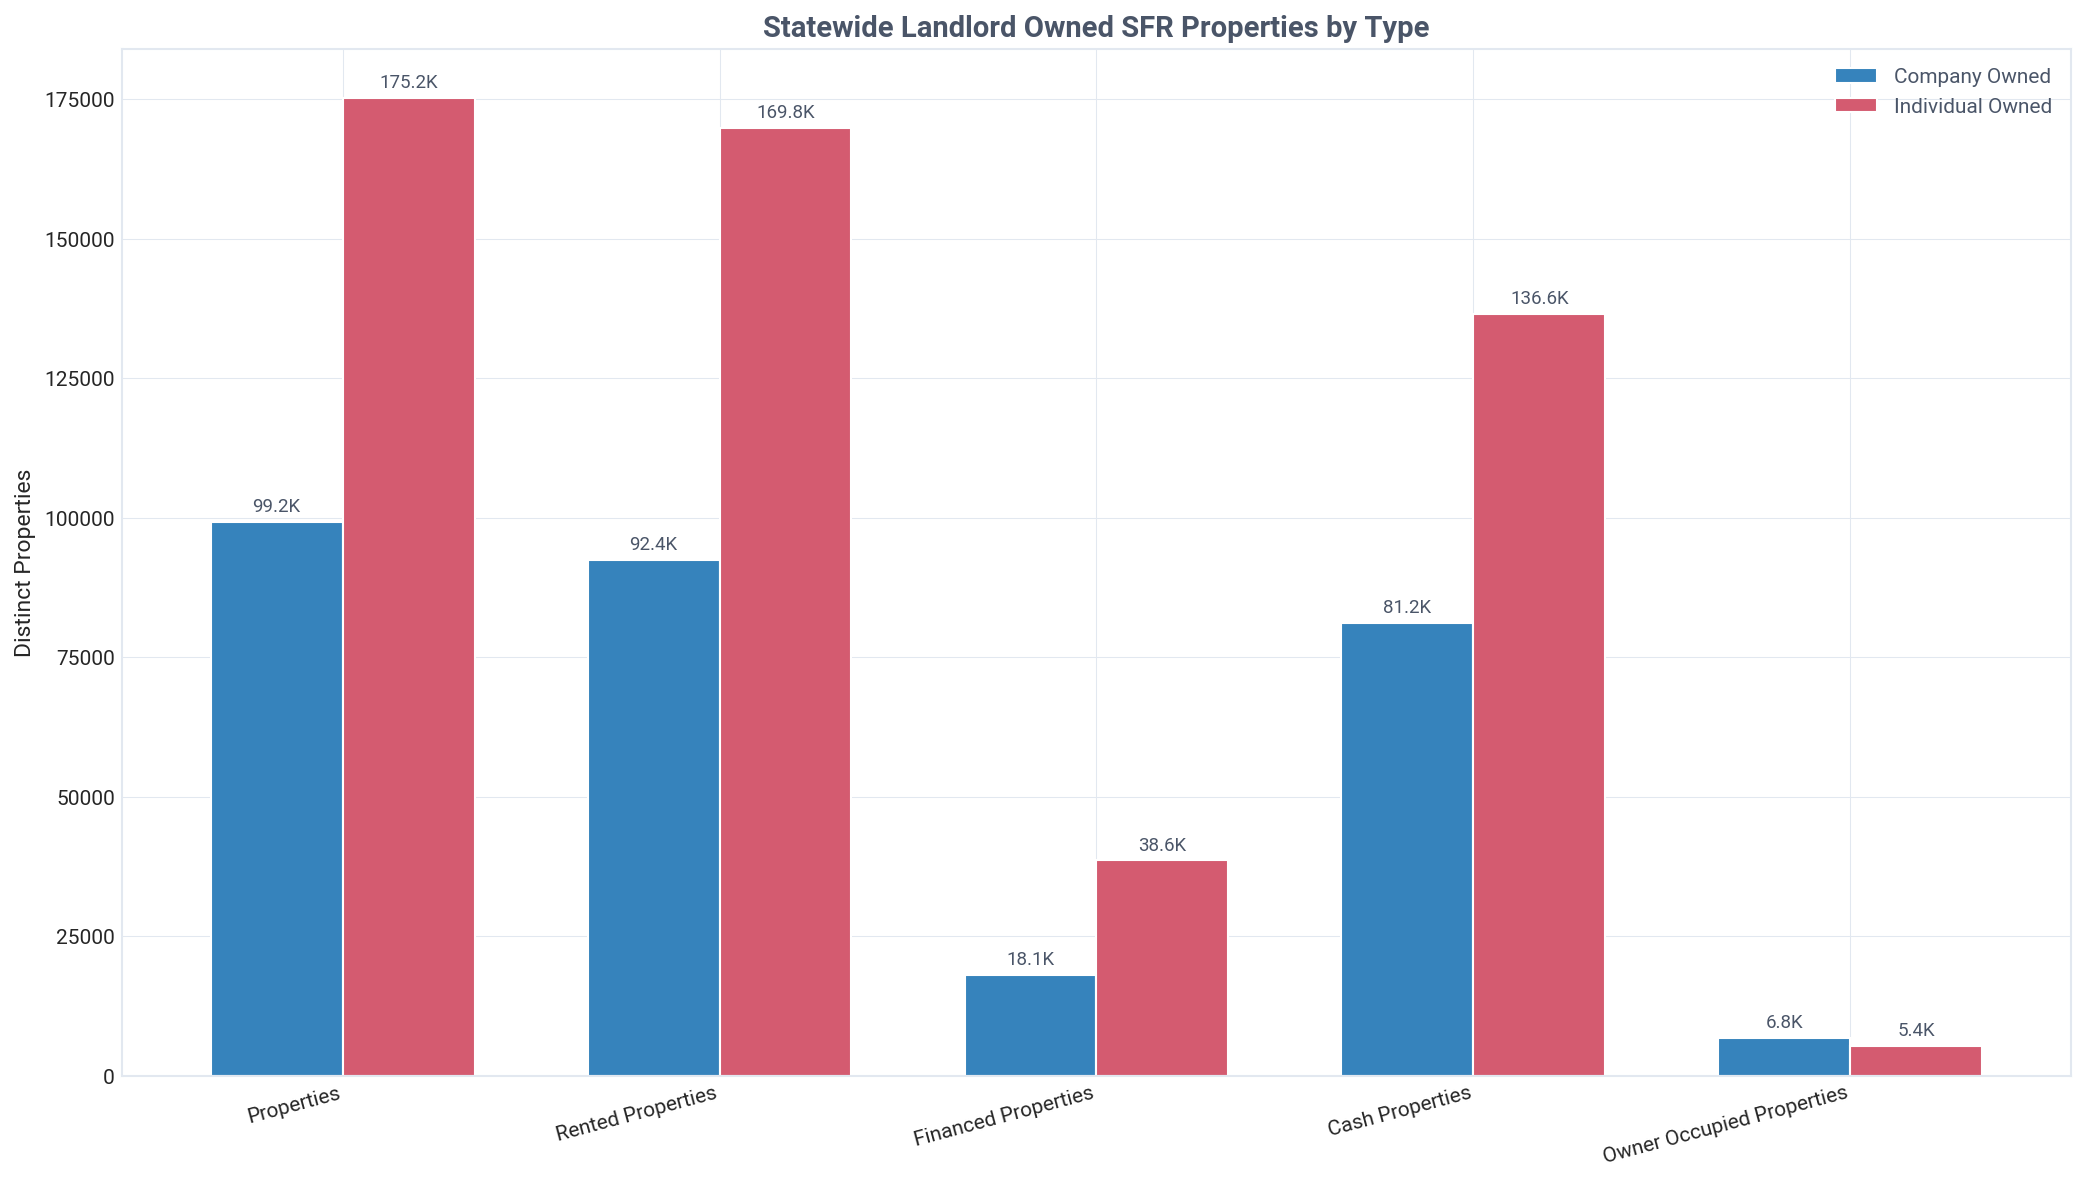
The majority of investor-owned properties, 214,723, were acquired with cash, compared to only 56,246 that are financed. Individual landlords, numbering 187,479, far outnumber the 38,720 company landlords. A total of 258,755 properties in the investor portfolio are classified as rented.
Landlord vs Traditional Homeowners
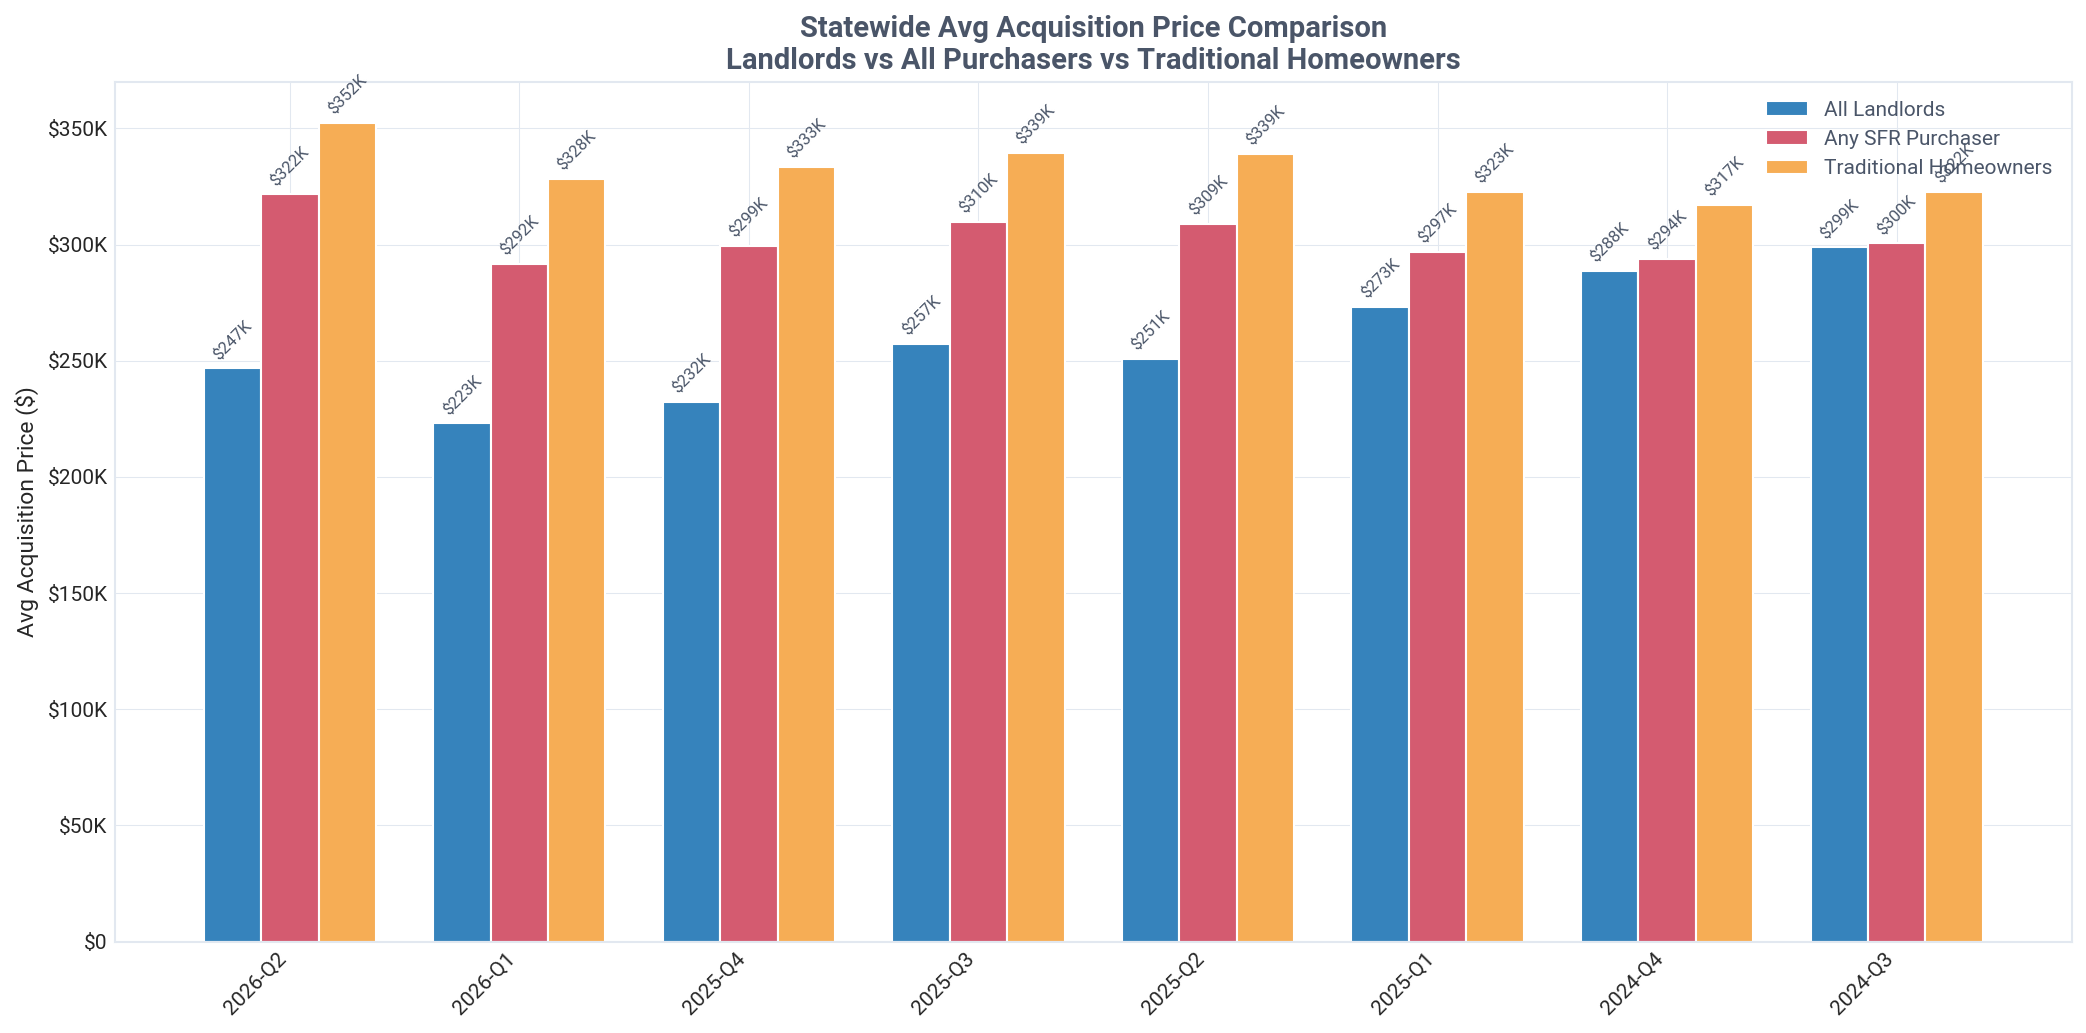
In Q2 2026, landlords paid 30.0% less than homeowners, an average discount of $105,727 per property.
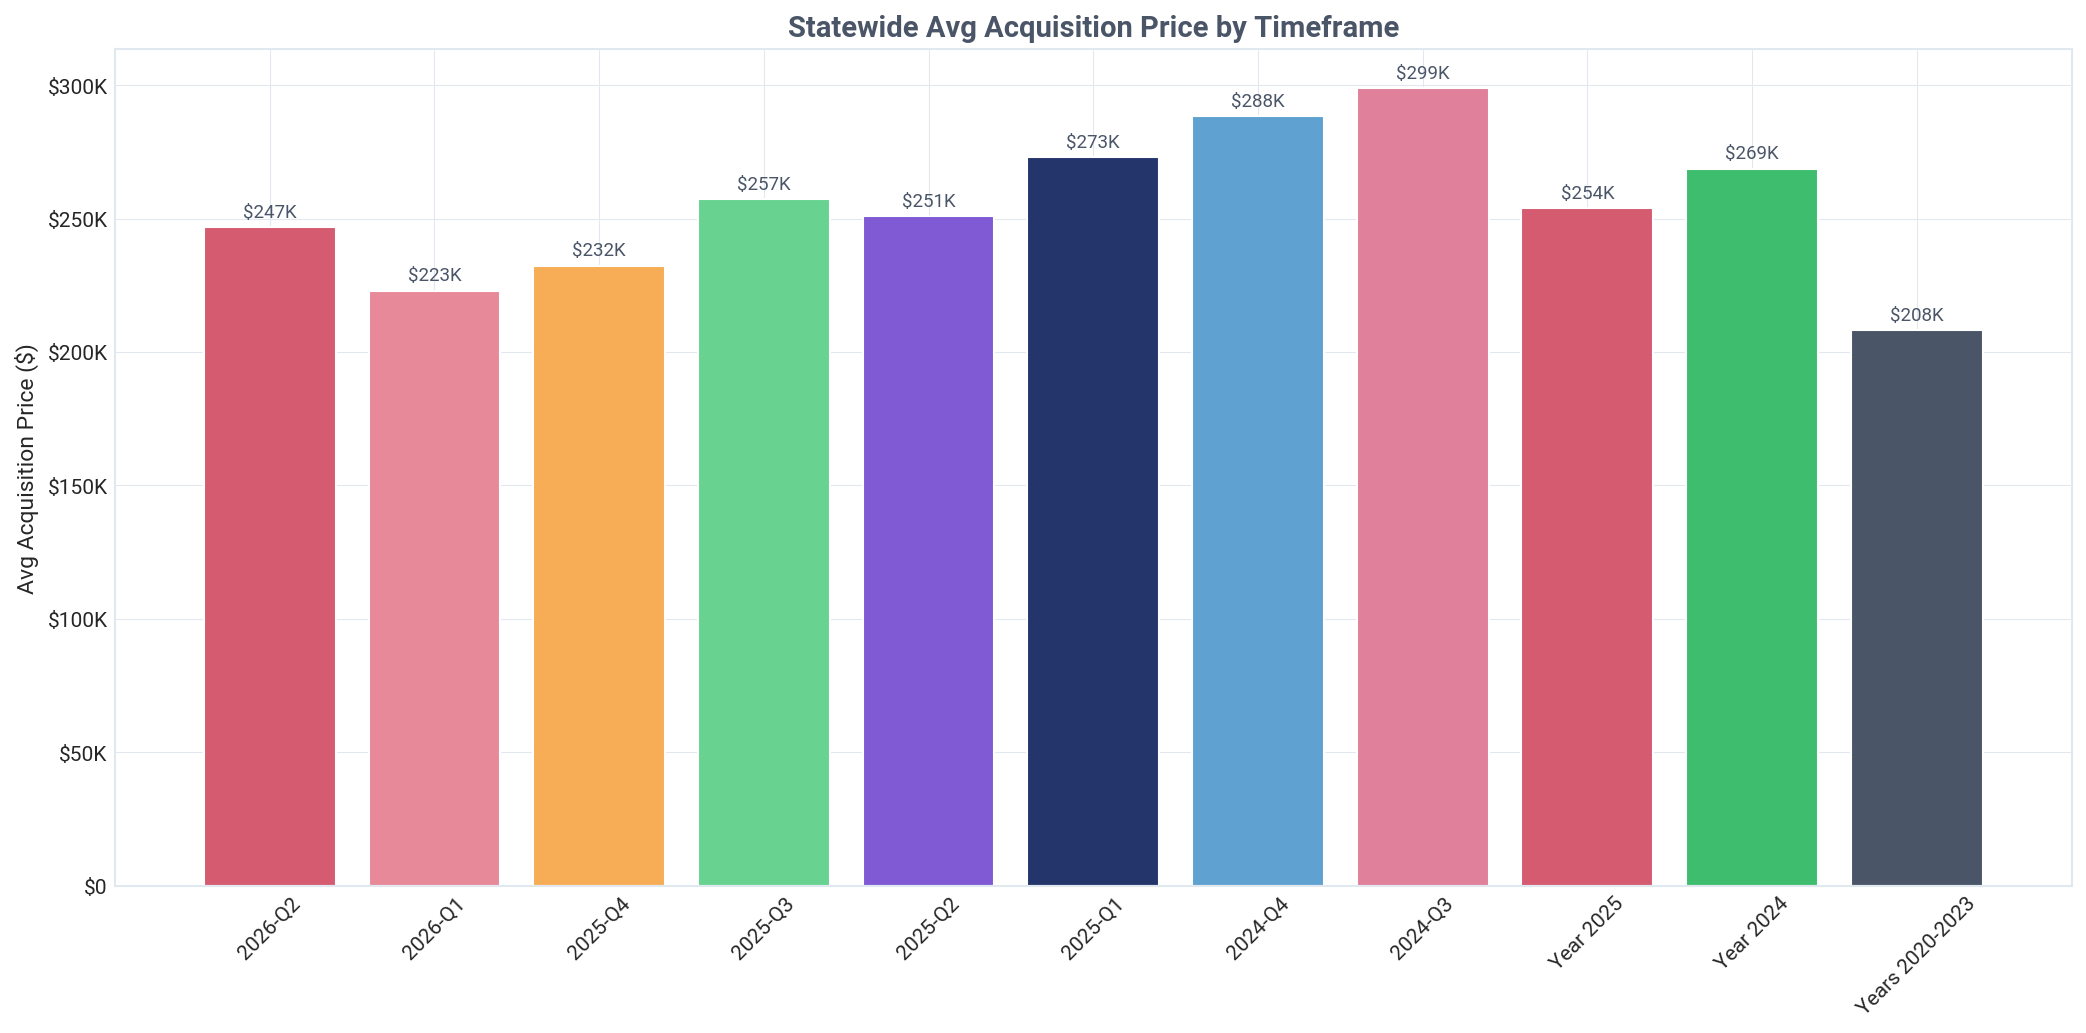
This significant price gap has remained consistent, with landlords securing similar discounts of 32.1% in Q1 2026 and 30.3% in Q4 2025. Landlord acquisition prices have appreciated since the 2020-2023 boom, rising from an average of $208,121 to $246,696 in Q2 2026.
Current Quarter Purchases
Landlords purchased 3,736 homes in Q2 2026, capturing 14.9% of all SFR sales in Indiana.
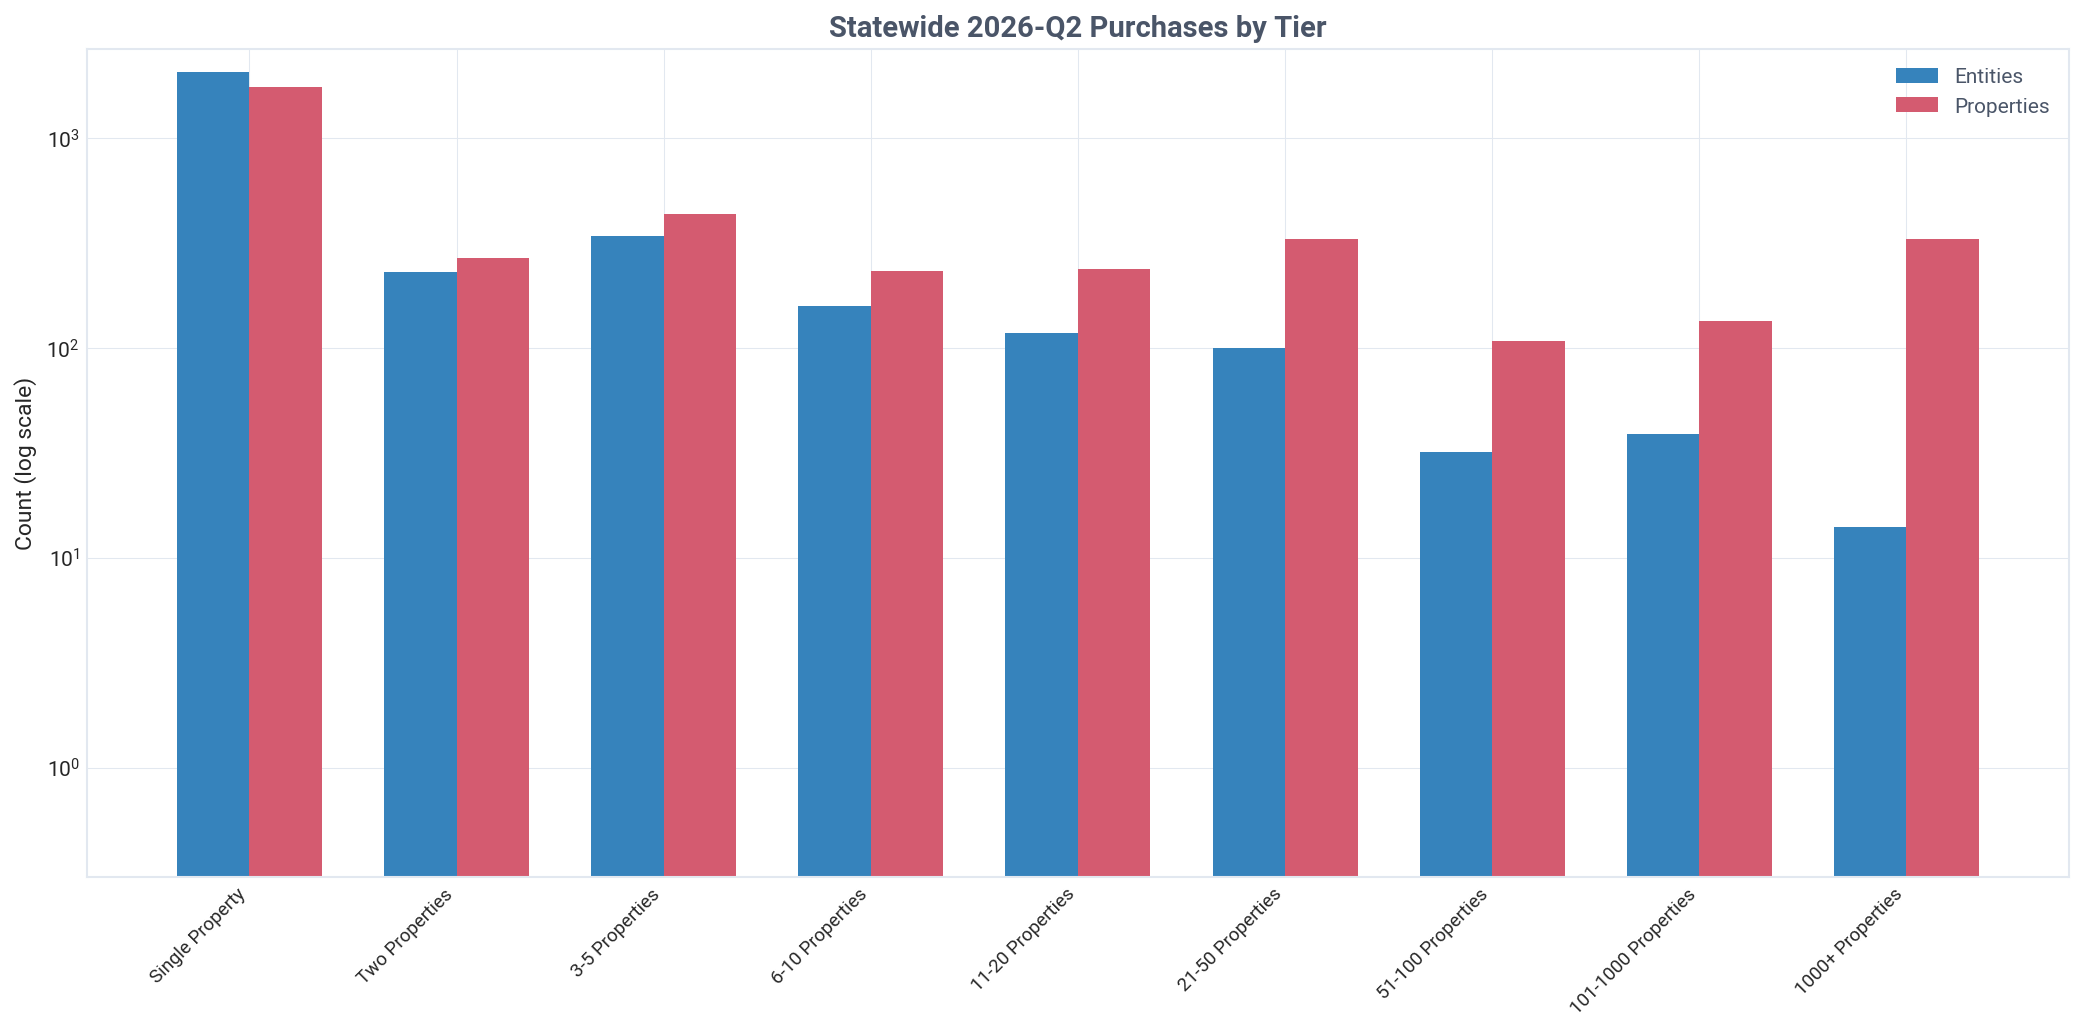
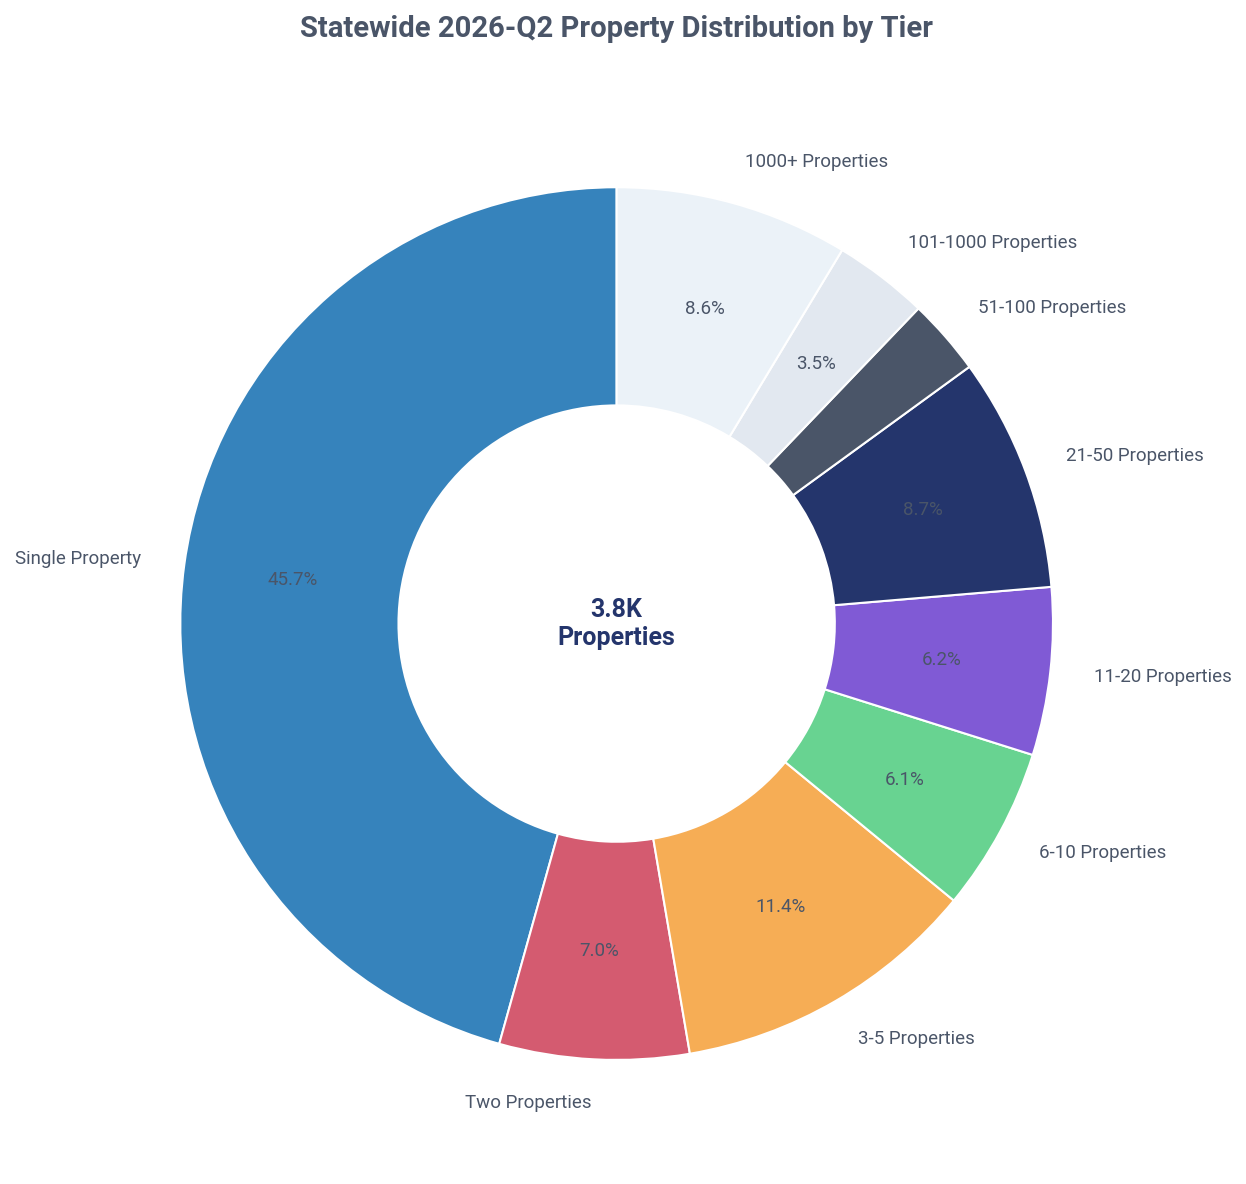
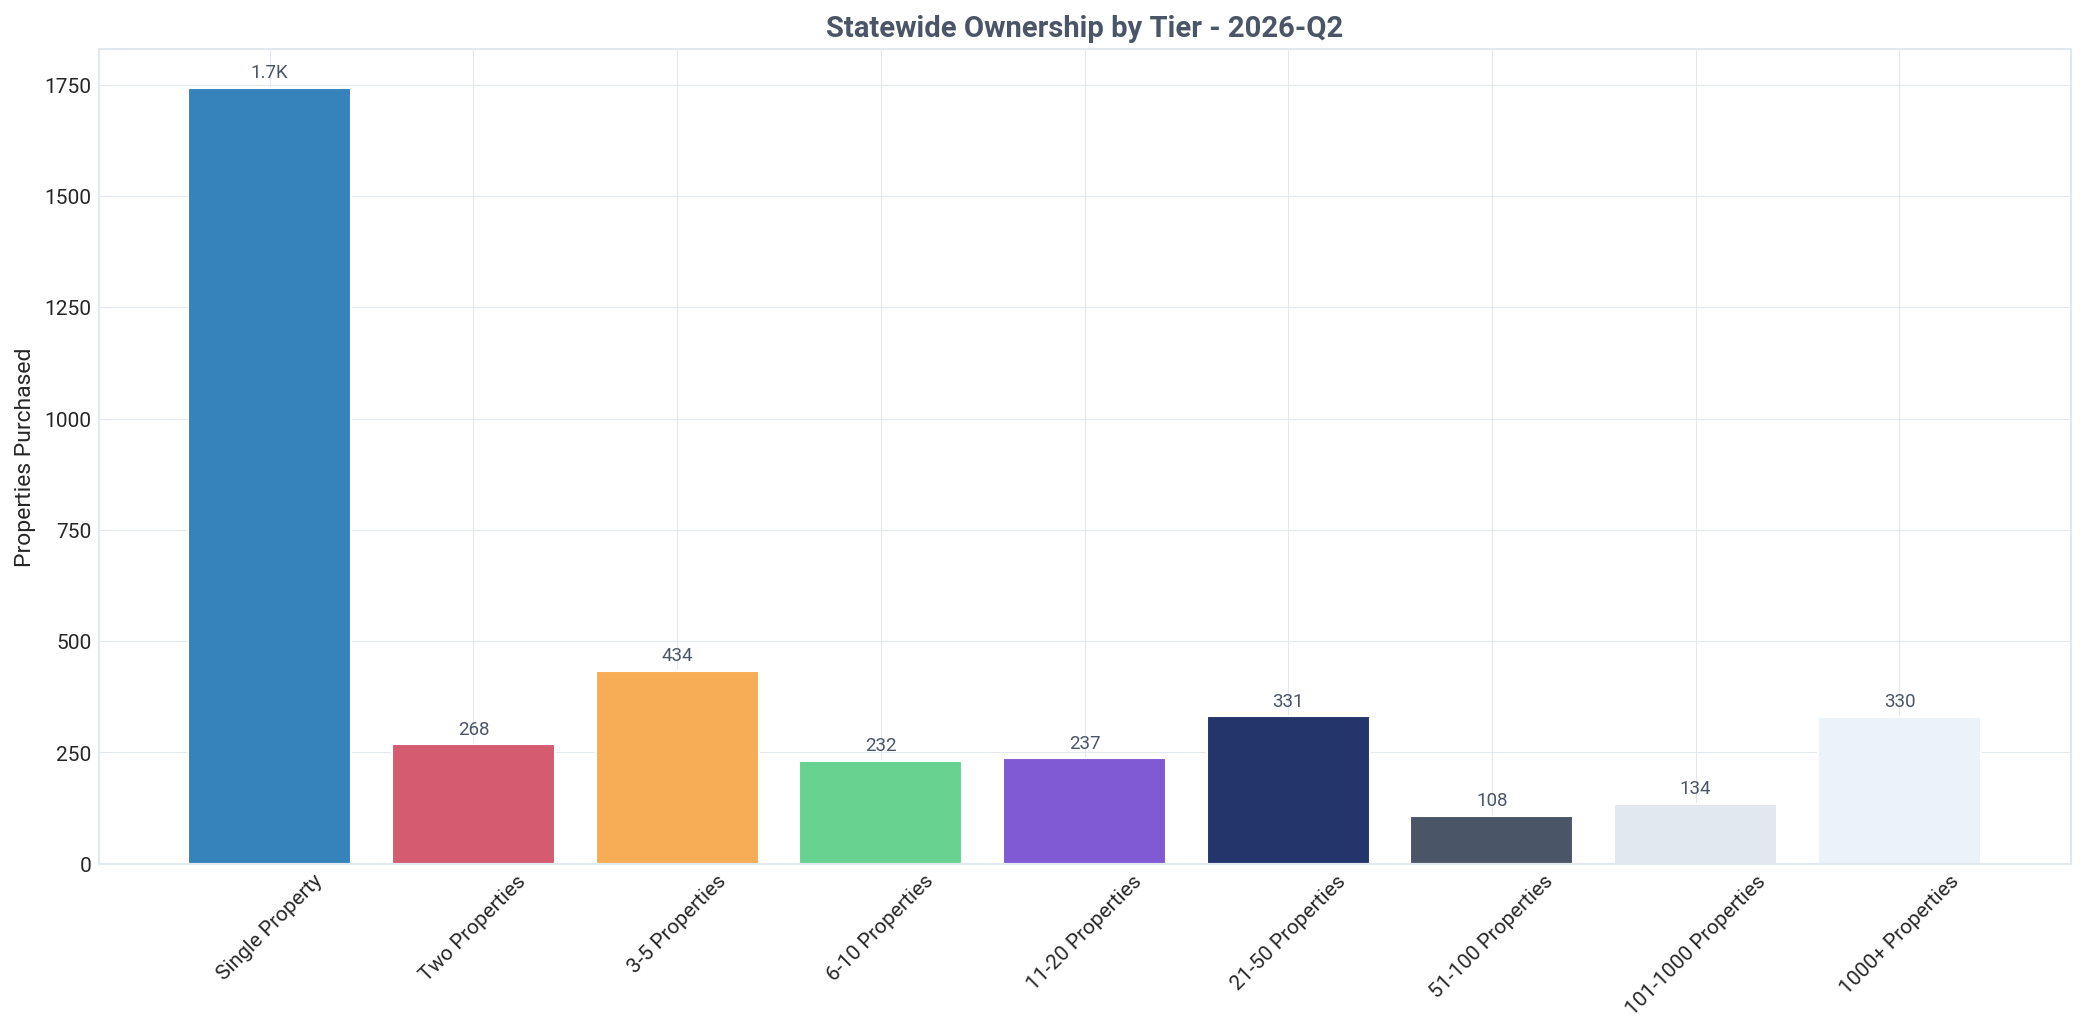
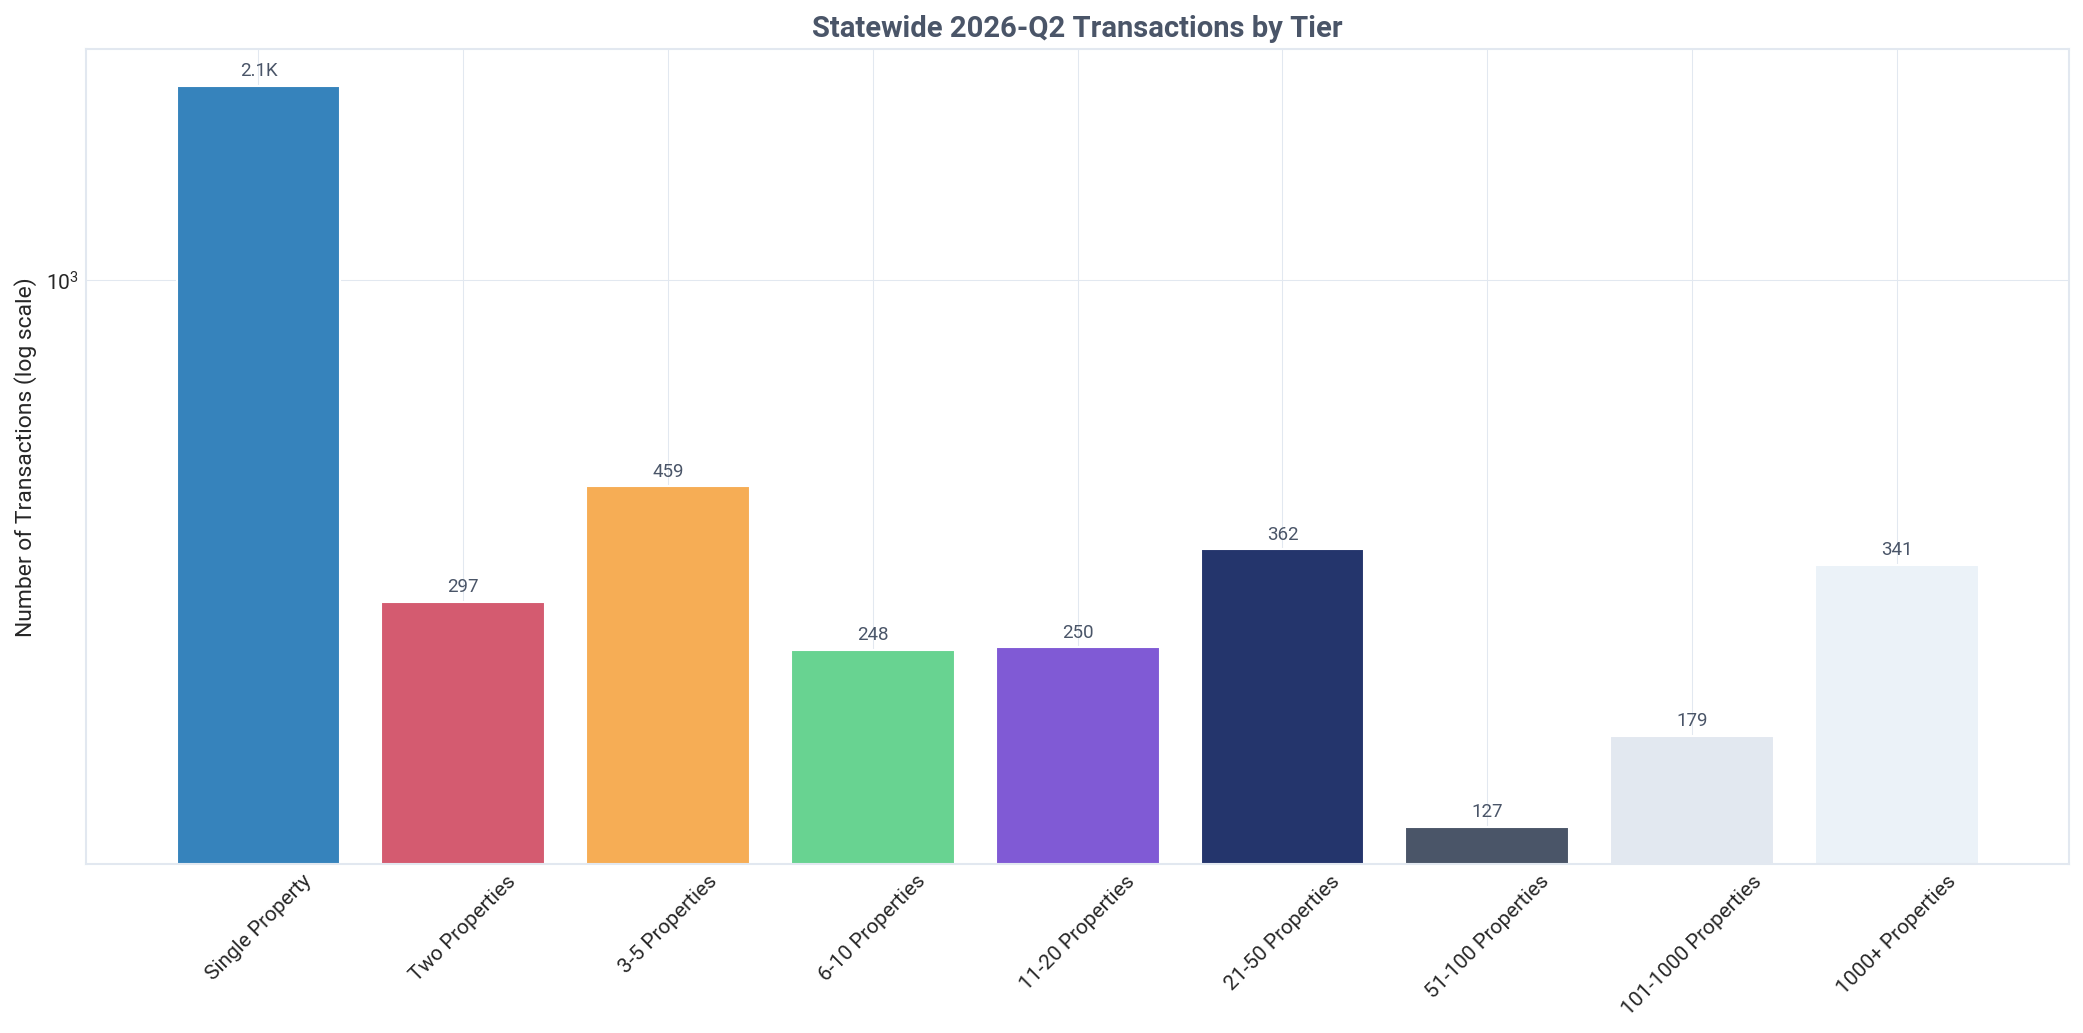
Mom-and-pop investors (1-10 properties) dominated this activity, accounting for 70.1% of all landlord purchases. In contrast, institutional investors (1000+ properties) made up just 8.6% of landlord acquisitions. The quarter saw 2,070 new single-property landlords enter the market.
Ownership by Tier
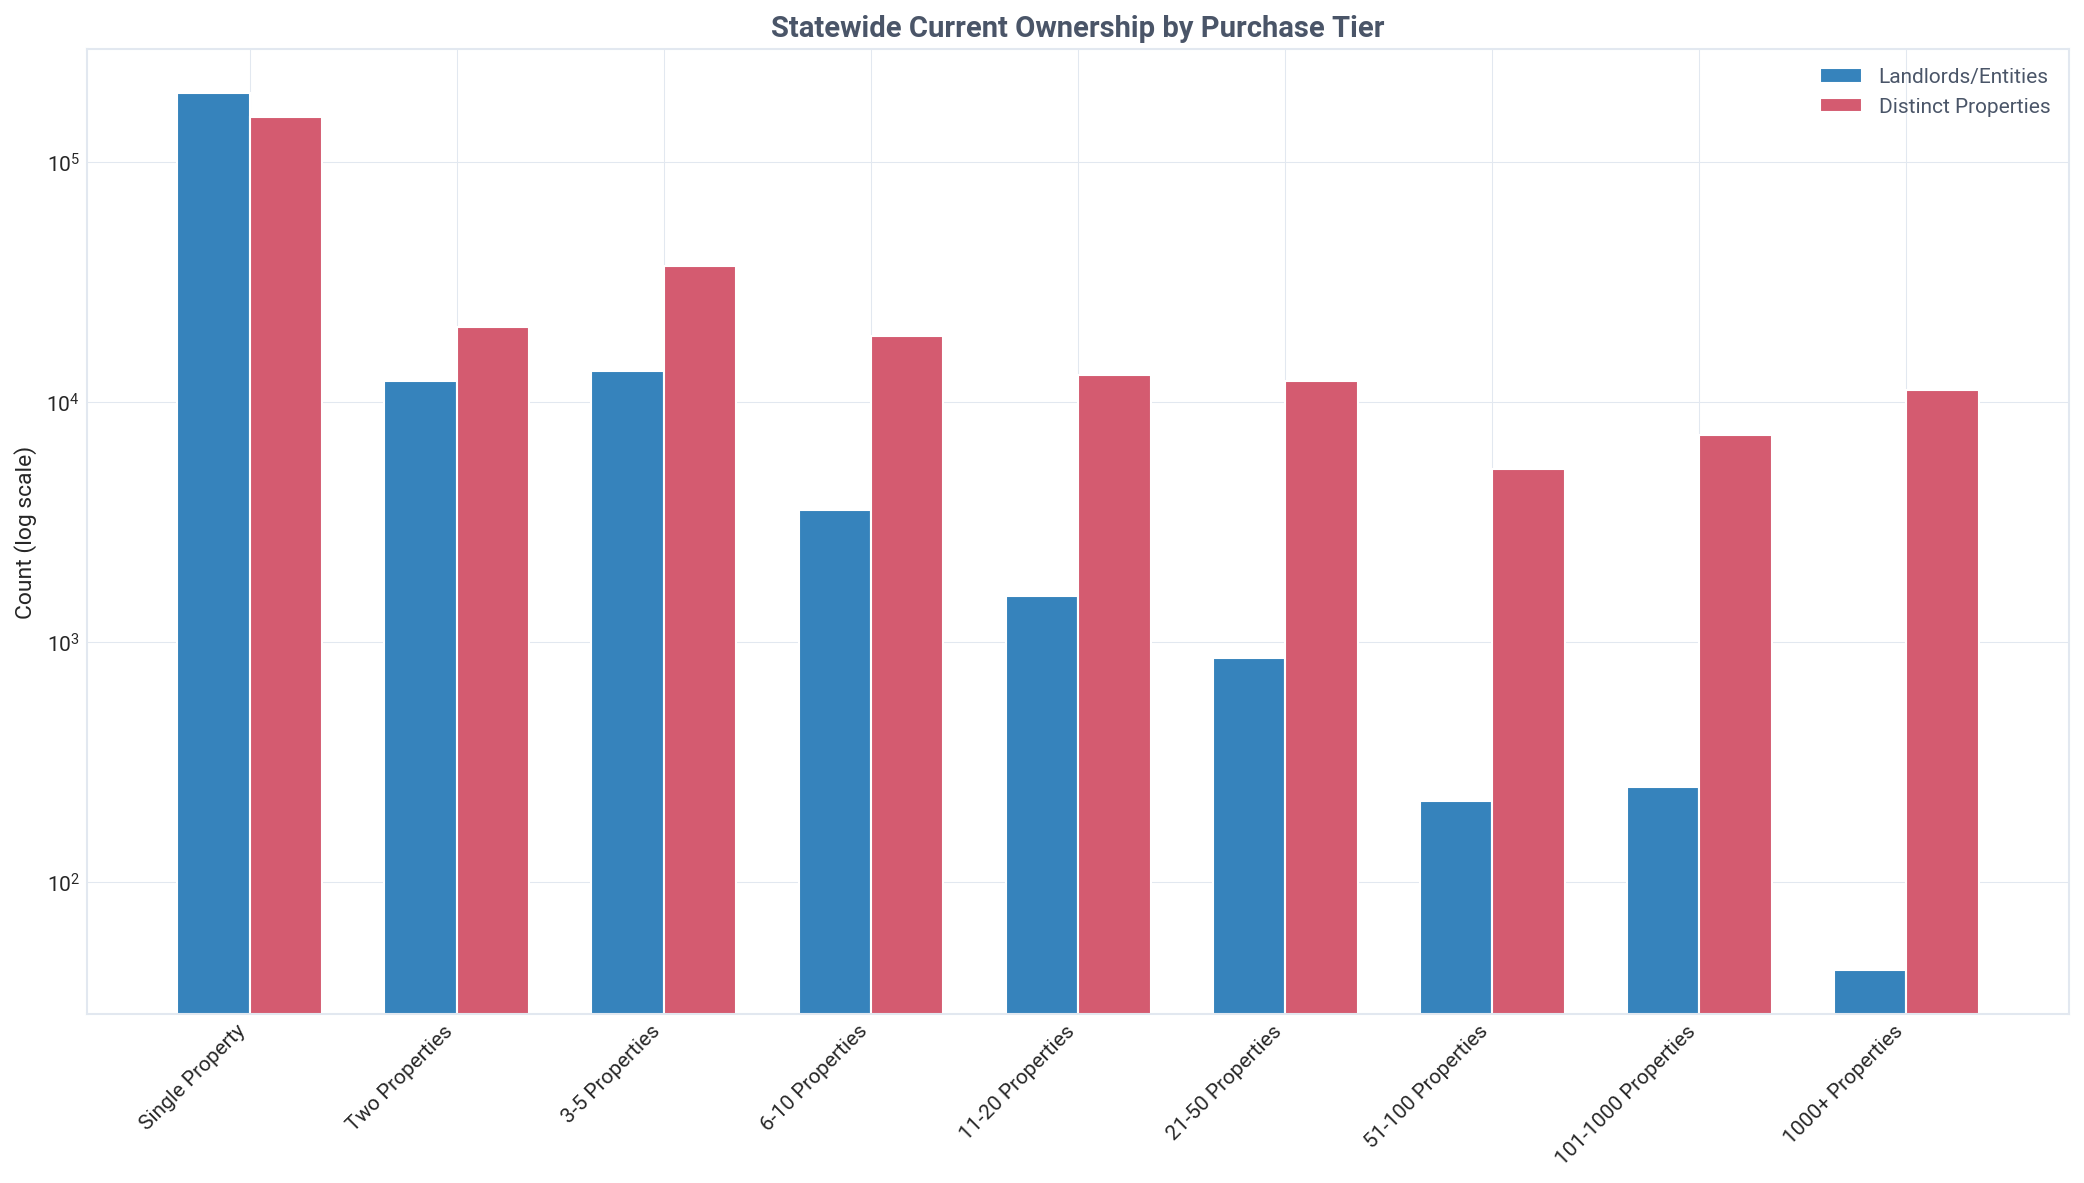
Mom-and-pop landlords (1-10 properties) control a dominant 82.5% of investor-owned SFRs in Indiana.
This share dwarfs the 4.0% controlled by institutional investors with over 1,000 properties each. Landlords owning just a single property represent the largest segment, holding 153,930 properties, or 55.2% of the entire investor-owned market.
Ownership by Tier & Type
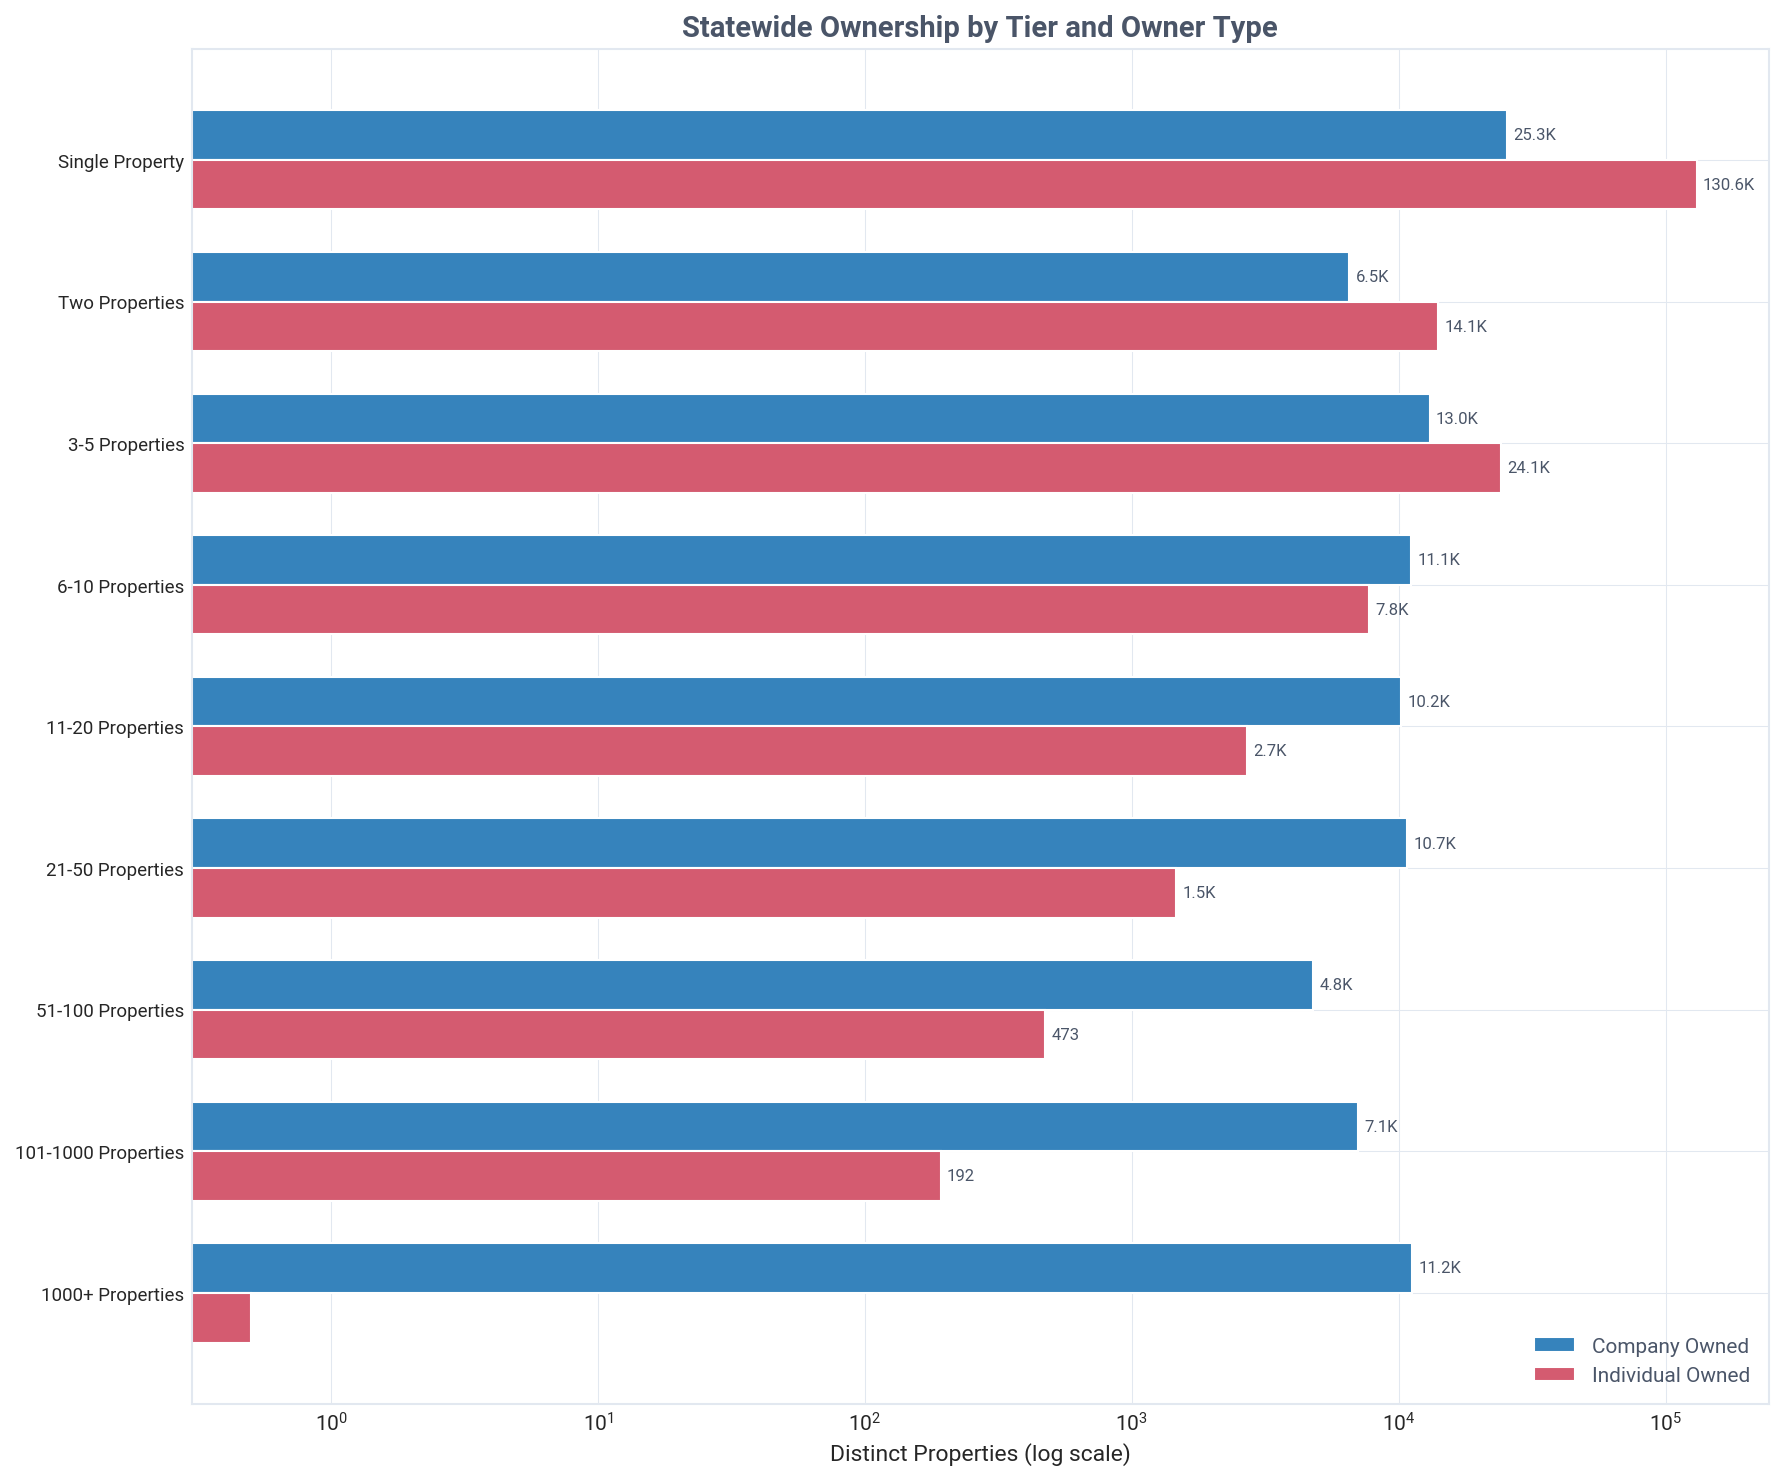
Companies become the majority property owners starting in the 6-10 property tier, holding 58.9% of homes.
Individual investors overwhelmingly dominate smaller portfolios, owning 83.8% of single-property holdings and 68.3% of two-property portfolios. In contrast, companies control 97.4% of properties in the large 101-1,000 property tier.
Geographic Distribution
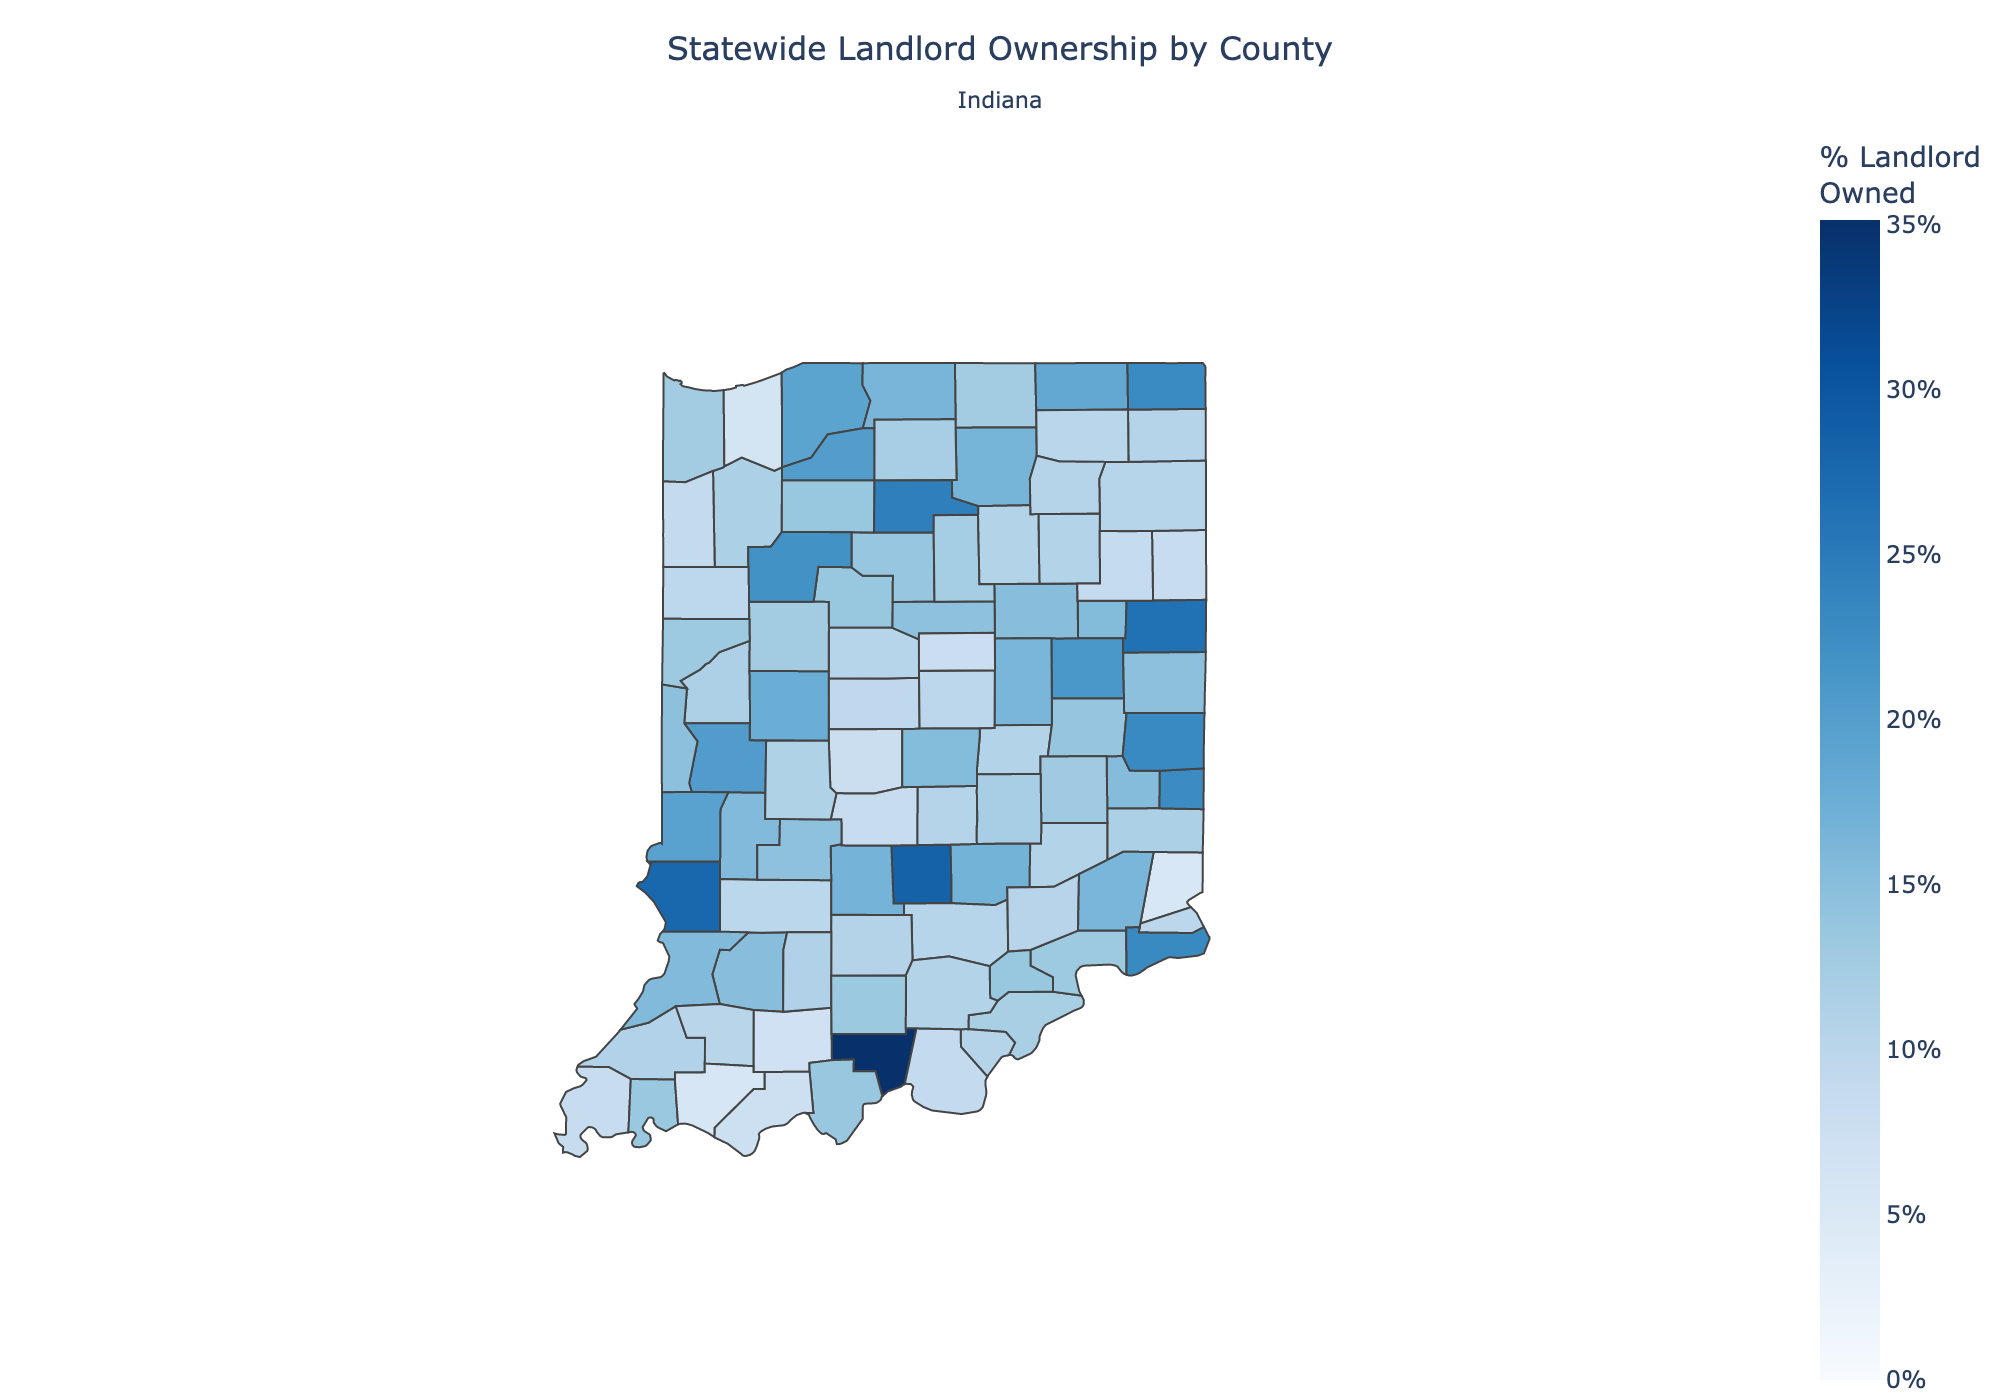
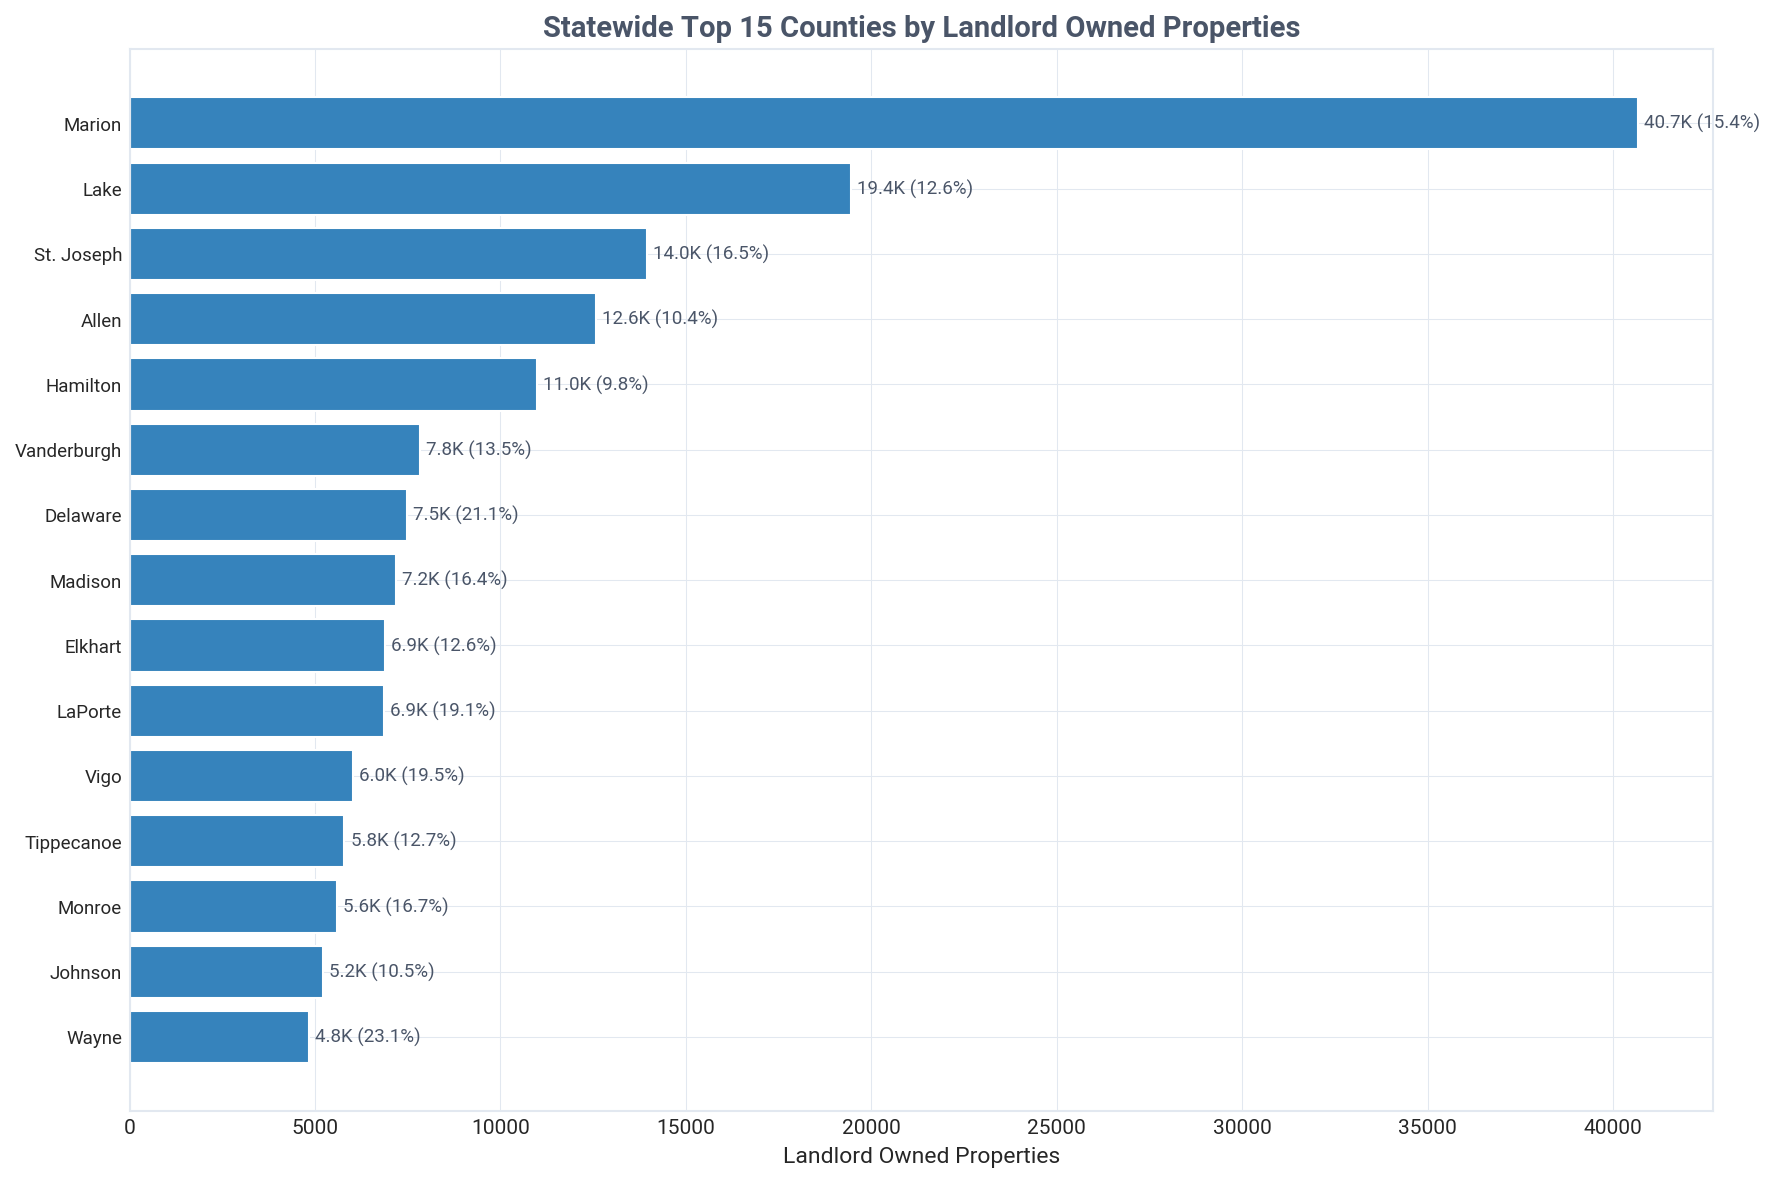
Marion County leads Indiana with 40,666 investor-owned properties, the highest count in the state.
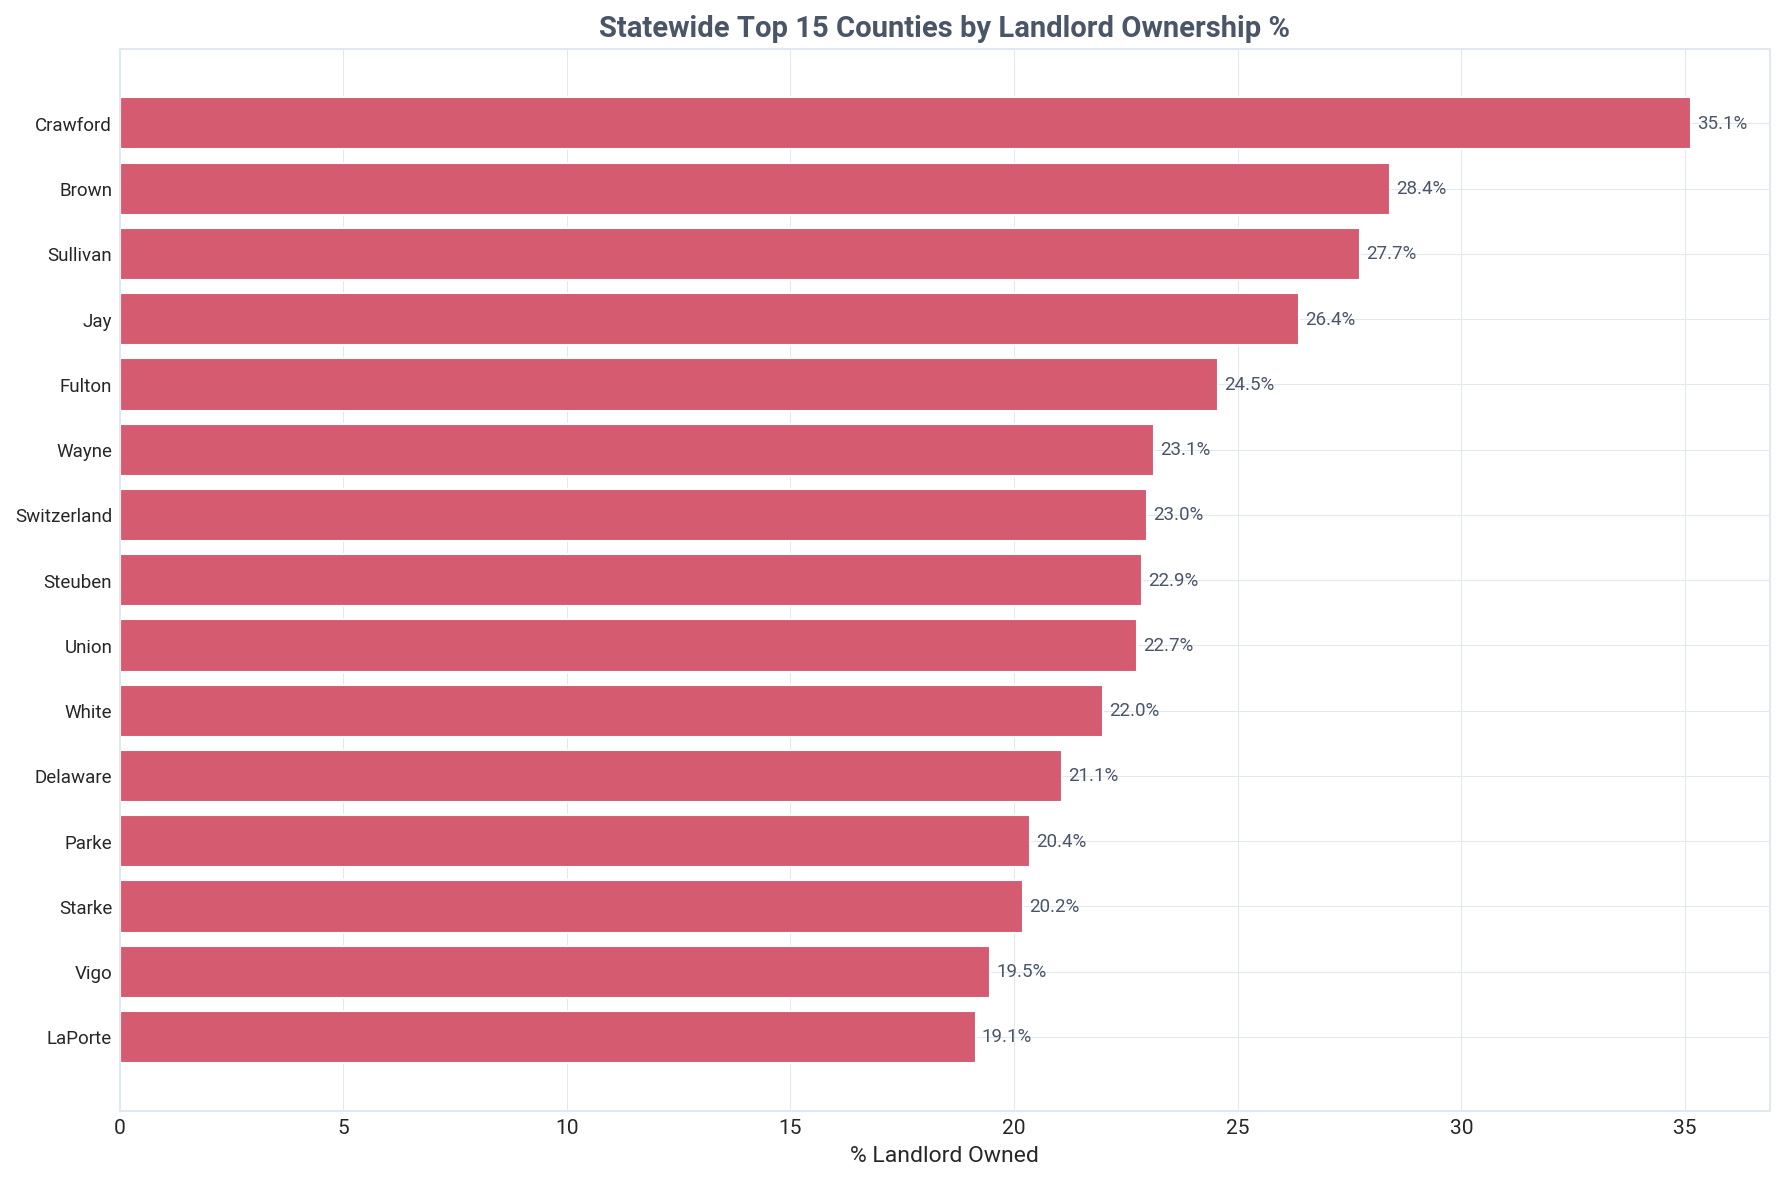
While Marion County has the highest volume, smaller counties like Crawford (35.1%) and Brown (28.4%) have the highest investor ownership rates. The top five counties by count represent 35.7% of all investor properties in Indiana, showing significant geographic concentration.
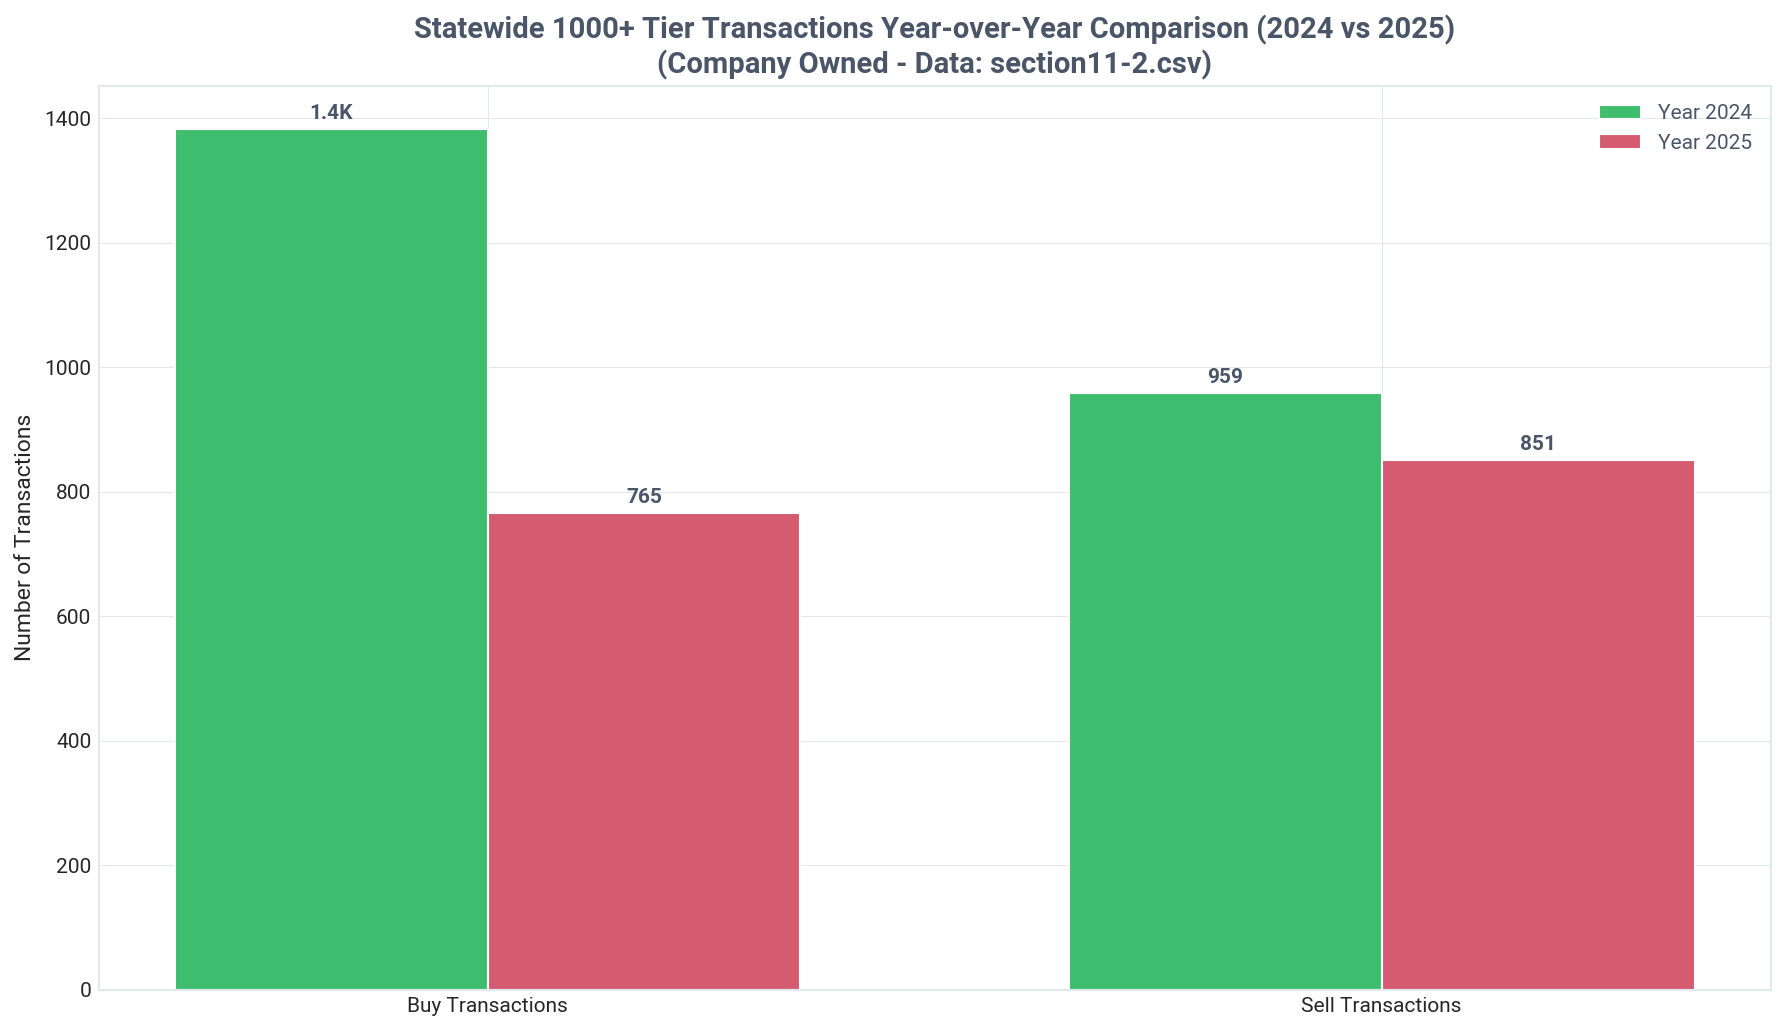
Historical Transactions
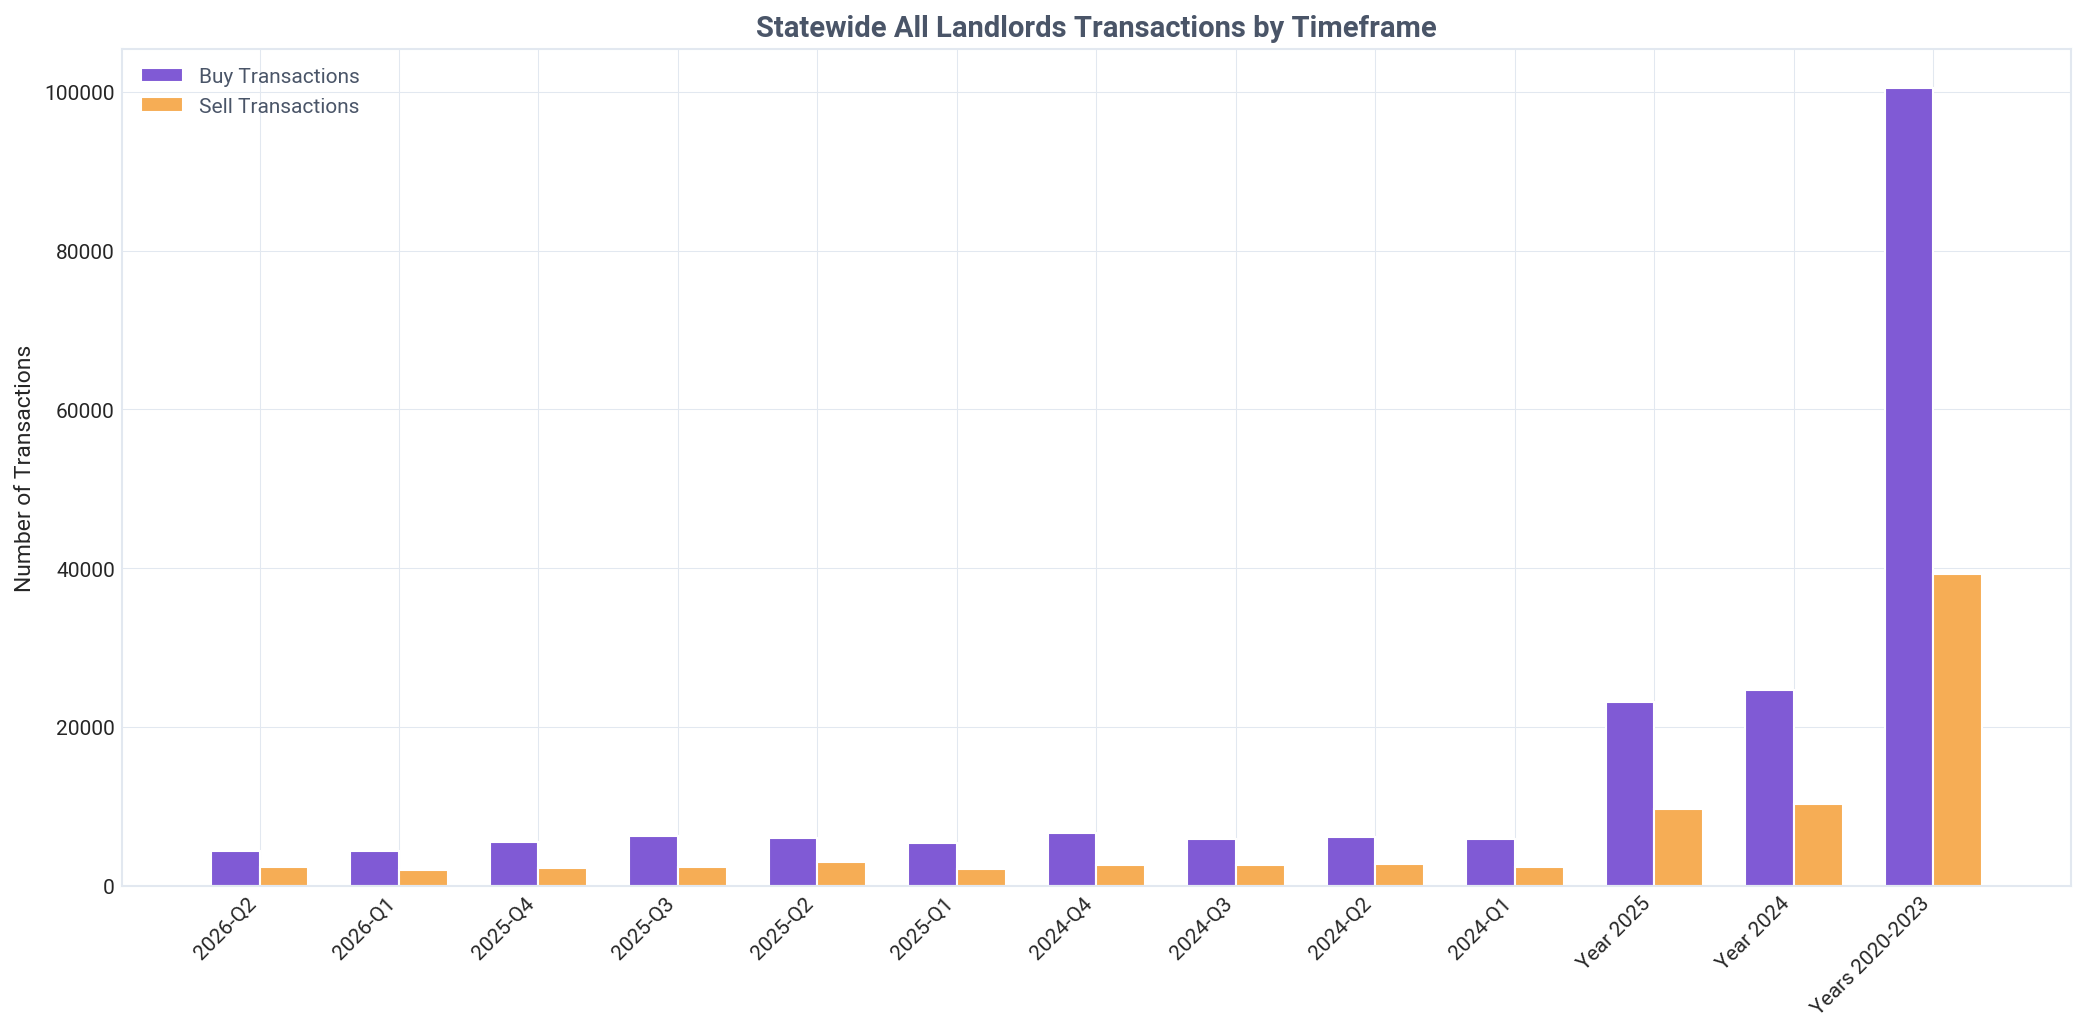
Indiana landlords are strong net buyers, acquiring 1.88 properties for every 1 they sold in Q2 2026.
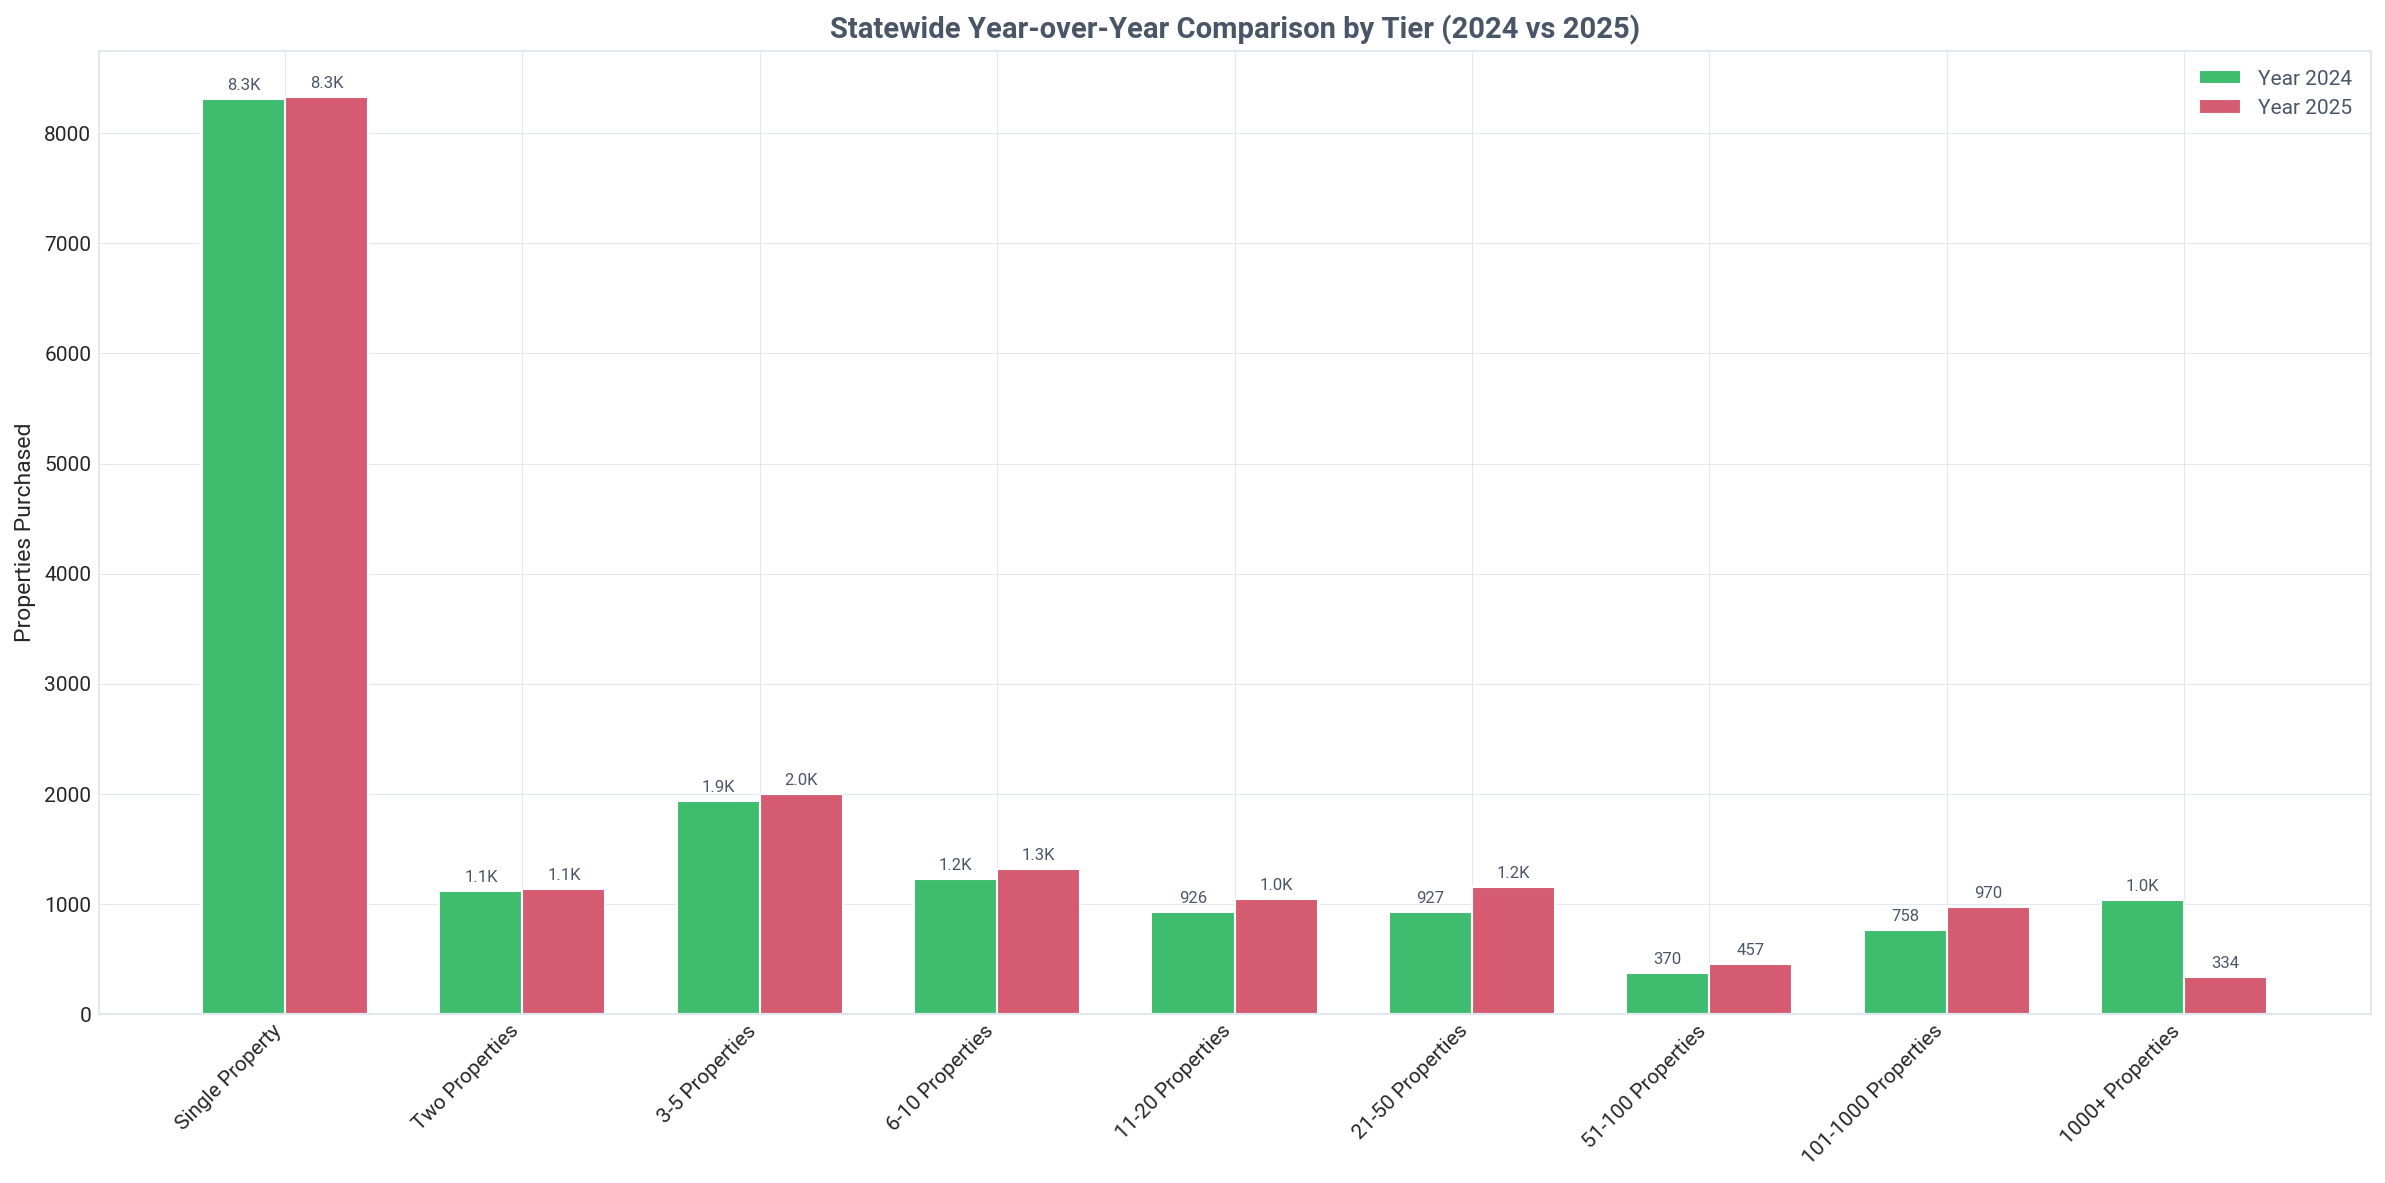
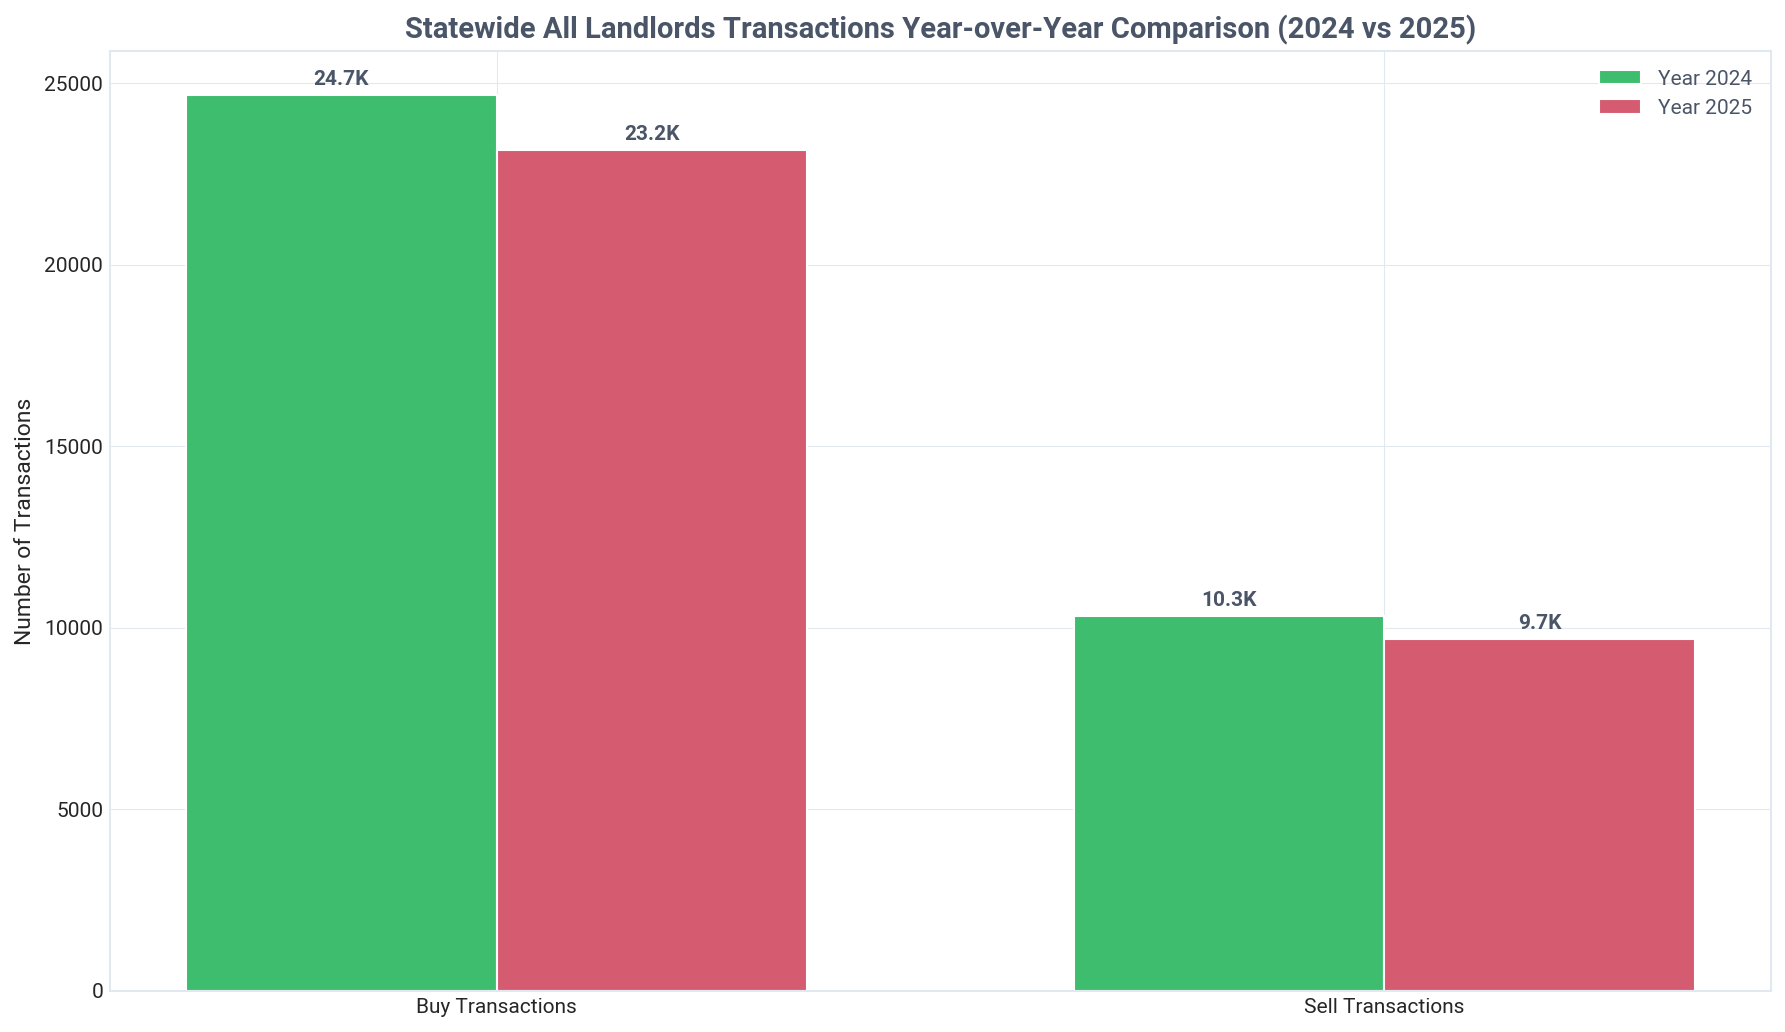
This trend is a reversal for institutional investors (1000+), who were net sellers in Q2 2026, selling 382 properties while buying only 341. Overall landlord buying activity has remained strong, with 23,168 purchases in 2025 and 24,662 in 2024.
Current Quarter Transactions
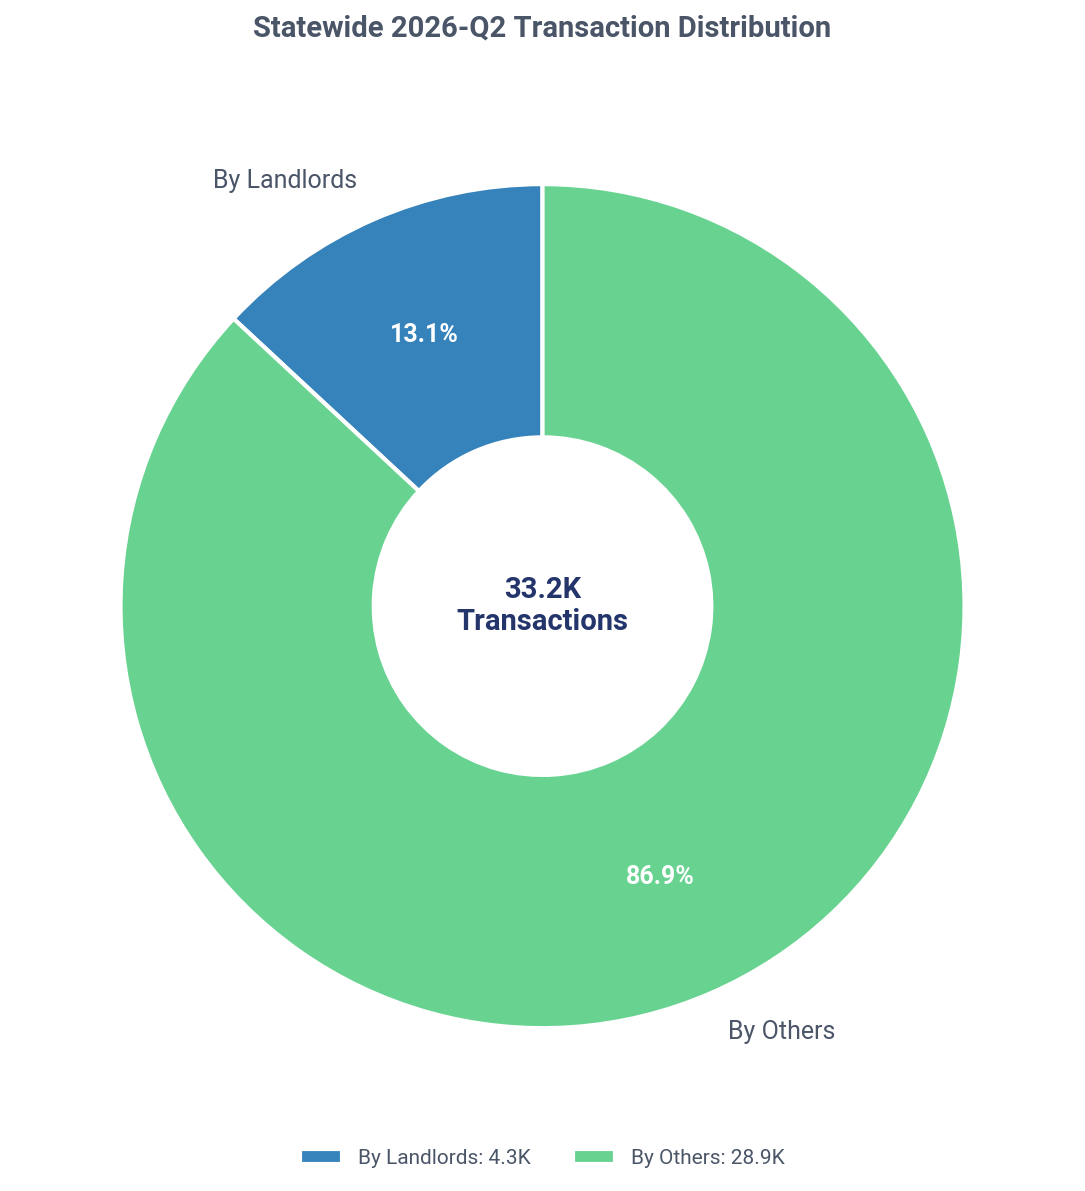
Landlords were involved in 13.1% of all SFR transactions in Q2 2026, making 4,345 purchases.
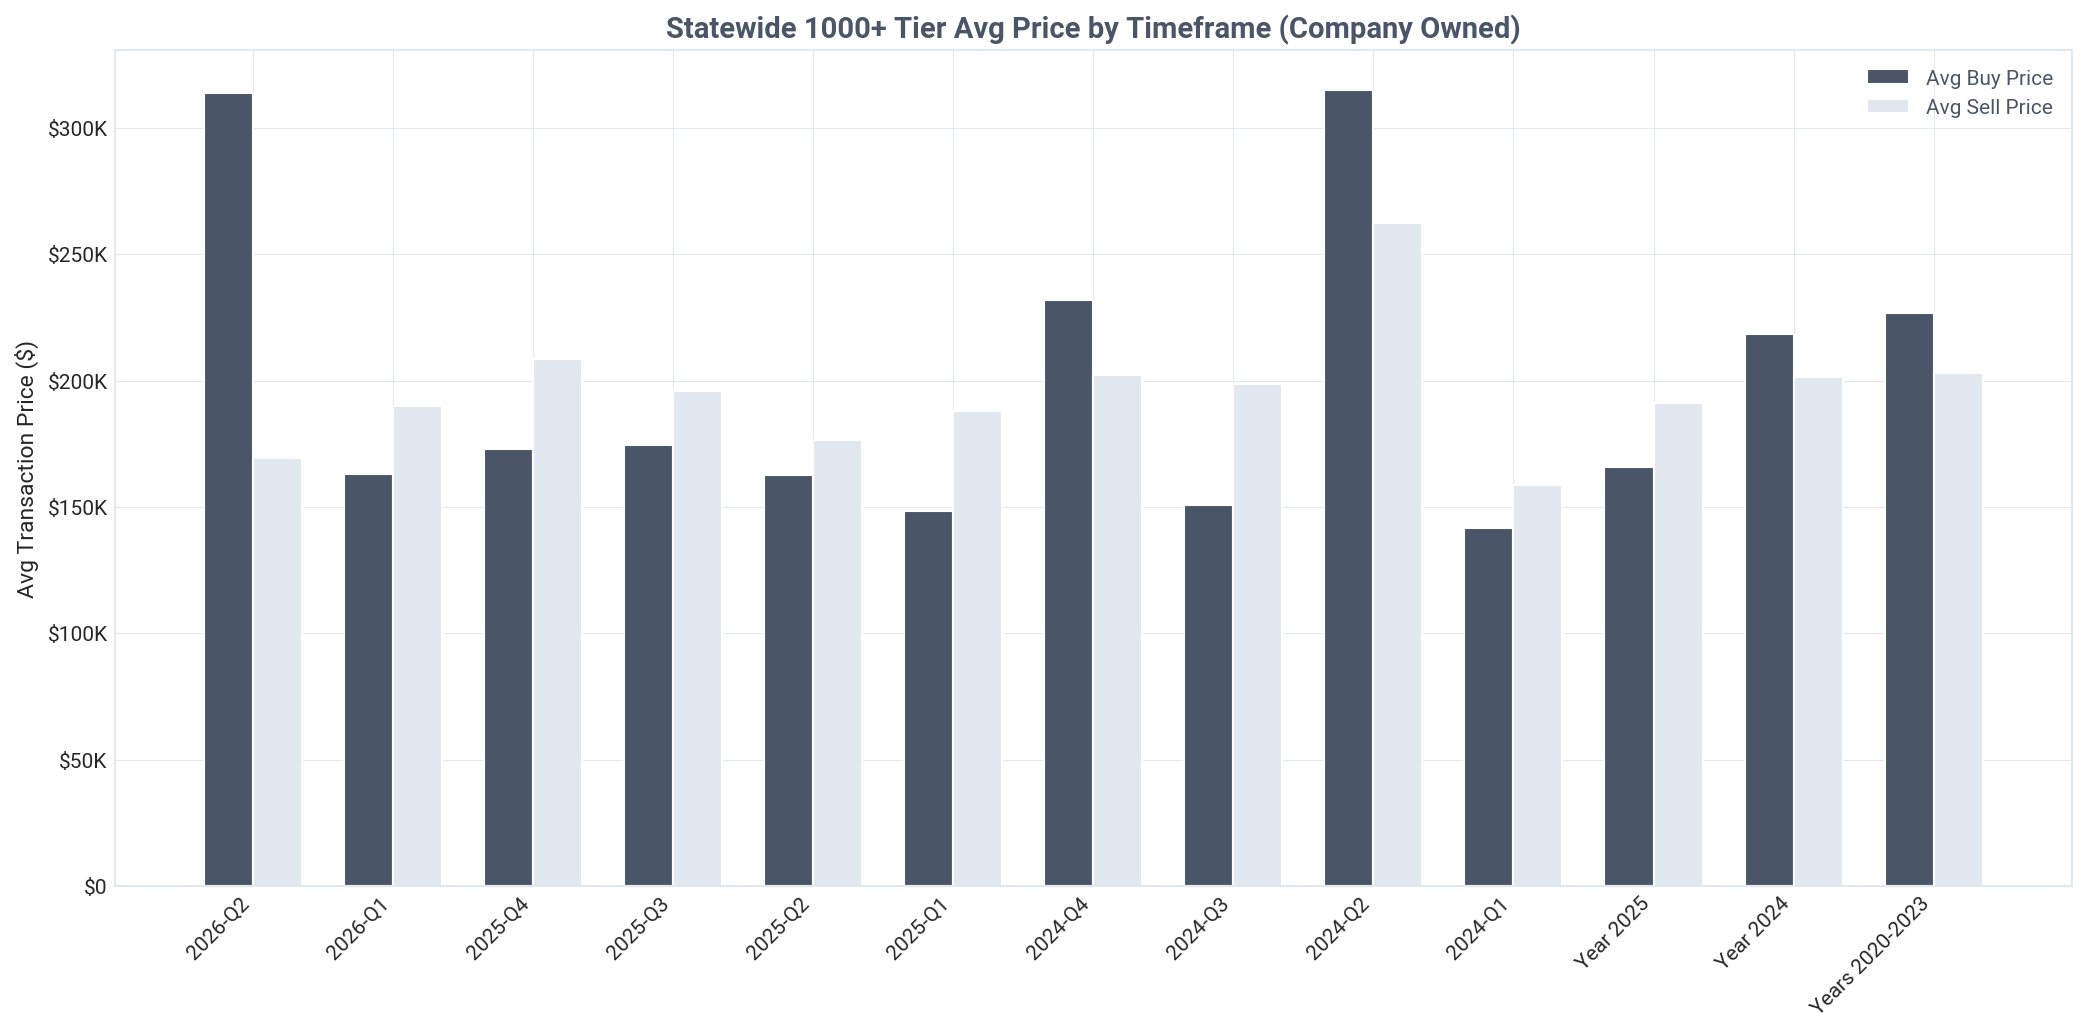
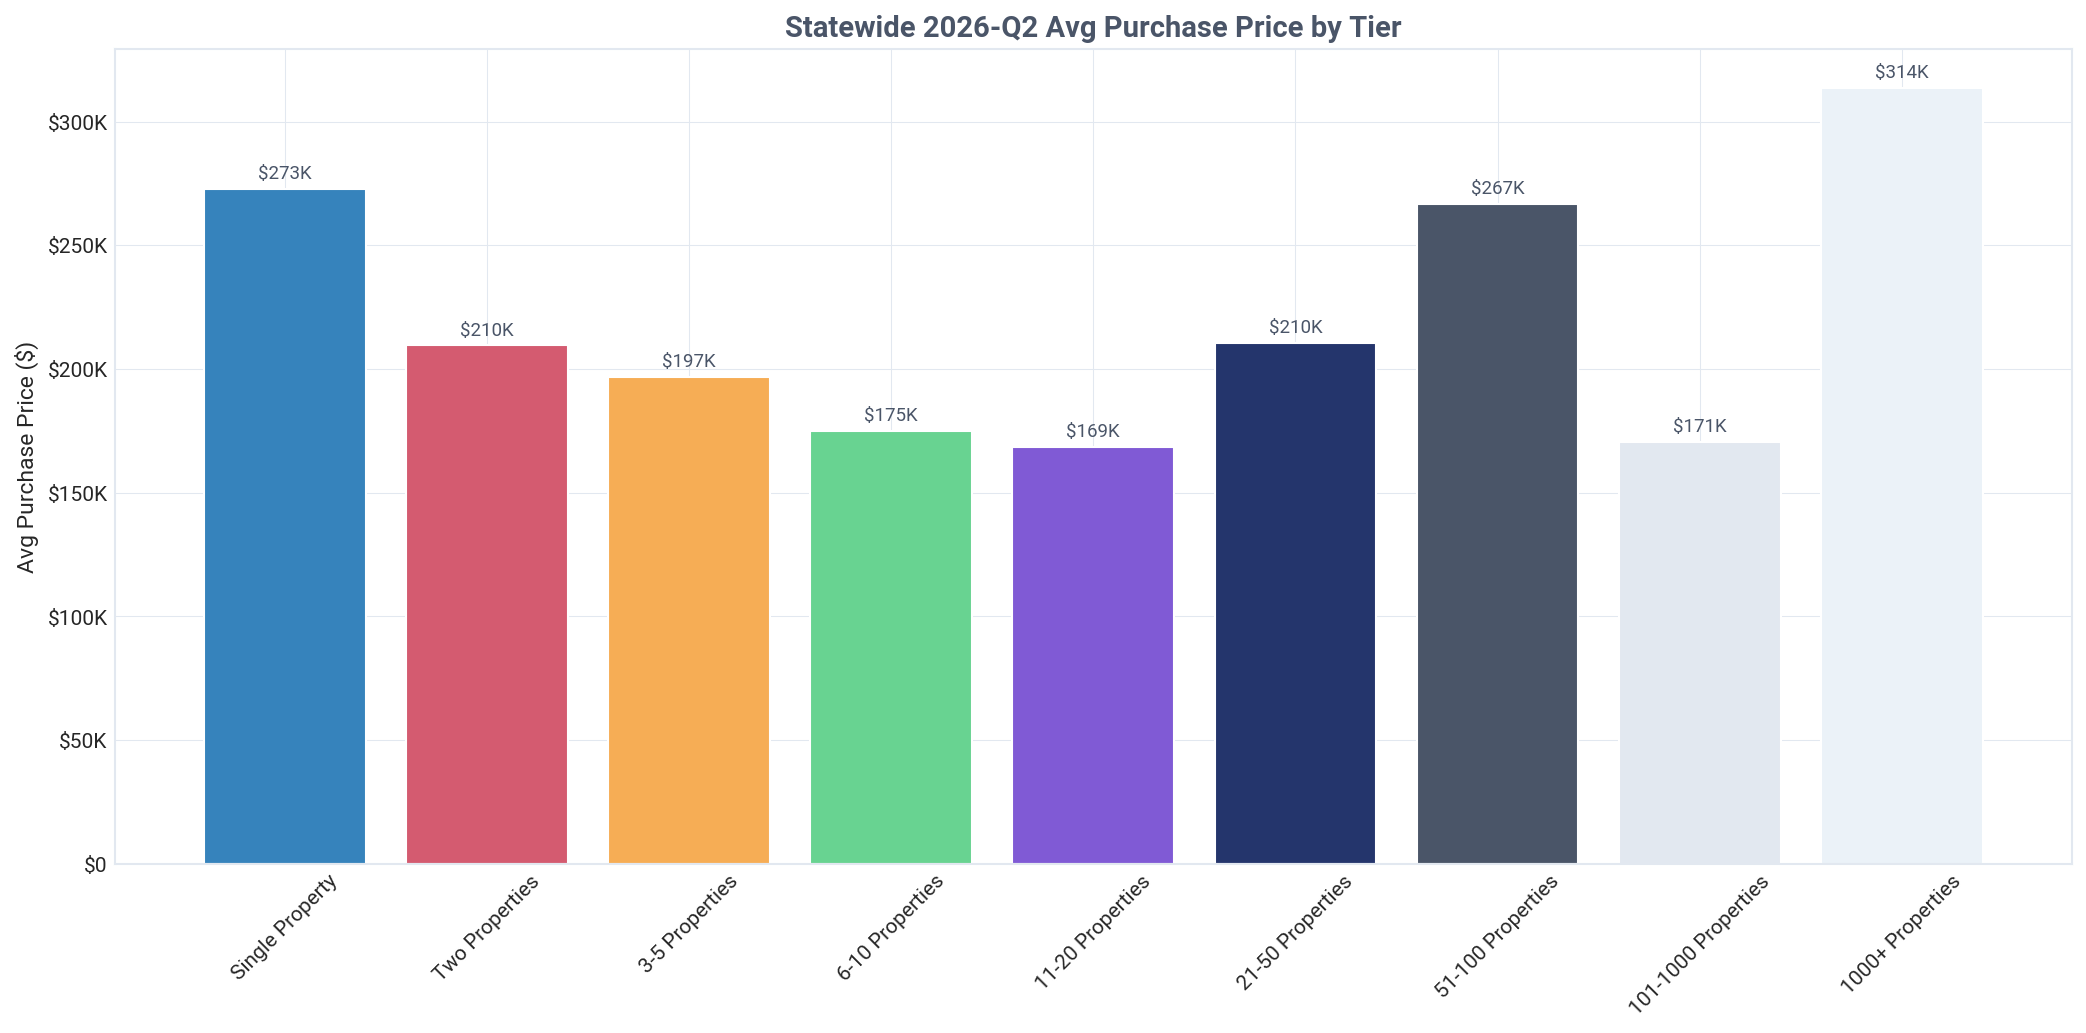
Institutional investors paid a 15.0% premium, with an average purchase price of $313,729, compared to $272,776 for new single-property landlords. Institutions were also heavily reliant on acquiring inventory from other landlords, with 72.4% of their purchases coming from existing investors.

Want deeper insights tailored to your investment strategy?

TALK TO AN EXPERT

Current Holdings Portfolio

Analysis of landlord property holdings by type, financing method, and owner category

Indiana: landlord SFR holdings by type, Q2 2026
Key Insight
Investors own 270,969 SFR properties in Indiana, with individuals holding 64.7% of the portfolio.
Detailed Findings

In Indiana, real estate investors hold a significant portfolio of 270,969 Single-Family Residential (SFR) properties, representing 13.3% of the total market of 2,036,560 SFRs. This demonstrates a substantial investor presence across the state's housing landscape.

The ownership structure is heavily skewed towards individuals, who own 175,203 properties or 64.7% of the investor-owned market. In contrast, companies own 99,250 properties, making up the remaining 36.6%, a finding that challenges the narrative of corporate dominance in the rental market.

When analyzing by entity, the disparity is even more pronounced. There are 187,479 individual landlords compared to just 38,720 company landlords, a ratio of nearly 5 to 1. This highlights that the typical real estate investing landscape in Indiana is defined by small-scale, individual operators.

Acquisition strategy analysis reveals a strong preference for cash purchases. A commanding 79.2% of the investor portfolio (214,723 properties) is owned outright without financing, compared to just 20.8% (56,246 properties) that carry a mortgage. This suggests a well-capitalized investor base or a strategy focused on leveraging existing equity.

The primary purpose of these holdings is clear, with 258,755 properties, or 95.5% of the total investor portfolio, actively rented. This high rental rate underscores the critical role investors play in supplying housing inventory to the rental market in Indiana.
Acquisition Timing & Pricing

Comparison of acquisition prices between landlords and traditional homeowners

Key Insight
In Q2 2026, landlords paid 30.0% less than homeowners, an average discount of $105,727 per property.
Detailed Findings

A stark pricing advantage for investors is evident in Indiana's Q2 2026 market. Landlords acquired properties for an average of $246,696, a remarkable 30.0% less than the $352,423 paid by traditional homeowners. This equates to a substantial average discount of $105,727 per property, indicating a systematic ability to find and secure undervalued assets.

This pricing gap is not a recent anomaly but a persistent trend. In Q1 2026, landlords achieved a 32.1% discount ($105,330), and in Q4 2025, they paid 30.3% less ($100,933) than homeowners. The consistency of this 30%+ discount suggests a durable strategic advantage for investors, likely stemming from off-market acquisitions or targeting properties requiring renovation.

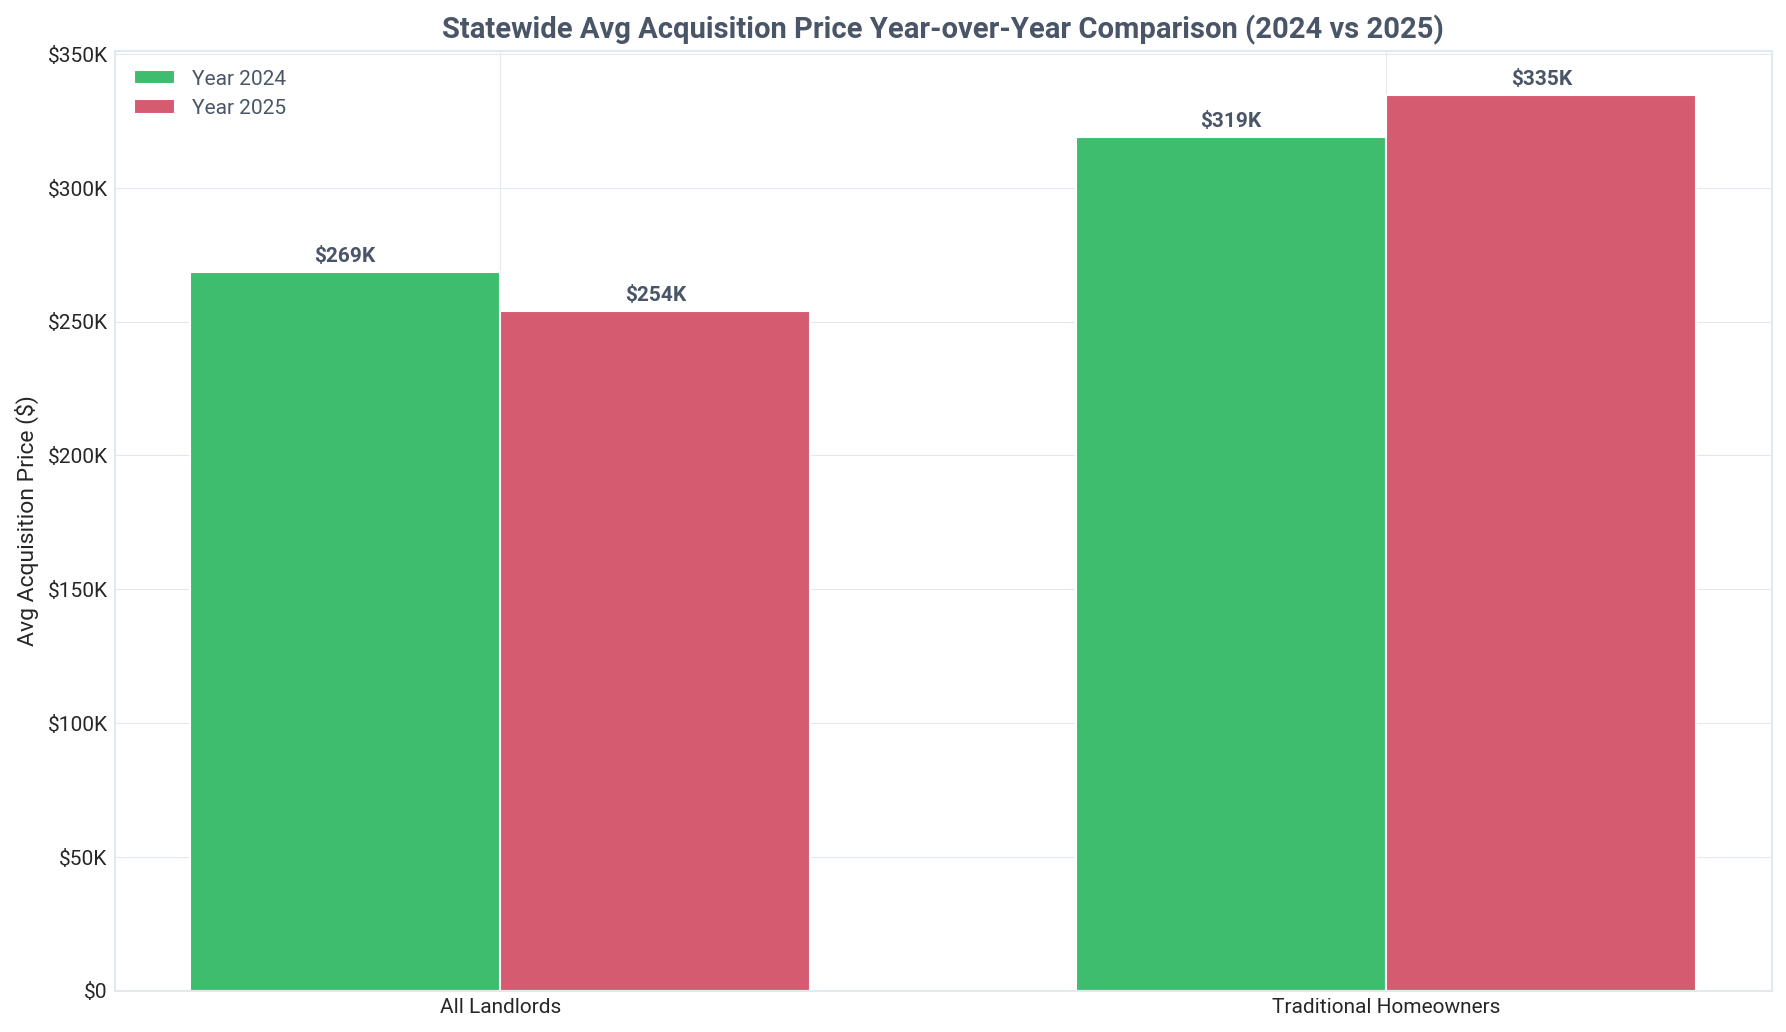
Acquisition prices have shown significant appreciation over time. The average landlord purchase price in Q2 2026 ($246,696) is 18.5% higher than the average during the 2020-2023 period ($208,121), reflecting broad market price growth. However, this is a slight dip from the highs seen in 2024 ($268,659).

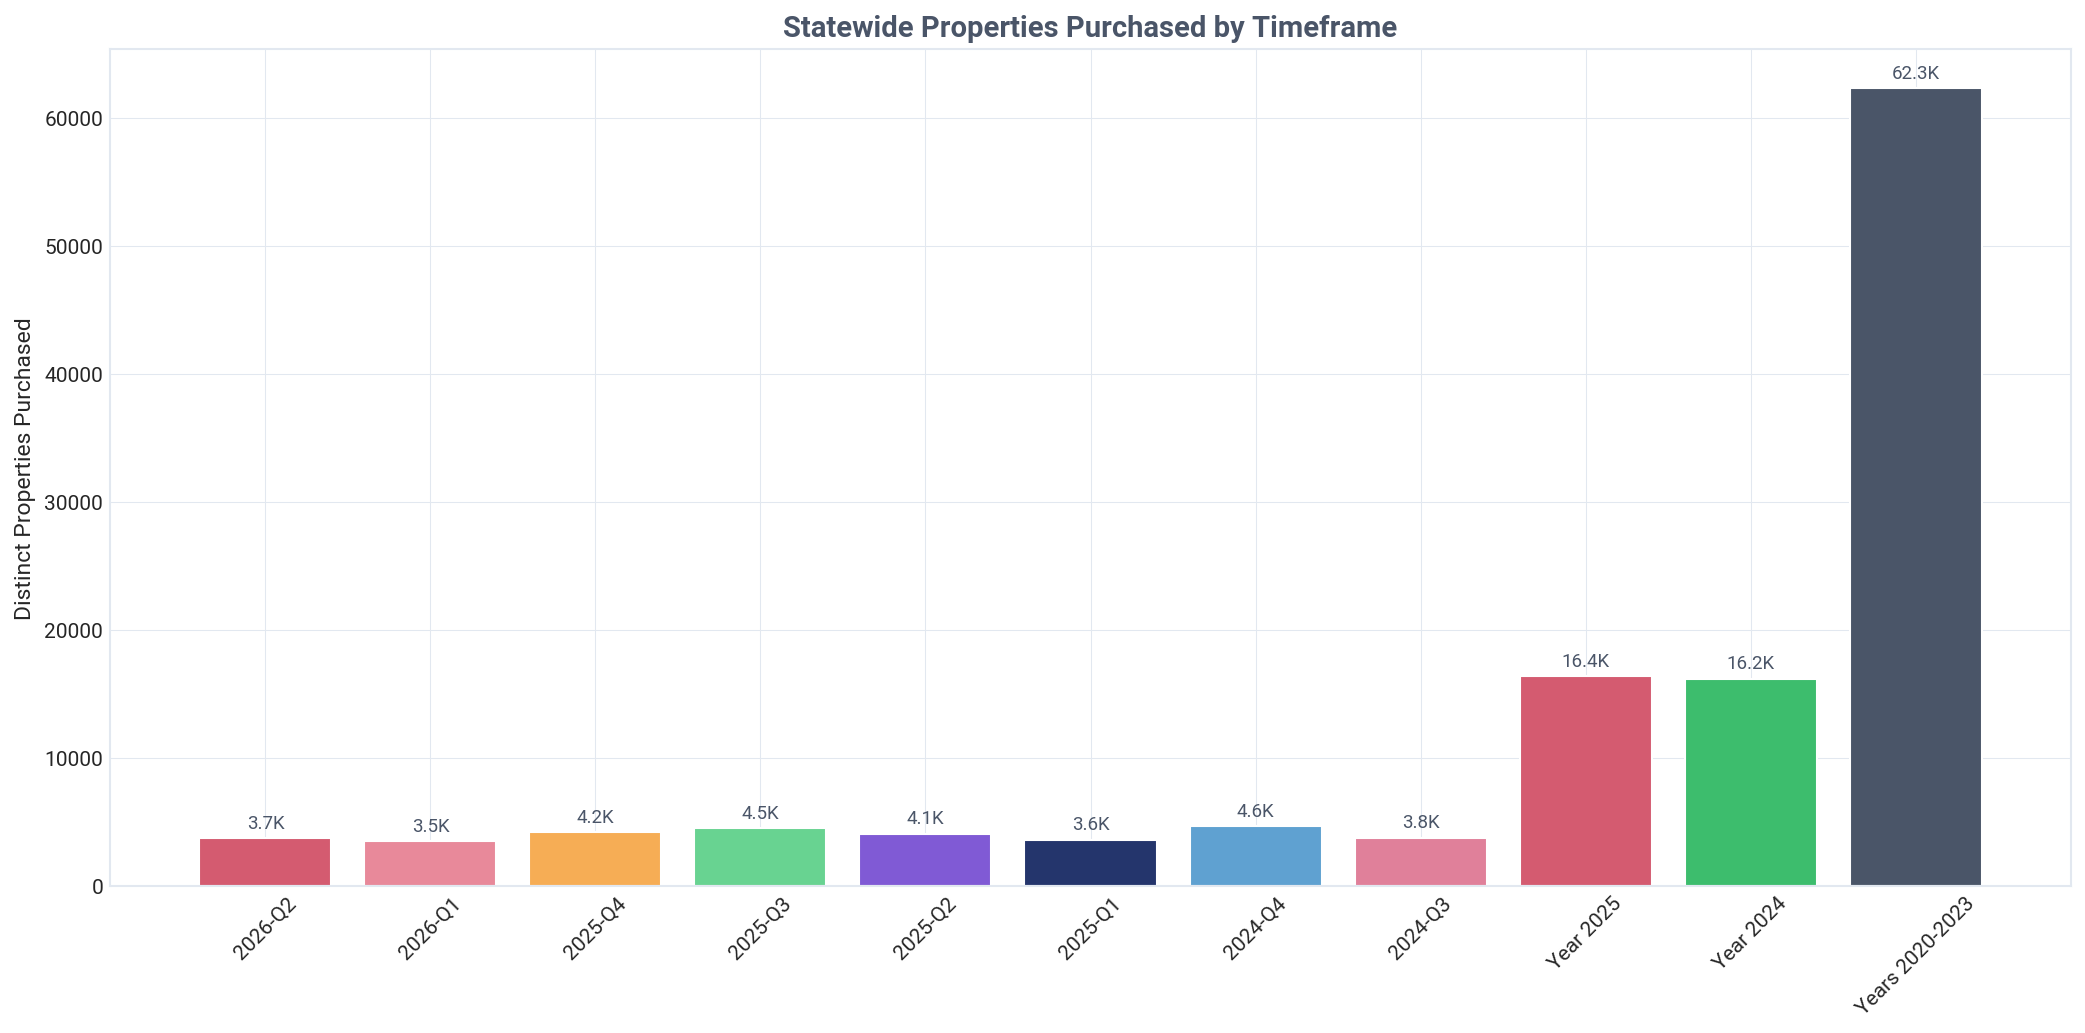
Investor purchasing activity has remained robust, though it has moderated from recent peaks. Landlords acquired 3,736 properties in Q2 2026, a volume comparable to Q1 2026 (3,502 properties) but lower than the quarterly averages in 2025 (over 4,000) and 2024 (over 4,000). This suggests a more selective acquisition environment in the current quarter.

The all-time average acquisition price for the entire investor portfolio stands at $184,193. Comparing this to the Q2 2026 average of $246,696 reveals significant embedded equity across historical holdings, a key factor for investors leveraging mortgage transaction data for refinancing or new purchases.

Indiana: properties purchased by timeframe, Q2 2026
Indiana: average acquisition price by timeframe, Q2 2026
Indiana: average acquisition price by buyer type, Q2 2026
Indiana: average acquisition price year over year, Q2 2026

Current Quarter Purchase Summary

Analysis of Q2 2026 purchase activity by investor tier and type

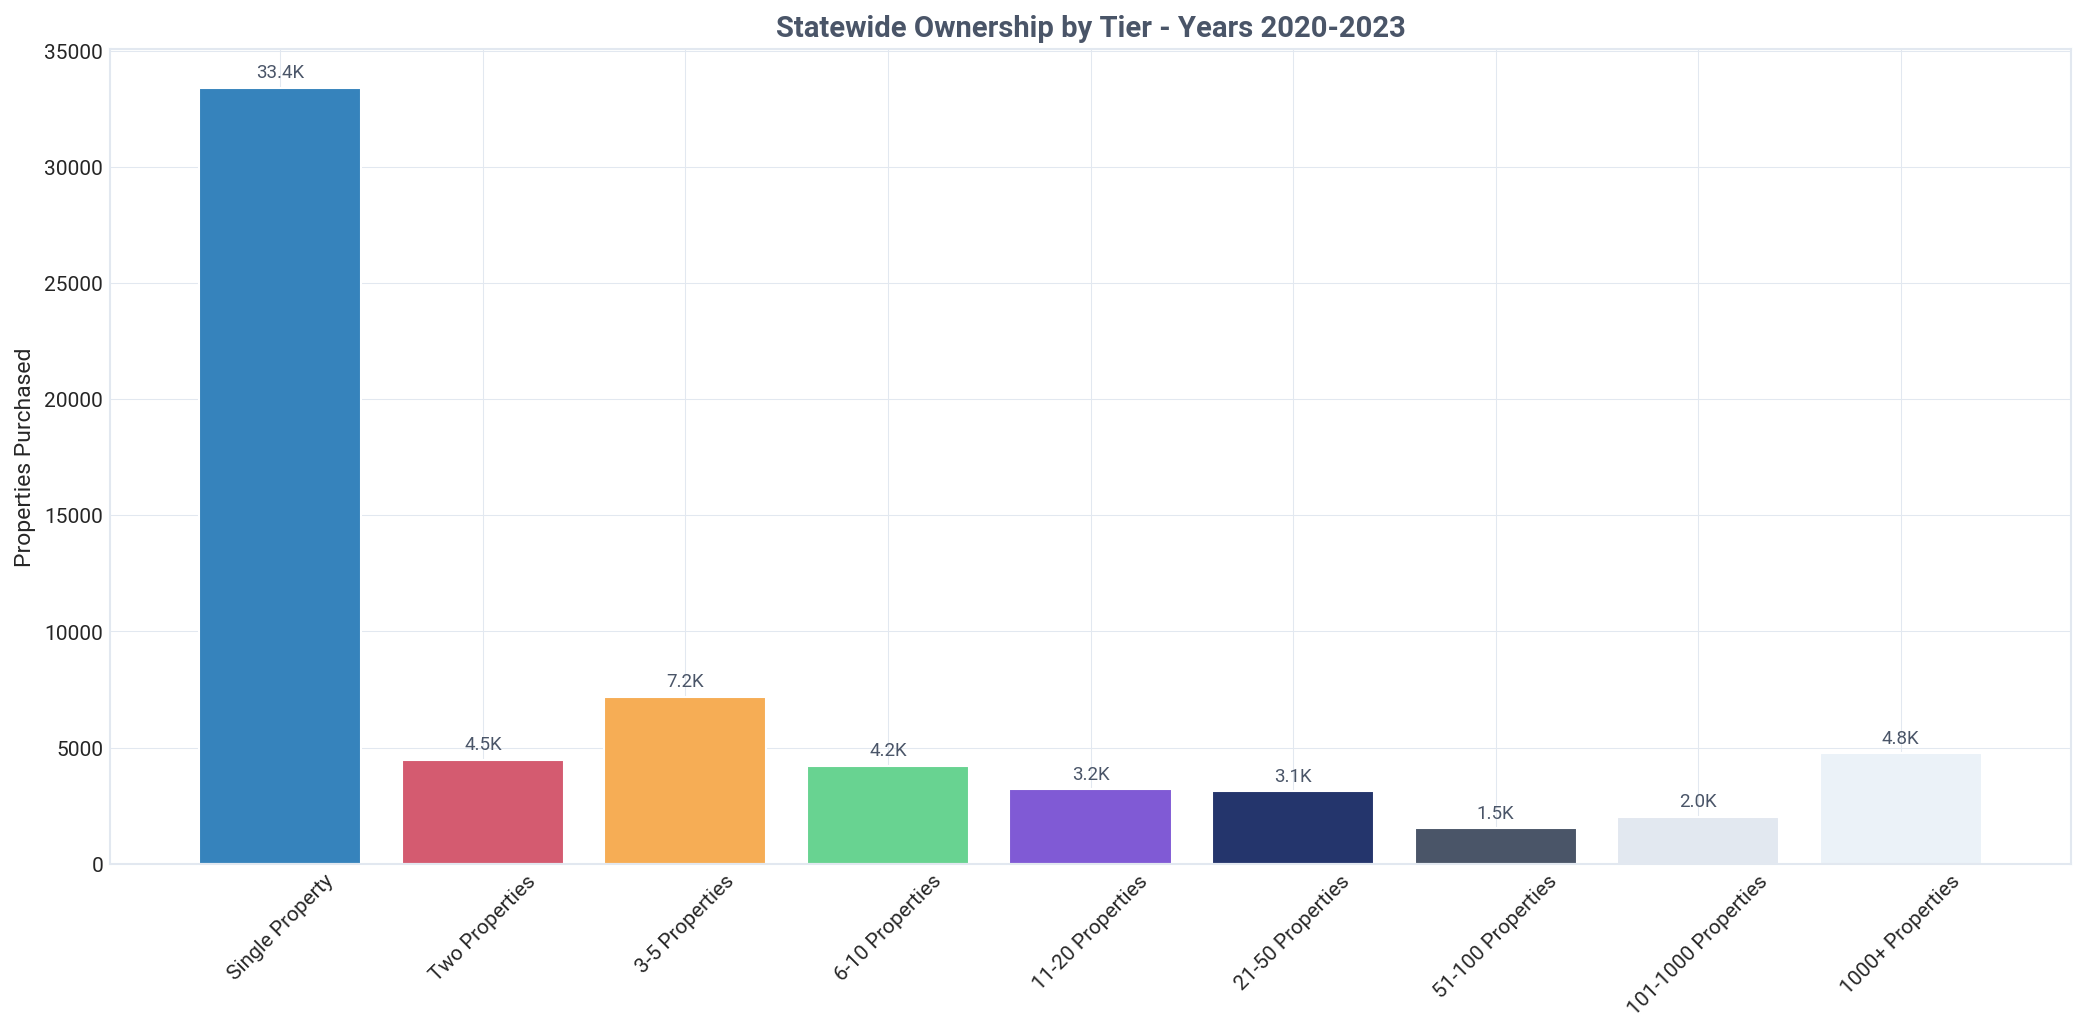
Indiana: purchases by tier, Q2 2026
Indiana: purchased property share by tier, Q2 2026
Key Insight
Landlords purchased 3,736 homes in Q2 2026, capturing 14.9% of all SFR sales in Indiana.
Detailed Findings

In Q2 2026, real estate investors were a significant force in the Indiana housing market, acquiring 3,736 of the 25,131 total SFR properties sold. This activity gives landlords a 14.9% market share of all purchases for the quarter, highlighting their consistent demand for housing inventory.

The bulk of purchasing power came from small-scale investors. Mom-and-pop landlords, who own 1-10 properties, were responsible for 2,677 acquisitions, representing a commanding 70.1% of all landlord purchase activity. This demonstrates that the grassroots, local investor is the primary driver of market activity, not large corporations.

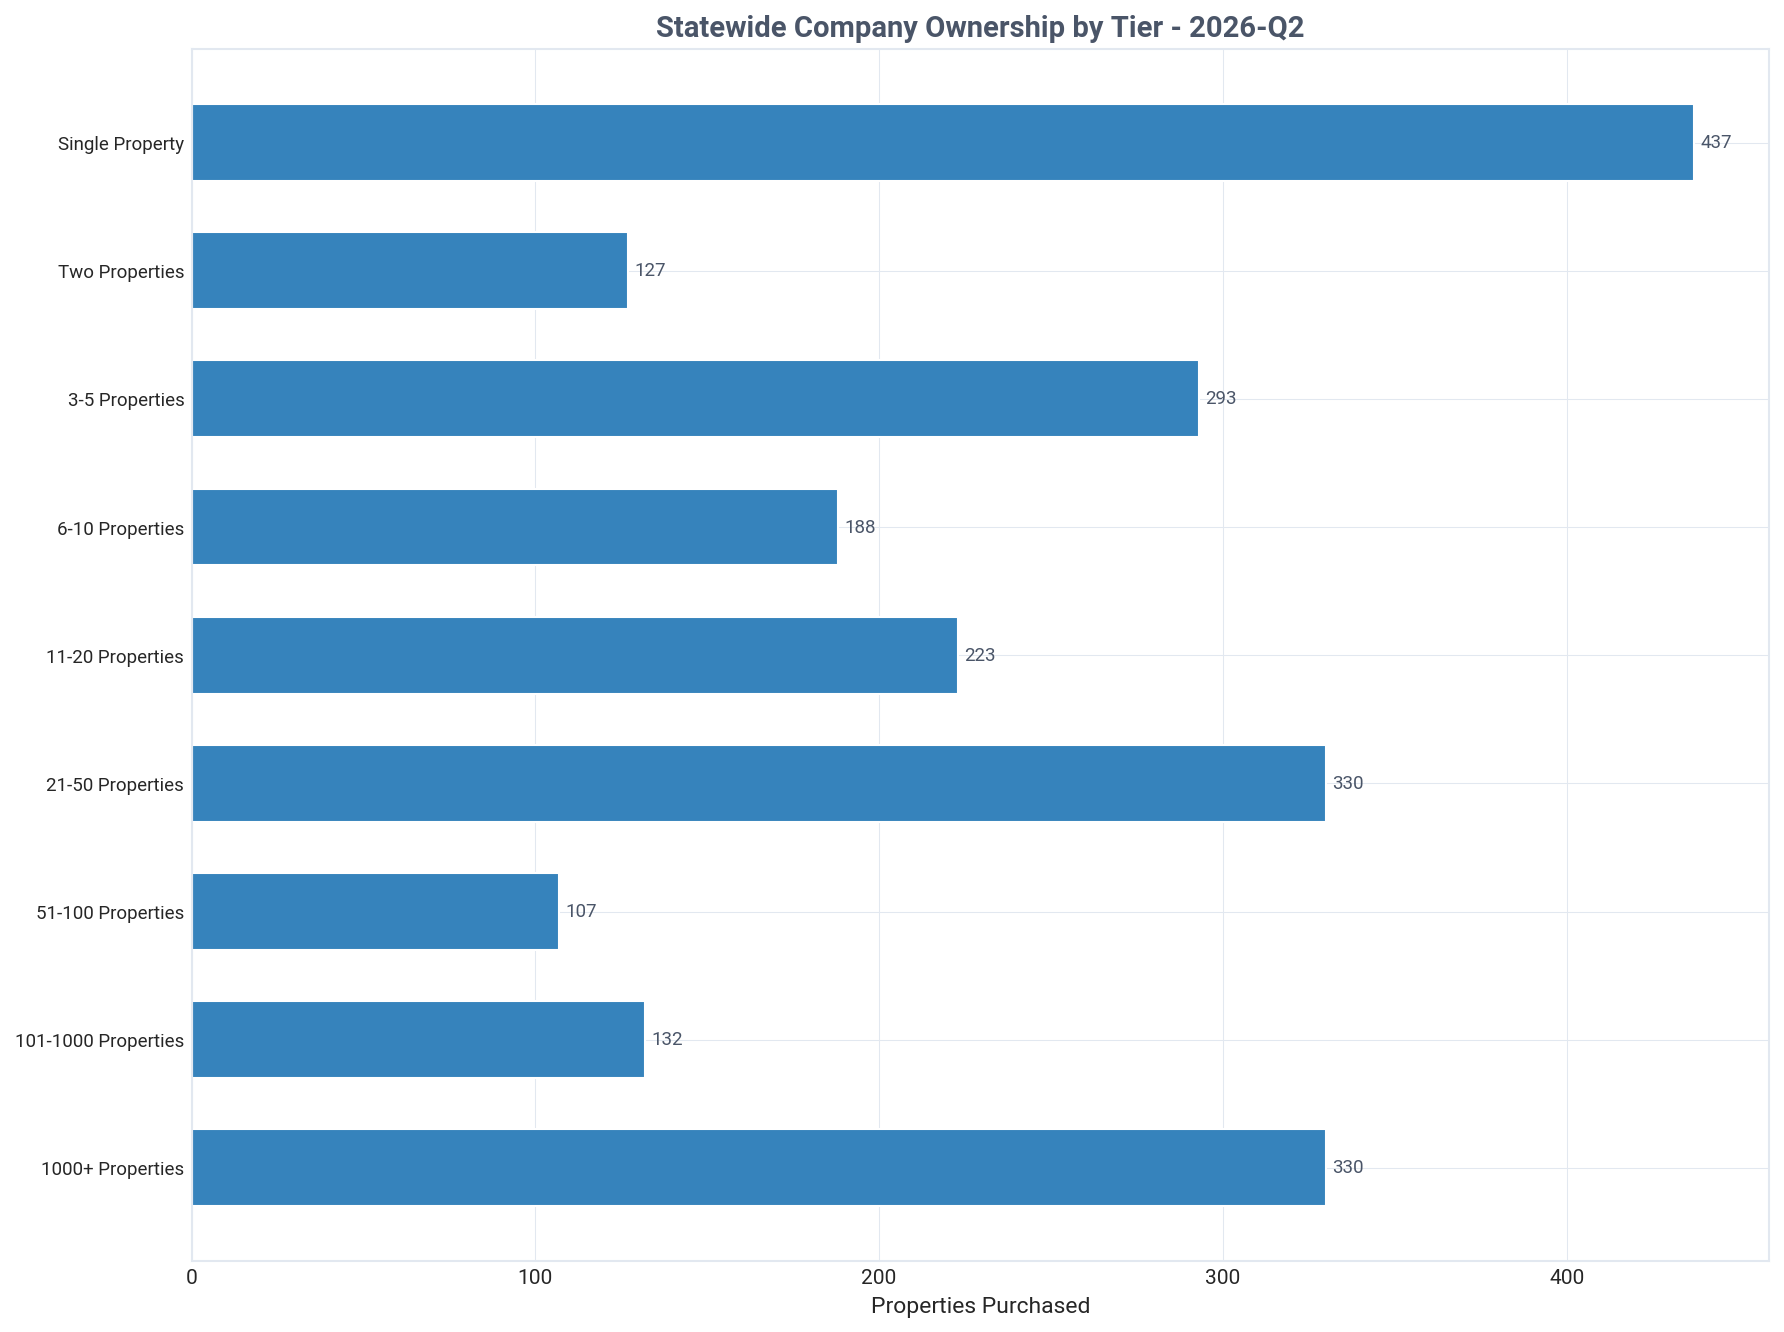
In stark contrast, institutional investors with portfolios of over 1,000 properties purchased just 330 homes, accounting for only 8.6% of the landlord total. This relatively small footprint challenges the perception that large institutions are overwhelming the market with new acquisitions.

The market continues to attract new participants, with 2,070 distinct entities purchasing their very first investment property in Q2 2026. These new entrants, who now make up the single-property tier, acquired 1,743 homes, or 45.7% of all investor purchases, signaling a healthy and accessible entry point for new landlords.

Mid-size investors also played an active role. Those in the 11-100 property tiers collectively purchased 776 properties (20.7% of the total), showing sustained growth from established but not institutional-scale operators. This middle segment acts as a crucial bridge between new entrants and large-scale players.

Ownership by Purchase Tier

Distribution of investor-owned properties across portfolio size tiers

Key Insight
Mom-and-pop landlords (1-10 properties) control a dominant 82.5% of investor-owned SFRs in Indiana.
Detailed Findings

The structure of real estate investor ownership in Indiana is overwhelmingly dominated by small-scale operators. Mom-and-pop landlords, defined as those owning 1-10 properties, collectively control 82.5% of all investor-owned SFR housing. This concentration underscores the importance of the individual investor in the state's rental market.

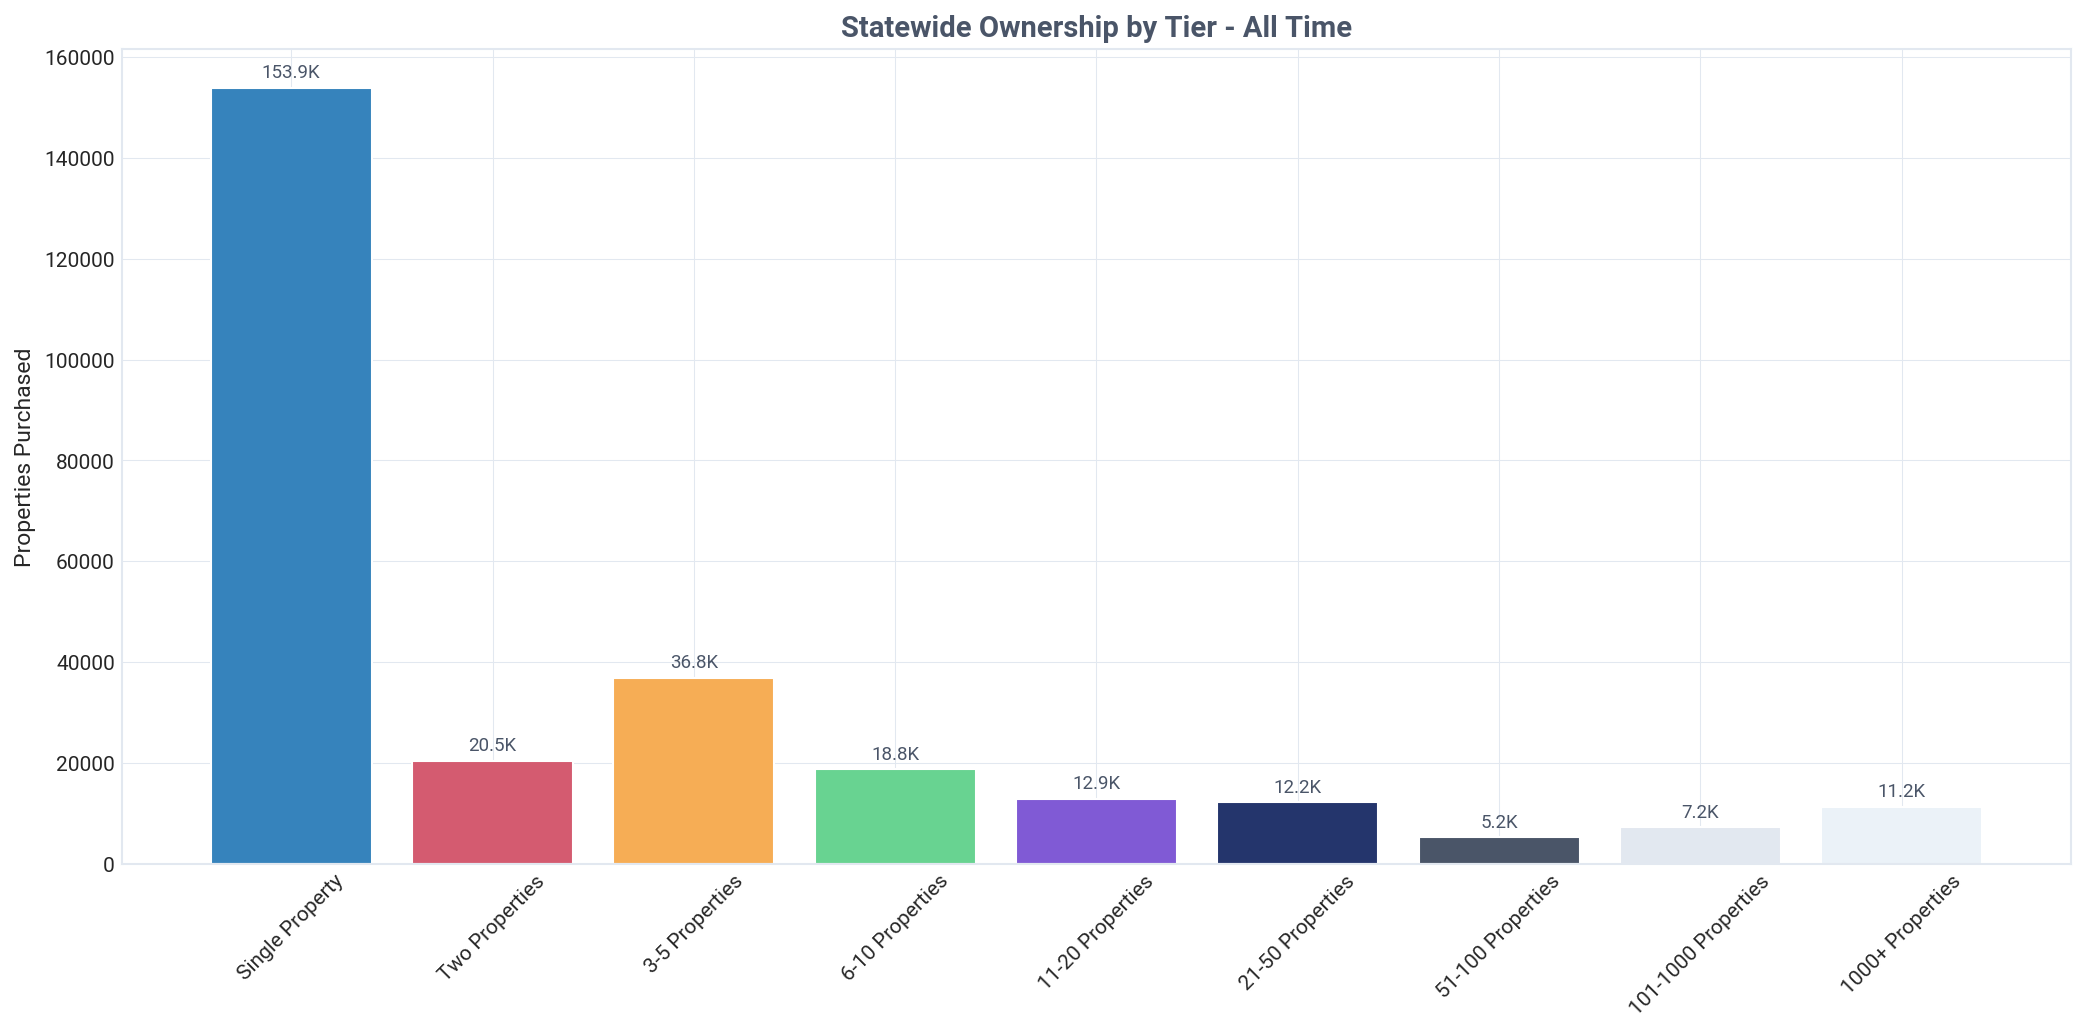
The largest single segment consists of landlords who own just one property. This group alone accounts for 153,930 properties, representing 55.2% of the total investor portfolio. This finding highlights that the typical Indiana landlord is not a large corporation but an individual with a single rental home.

Despite significant media attention, institutional investors (1,000+ properties) have a very limited footprint, owning just 11,241 properties. This amounts to only 4.0% of the investor-owned market, a figure that provides critical context to discussions about corporate ownership of housing.

Mid-size investors, those owning between 11 and 1,000 properties, collectively hold 13.5% of the investor-owned SFRs. This segment, comprising 37,555 properties, represents a group of professionalized but non-institutional operators who are scaling their portfolios.

The data from this Investor Pulse report shows a highly fragmented market structure. With over 8 out of 10 investment properties held by small landlords, the market dynamics are driven by local, individual decisions rather than centralized corporate strategies.

Indiana: current ownership by purchase tier, Q2 2026
Indiana: properties purchased by tier, all time, Q2 2026
Indiana: properties purchased by tier this quarter, Q2 2026
Indiana: properties purchased by tier year over year, Q2 2026

Need custom portfolio analysis based on these tier insights?

TALK TO AN EXPERT

Ownership by Tier & Owner Type

Breakdown of individual vs corporate ownership across portfolio tiers

Indiana: ownership by tier and owner type, Q2 2026
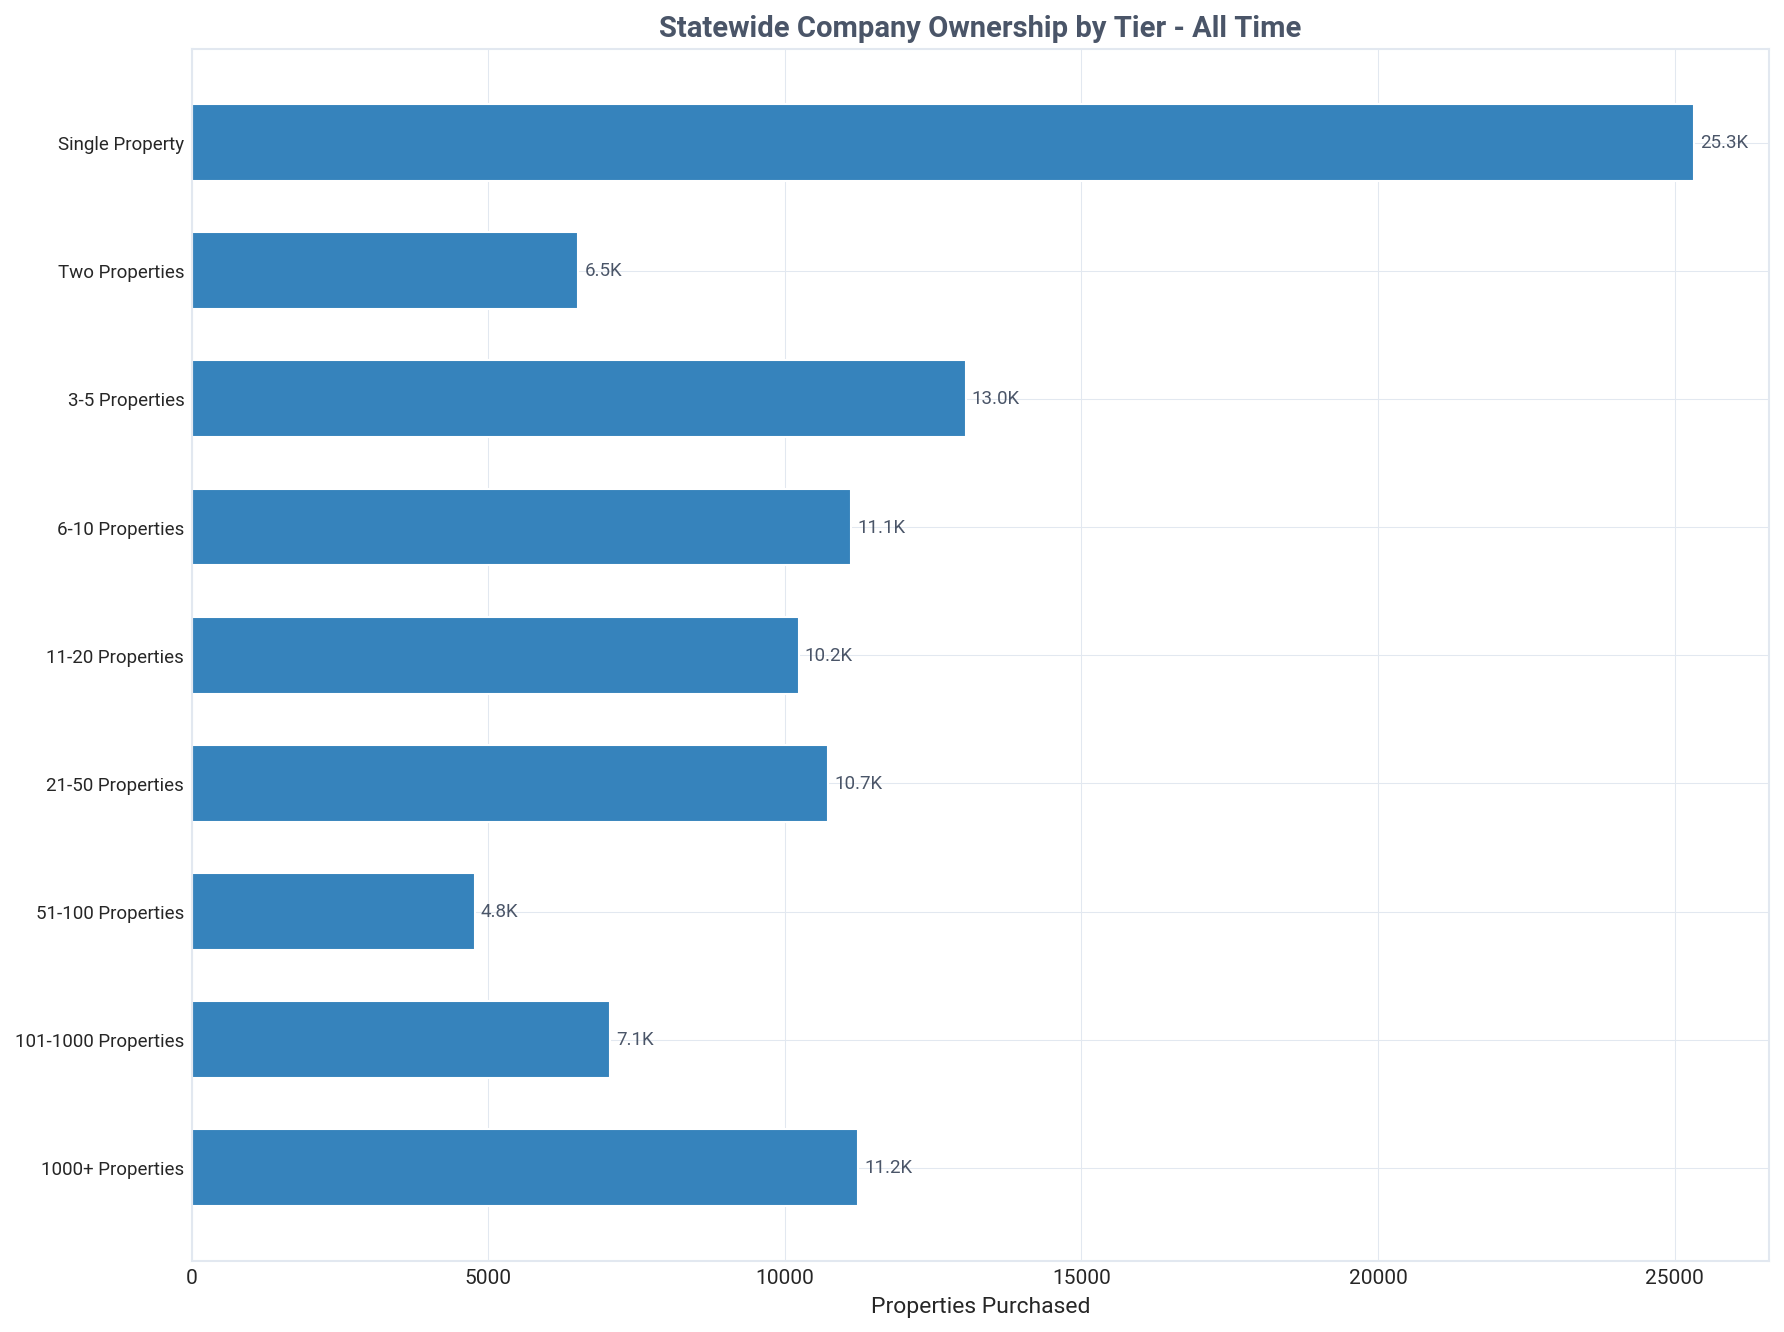
Indiana: company purchases by tier, all time, Q2 2026
Indiana: company purchases by tier this quarter, Q2 2026
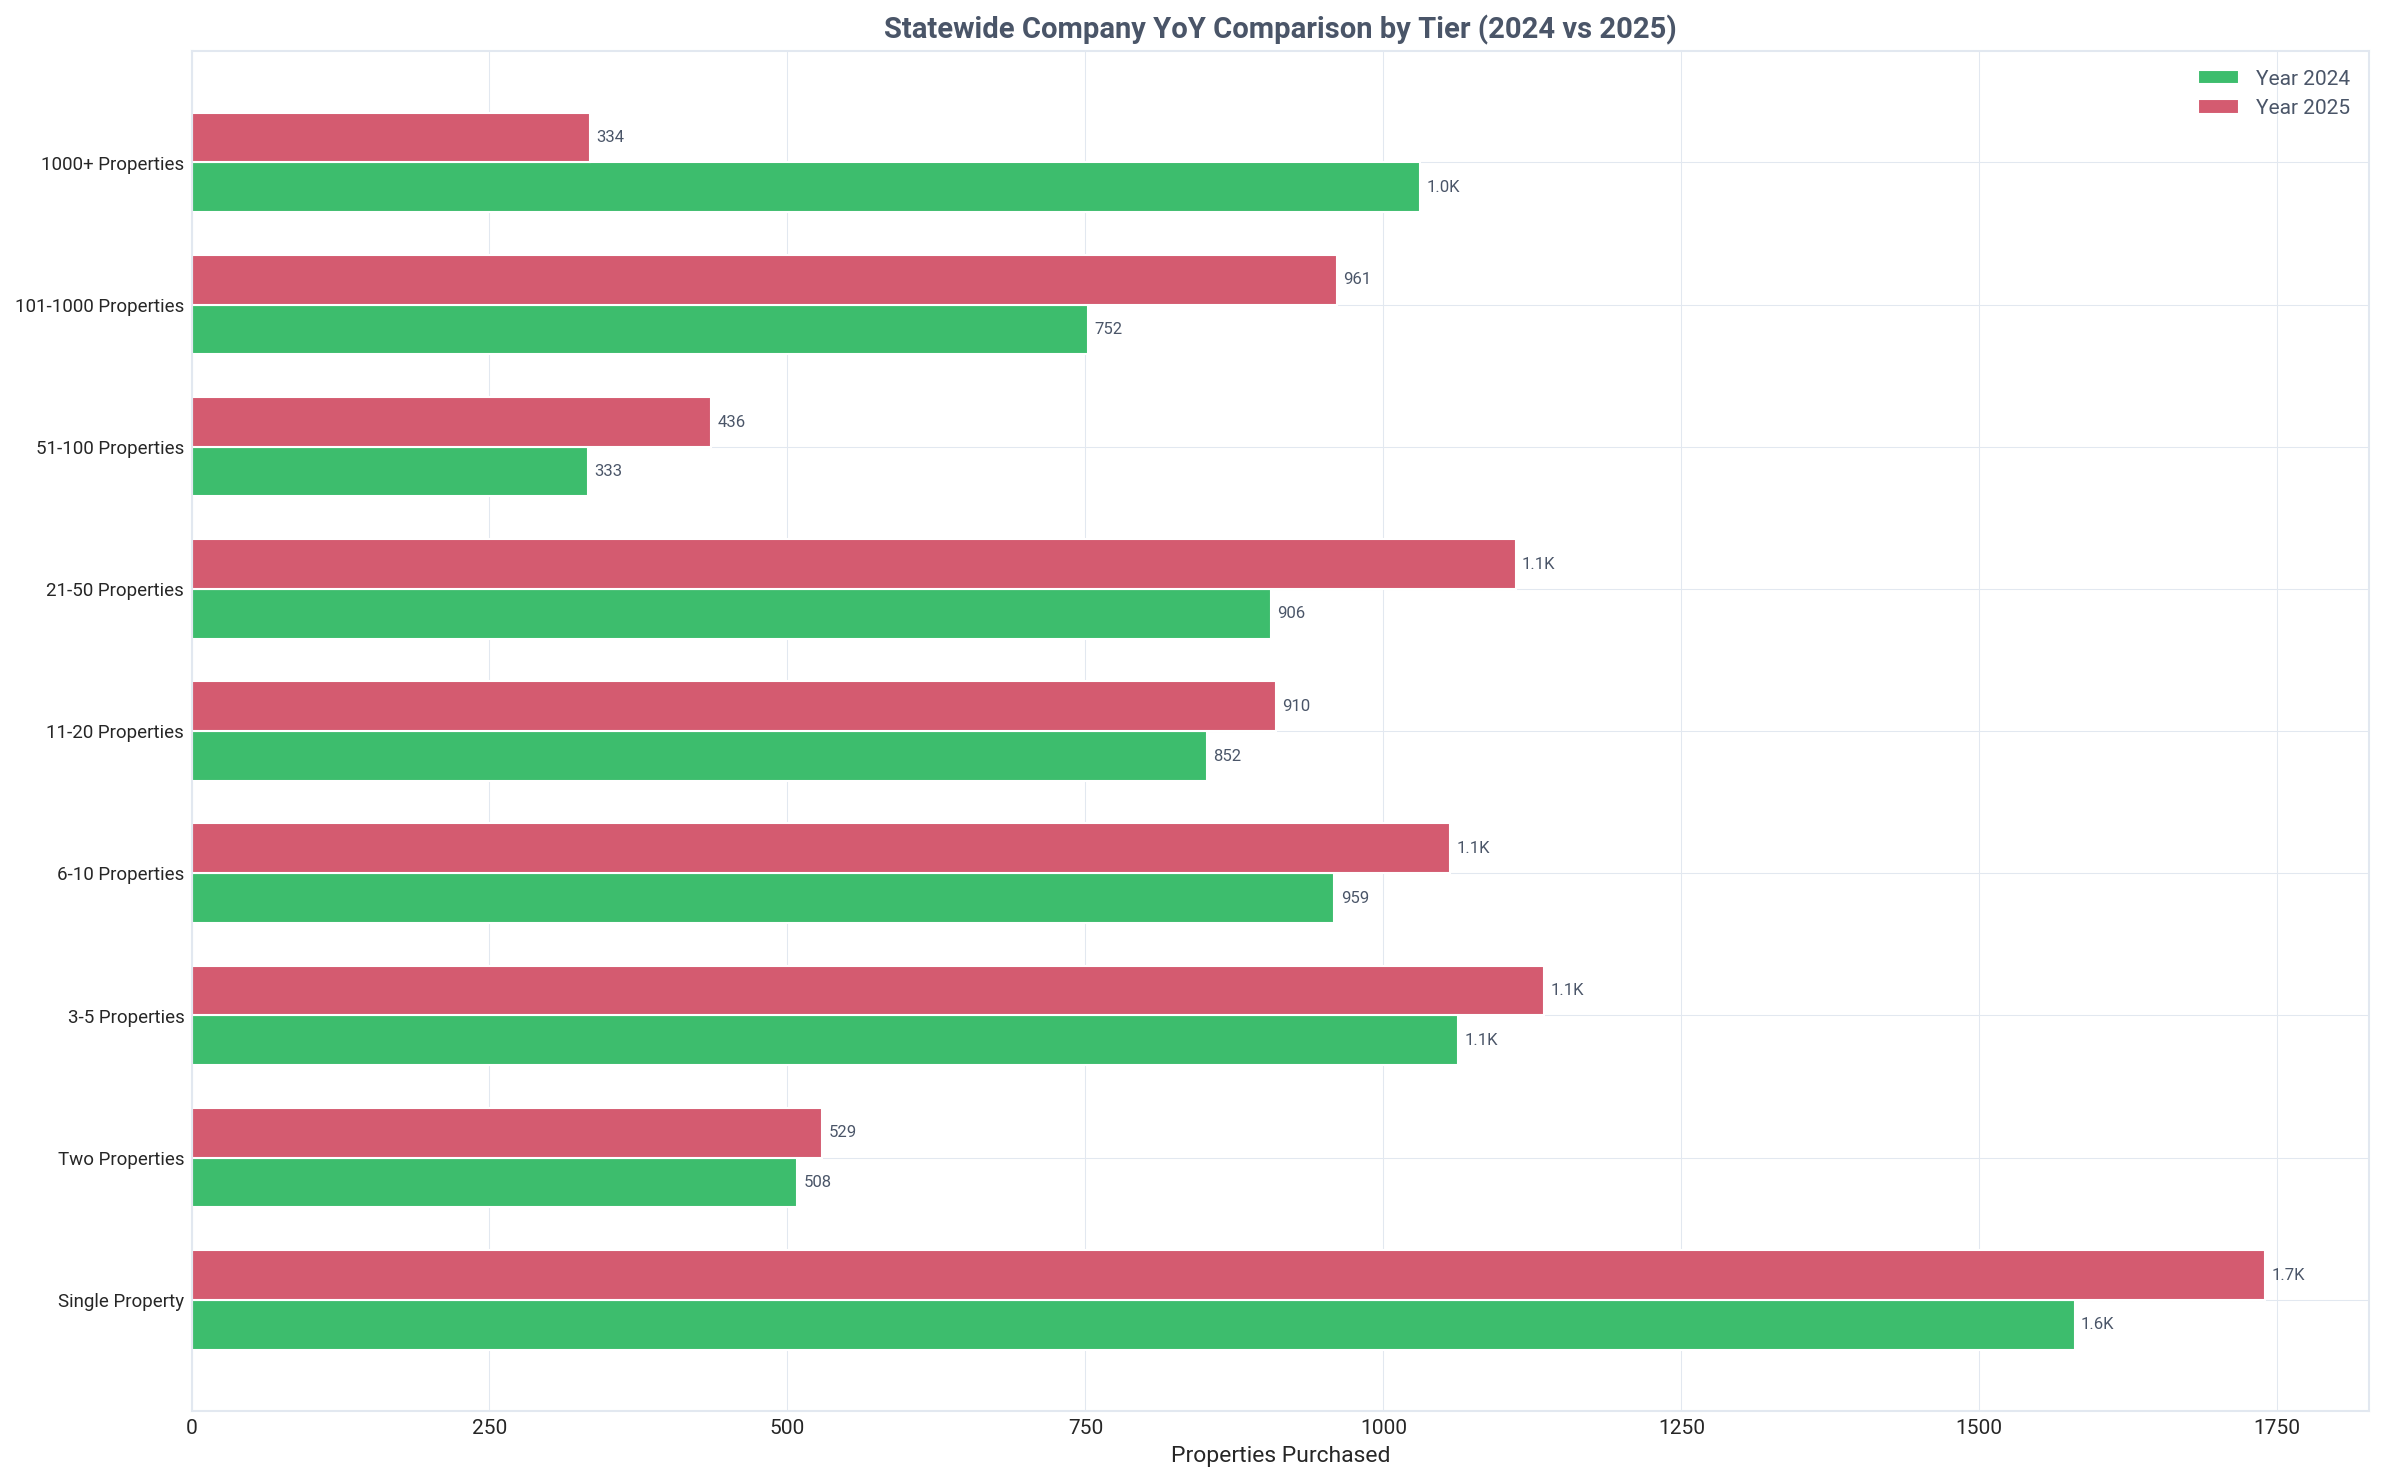
Indiana: company purchases by tier year over year, Q2 2026
Key Insight
Companies become the majority property owners starting in the 6-10 property tier, holding 58.9% of homes.
Detailed Findings

A clear crossover point exists in portfolio size where companies overtake individuals as the dominant owners. In the 6-10 property tier, companies own 11,115 properties (58.9%), marking the threshold where a more corporate structure becomes the majority. This signals a shift from personal investment to a more formalized business operation.

Individual investors are the bedrock of the small-portfolio segment. They own 130,638 single-property investments (83.8% of that tier) and 14,059 two-property investments (68.3%). This confirms that entry-level real estate investing in Indiana is primarily an individual pursuit.

As portfolio sizes increase, company ownership becomes nearly absolute. Companies own 79.1% of properties in the 11-20 tier and 88.0% in the 21-50 tier. This trend culminates in the large 101-1,000 property tier, where companies control 7,054 properties, a staggering 97.4% share.

The data illustrates a natural progression in ownership structure. Investors may begin as individuals, but as they scale past five properties, the operational and legal benefits of forming a company become compelling, leading to the observed shift in ownership type.

Even within the larger tiers, a small number of individuals persist. For instance, individuals still own 192 properties (2.6%) in the 101-1,000 property tier, indicating that while uncommon, it is possible for individuals to manage large portfolios without incorporation. This type of detailed ownership information can be accessed through a robust property data API.

Geographic Distribution

Regional breakdown of investor activity and ownership patterns

Key Insight
Marion County leads Indiana with 40,666 investor-owned properties, the highest count in the state.
Detailed Findings

Investor activity in Indiana is heavily concentrated in its most populous counties. Marion County (Indianapolis) is the epicenter, with 40,666 investor-owned properties, followed by Lake County (19,450), St. Joseph County (13,957), Allen County (12,578), and Hamilton County (10,983). Together, these five counties account for 97,634 properties, or 35.7% of the state's total investor portfolio.

A different picture emerges when analyzing ownership as a percentage of total housing stock. The highest investor penetration rates are found in more rural or recreational counties. Crawford County leads with an investor ownership rate of 35.1%, followed by Brown County (28.4%), Sullivan County (27.7%), Jay County (26.4%), and Fulton County (24.5%).

This divergence between high-volume and high-percentage areas highlights two distinct investor strategies. Urban centers like Marion County offer scale and a large tenant pool, while smaller counties may provide higher yields, lower acquisition costs, or appeal to vacation rental investors. Such trends can be monitored by examining assessor data at a granular level.

In Marion County, the 40,666 investor-owned properties represent a 15.4% ownership rate, a significant but not overwhelming share. This indicates a competitive market where investors operate alongside a large base of traditional homeowners.

The geographic data reveals that while major metropolitan areas are the primary hubs for total investor property count, the most saturated markets are often in less populated regions. This insight is crucial for investors looking for either established, liquid markets or emerging areas with less competition.

Indiana: landlord ownership map, Q2 2026
Indiana: top 15 areas by landlord-owned properties, Q2 2026
Indiana: top 15 areas by landlord ownership share, Q2 2026

Historical Transactions

Buy/sell transaction trends over time for all landlords and institutional investors

Indiana: landlord buy and sell transactions, Q2 2026
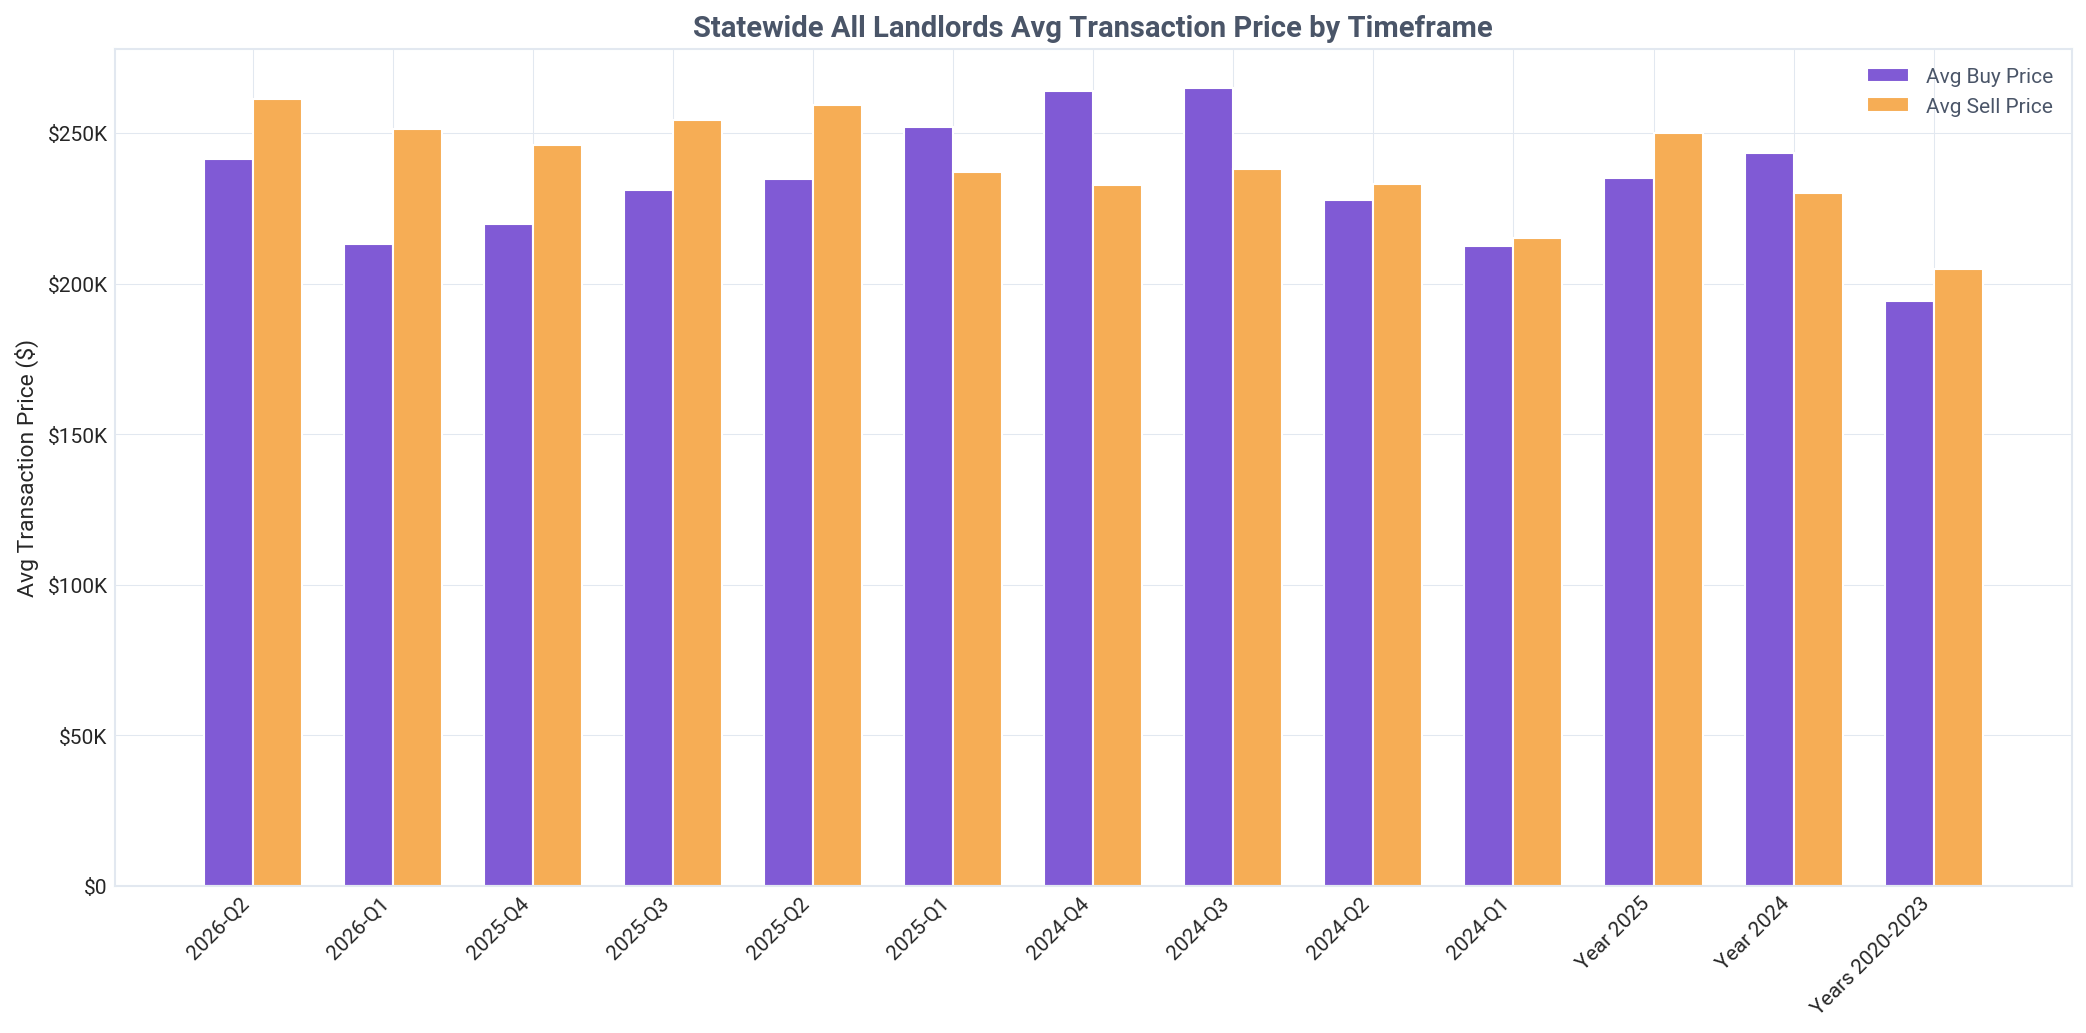
Indiana: landlord average buy and sell prices, Q2 2026
Indiana: landlord transactions year over year, Q2 2026
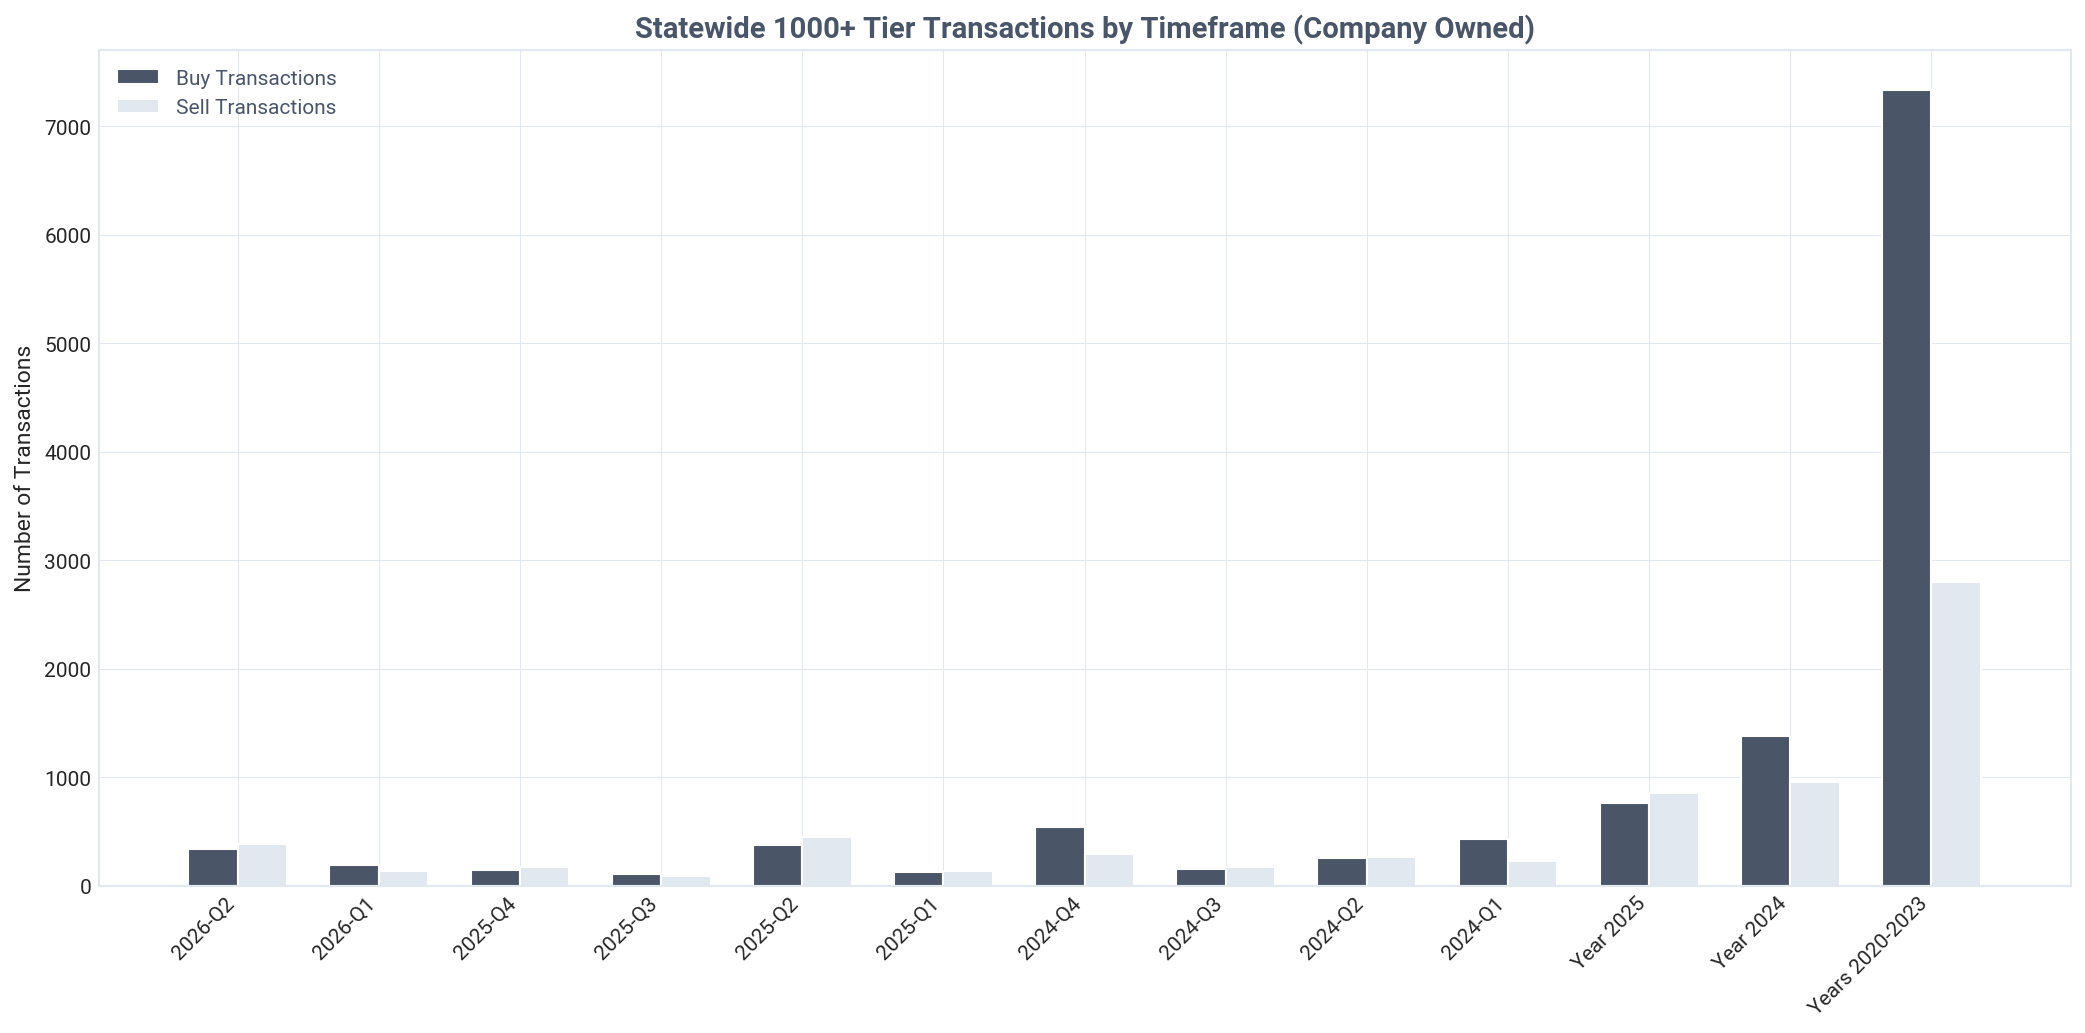
Indiana: 1000+ tier company transactions, Q2 2026
Indiana: 1000+ tier company average prices, Q2 2026
Indiana: 1000+ tier transactions year over year, Q2 2026
Key Insight
Indiana landlords are strong net buyers, acquiring 1.88 properties for every 1 they sold in Q2 2026.
Detailed Findings

Landlords in Indiana continue to expand their portfolios, demonstrating a strong net-buyer position in Q2 2026. They purchased 4,345 properties while selling only 2,307, resulting in a net gain of 2,038 properties and a buy-to-sell ratio of 1.88. This indicates sustained confidence in the state's rental market.

However, a significant divergence in strategy is apparent at the institutional level. Investors in the 1,000+ property tier were net sellers during Q2 2026, acquiring 341 properties but divesting 382. This net-seller position marks a strategic retreat or portfolio churn, contrasting sharply with the accumulation seen across the broader investor market.

The net-buyer trend for all landlords has been consistent over the long term. In 2025, investors bought 23,168 properties and sold 9,676 (a 2.4x ratio), and in 2024 they bought 24,662 and sold 10,311 (a 2.4x ratio). The slightly lower ratio in the most recent quarter suggests a market that is active but potentially stabilizing.

Institutional behavior has been more volatile. While they were net sellers in Q2 2026 and for the full year 2025 (selling 86 more properties than they bought), they were net buyers in 2024 by a margin of 424 properties. This suggests their strategy is more tactical and responsive to short-term market conditions.

This split strategy, with smaller investors accumulating properties while the largest players selectively sell, could signal a market peak or a strategic reallocation of capital by institutional firms. Tracking these transactional trends, including looking for signs of pre-foreclosure data, is key to understanding market direction.

Current Quarter Transactions

Q2 2026 transaction analysis by tier, price, and inter-landlord activity

Key Insight
Landlords were involved in 13.1% of all SFR transactions in Q2 2026, making 4,345 purchases.
Detailed Findings

In Q2 2026, landlord purchases accounted for 13.1% of all 33,235 SFR transactions in Indiana, with investors acquiring a total of 4,345 properties. This level of activity underscores their role as a consistent source of demand in the housing market.

A clear pricing hierarchy emerged among investor tiers. Institutional investors (1,000+ properties) paid the highest average price at $313,729 per property. This is 15.0% more than the $272,776 paid by new single-property landlords, suggesting institutions target higher-value, rent-ready assets while new entrants may focus on lower-cost properties with value-add potential.

Institutional buyers relied heavily on the existing investor network for inventory. A significant 72.4% of their 341 acquisitions were purchased from other landlords. This high rate of inter-landlord trading points to a strategy of consolidation and acquiring proven rental assets rather than competing with traditional homebuyers.

In contrast, new single-property landlords sourced only 14.3% of their purchases from other investors. This indicates that new entrants are primarily competing in the open market, acquiring properties from homeowners or new construction, which may contribute to their lower average purchase price.

Transaction volume was highest at the entry level, with 2,082 transactions by single-property investors. This was more than six times the 341 transactions conducted by institutional investors, reinforcing that the market's transactional depth is driven by smaller players. Insights like these are often found in detailed market reports.

Indiana: landlord share of transactions, Q2 2026
Indiana: transactions by tier this quarter, Q2 2026
Indiana: average purchase price by tier, Q2 2026

Ready to leverage this data for your real estate investment decisions?

TALK TO AN EXPERT

Executive Summary

Mom-and-pop landlords control 82.5% of Indiana's investor market as institutional firms become net sellers.
Holdings
Investors own 270,969 SFR properties, representing 13.3% of Indiana's total market, with individual investors holding 175,203 (64.7%) and companies owning 99,250 (36.6%).
Pricing
Landlords paid 30.0% less than homeowners in Q2 2026, securing an average discount of $105,727 per property ($246,696 vs $352,423).
Activity
In Q2 2026, landlords purchased 14.9% of all SFRs sold (3,736 properties), with 2,070 new single-property landlords entering the market.
Market Share
Small mom-and-pop landlords (1-10 properties) overwhelmingly control the market with an 82.5% share of investor housing, while institutional investors (1000+) own just 4.0%.
Ownership Type
Individual investors dominate smaller portfolios (owning 83.8% of single-property assets), but companies become the majority owners in portfolios of 6-10 properties and larger.
Transactions
Landlords remain strong net buyers with a 1.88 buy-to-sell ratio in Q2 2026 (4,345 buys vs 2,307 sells), but institutional investors have shifted to become net sellers (341 buys vs 382 sells).
Market Narrative

The real estate investor landscape in Indiana is firmly controlled by small, independent operators, challenging common narratives of corporate dominance. Investors own 270,969 single-family properties, or 13.3% of the state's total SFR market. The ownership structure is granular, with mom-and-pop landlords (1-10 properties) commanding an 82.5% share of this portfolio. In stark contrast, institutional firms with over 1,000 properties own just 4.0%. This distribution is further reflected in the entity types, where individual landlords (187,479) outnumber companies (38,720) by nearly five to one, solidifying the market's grassroots foundation.

Investor behavior in Q2 2026 reveals sophisticated strategies and a widening gap between large and small players. Landlords demonstrated significant purchasing power, acquiring 14.9% of all homes sold while securing a remarkable 30.0% price discount compared to traditional homeowners, an average savings of $105,727 per property. Transaction data shows a critical divergence: while the overall investor market remains in a strong accumulation phase with a 1.88 buy-to-sell ratio, institutional investors have pivoted to become net sellers. This suggests the largest firms may be optimizing portfolios or capitalizing on market strength, while 2,070 new single-property landlords flooded into the market, signaling continued opportunity for new entrants.

The defining characteristic of Indiana's housing market is this dichotomy of activity. The market's foundation is a large, fragmented base of individual investors who continue to buy and hold, providing essential rental housing. Simultaneously, the most sophisticated institutional players are becoming a source of market liquidity by selling properties, often to other investors, as seen by their 72.4% landlord-to-landlord purchase rate. This dynamic suggests a maturing market where small investors drive expansion while large firms focus on consolidation and strategic churn, a key trend for anyone analyzing the future of housing in the state.

About This Report

Report Methodology

This report analyzes BatchData's Investor Pulse dataset, covering single-family residential (SFR) investor activity across the United States.

Data is extracted from 15 CSV files covering ownership, transactions, and pricing trends, then analyzed using AI-powered insights.

Property Counting Methodology:

Distinct Counts: All headline totals represent distinct properties. If 2+ landlords co-own the same property, it's counted only once. This provides accurate market representation.

Category Breakdowns: When analyzing by tier (01-09), owner type (Individual/Corporate), or occupancy status, properties with co-ownership across categories are counted once per category. This causes breakdowns to sum 2-4% higher than totals, and percentages may sum to 100-104%. This is expected and reflects co-ownership patterns.

Tier Properties Category
01-041-10Mom-and-Pop
05-0711-100Mid-Size
08101-1000Large
091000+Institutional
About BatchData

BatchData provides comprehensive real estate data and analytics, offering insights into property ownership, investor activity, and market trends across the United States.

The Investor Pulse dataset tracks single-family residential (SFR) investor behavior at national, state, county, and MSA levels.

For more information, visit batchdata.io or explore our API documentation.

Data Freshness
Report Generated October 28, 2026 at 11:20 PM
Data Period Q2 2026
Geography Level State
Geography Indiana
×
Chart Section2 Coverage
Indiana: SFR vs other property coverage, Q2 2026
×
Chart Section3 Ownership Donut
Indiana: SFR ownership share, company vs individual, Q2 2026
×
Chart Section3 Ownership Bar
Indiana: SFR properties by owner type, Q2 2026
×
Chart Section4 Distribution
Indiana: company vs individual landlords, Q2 2026
×
Chart Section5 Holdings
Indiana: landlord SFR holdings by type, Q2 2026
×
Chart Section6 Prices
Indiana: properties purchased by timeframe, Q2 2026
×
Chart Section6 Prices Alt
Indiana: average acquisition price by timeframe, Q2 2026
×
Chart Section6 Yoy Comparison
Indiana: average acquisition price year over year, Q2 2026
×
Chart Section6 Trends
Indiana: average acquisition price by buyer type, Q2 2026
×
Chart Section7 Purchases
Indiana: purchases by tier, Q2 2026
×
Chart Section7 Tiers
Indiana: purchased property share by tier, Q2 2026
×
Chart Section8 Distribution
Indiana: current ownership by purchase tier, Q2 2026
×
Chart Section8 Prices
Indiana: properties purchased by tier, all time, Q2 2026
×
Chart Section8 Prices Q4
Indiana: properties purchased by tier this quarter, Q2 2026
×
Chart Section8 Prices 2020
Indiana: properties purchased by tier, historical, Q2 2026
×
Chart Section8 Yoy Comparison
Indiana: properties purchased by tier year over year, Q2 2026
×
Chart Section9 Ownership
Indiana: ownership by tier and owner type, Q2 2026
×
Chart Section9 Growth
Indiana: company purchases by tier, all time, Q2 2026
×
Chart Section9 Growth Q4
Indiana: company purchases by tier this quarter, Q2 2026
×
Chart Section9 Yoy Comparison
Indiana: company purchases by tier year over year, Q2 2026
×
Chart Section10 Top Regions
Indiana: top 15 areas by landlord-owned properties, Q2 2026
×
Chart Section10 Top Pct
Indiana: top 15 areas by landlord ownership share, Q2 2026
×
Chart Section10 Map
Indiana: landlord ownership map, Q2 2026
×
Chart Section11 Buysell
Indiana: landlord buy and sell transactions, Q2 2026
×
Chart Section11 Buysell Price
Indiana: landlord average buy and sell prices, Q2 2026
×
Chart Section11 Yoy All Landlords
Indiana: landlord transactions year over year, Q2 2026
×
Chart Section11 Institutional
Indiana: 1000+ tier company transactions, Q2 2026
×
Chart Section11 Institutional Price
Indiana: 1000+ tier company average prices, Q2 2026
×
Chart Section11 Yoy Institutional
Indiana: 1000+ tier transactions year over year, Q2 2026
×
Chart Section12 Transactions
Indiana: landlord share of transactions, Q2 2026
×
Chart Section12 Prices
Indiana: transactions by tier this quarter, Q2 2026
×
Chart Section12 Prices Detail
Indiana: average purchase price by tier, Q2 2026

Licensing & Usage Rights

This report, data, and all visual analyses are the property of BatchData © 2026 BatchService, Inc. and are licensed under Creative Commons Attribution-NonCommercial-NoDerivatives 4.0 International (CC BY-NC-ND 4.0).

You MAY: Download, share, or excerpt this content for personal or non-commercial purposes, provided you give clear attribution to BatchData with a link back to this original page.

You MAY NOT: Use this data commercially, resell or redistribute it as your own, or publish modified versions.

For commercial licensing: batchdata.io/contact-sales

Creative Commons BY-NC-ND 4.0 - creativecommons.org/licenses/by-nc-nd/4.0/

How to cite this report

BatchData. (2026). Q2 2026 IN State Report. BatchService, Inc. Retrieved from https://reports.batchdata.io/investorpulse-reports/2026-q2-state-in/. Licensed under CC BY-NC-ND 4.0.