Alaska Investor Pulse Report (2026-Q2)

Real Estate comprehensive investment analysis of investor activity in the Alaska single-family residential housing market. Discover ownership trends, transaction patterns, and market insights.

Market Overview

Total SFR Properties in Alaska
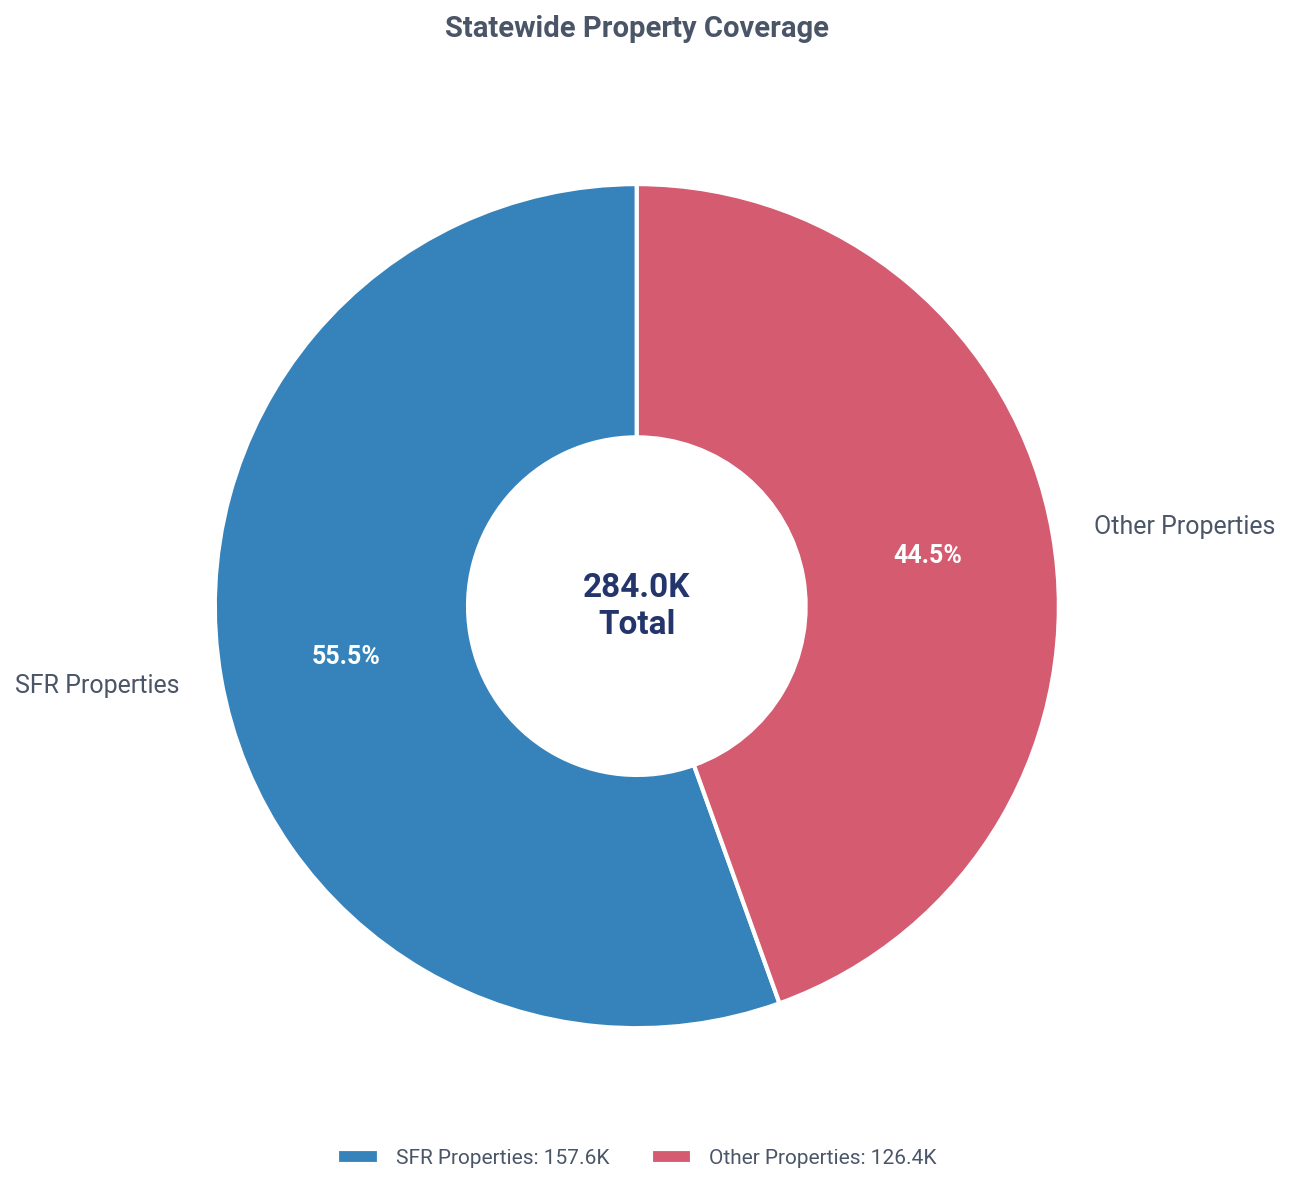
157,592
Total Investors in Alaska
56,891
Investor Owned SFR in Alaska
42,007(26.7%)
Individual Landlords
Landlords
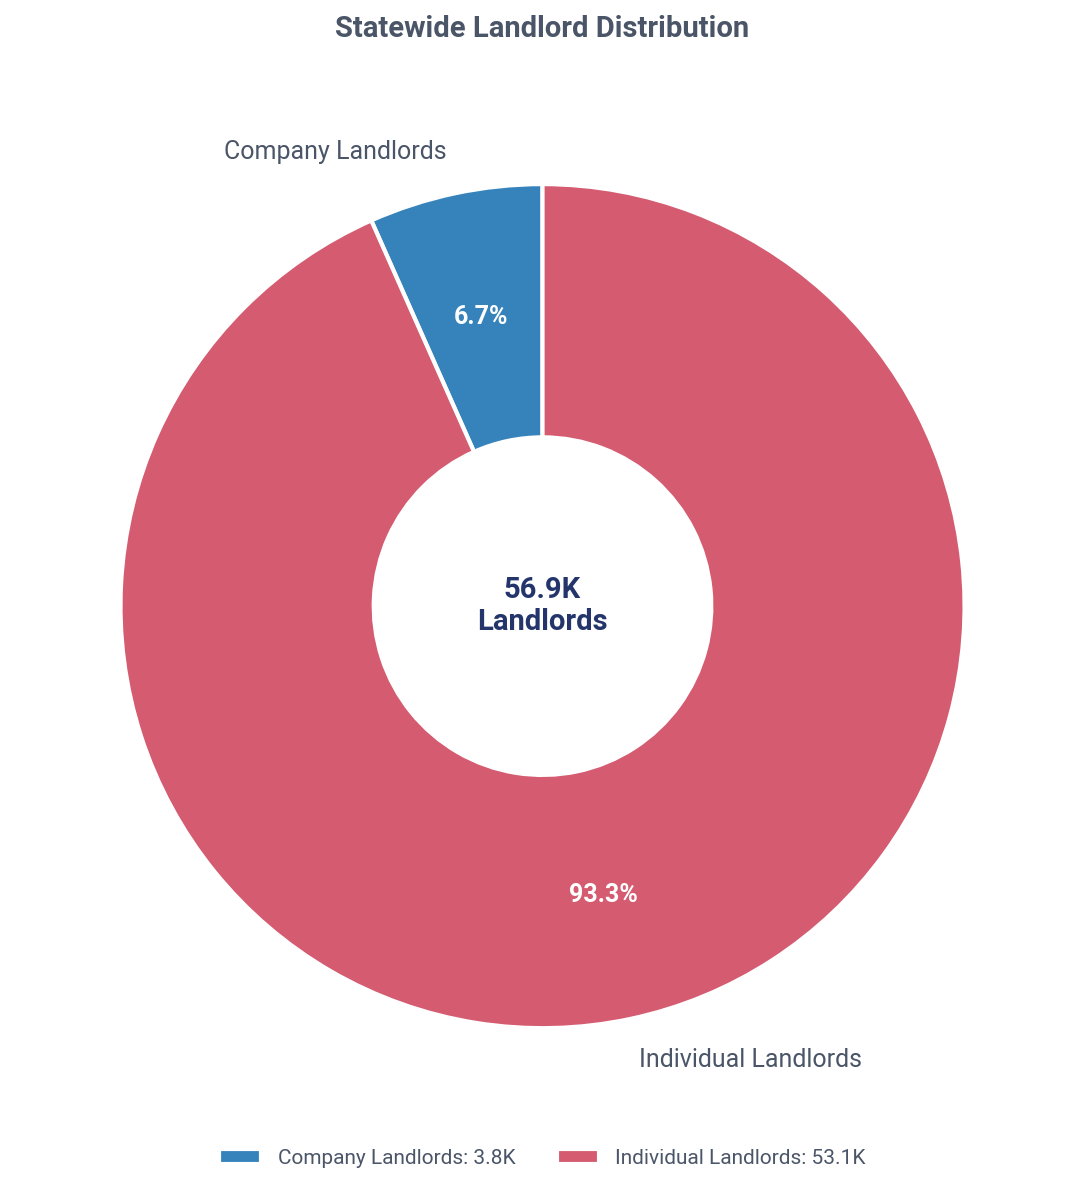
53,107
SFR Owned
38,488
Corporate Landlords
Landlords
3,784
SFR Owned
4,326
Understanding Property Counts

Distinct Count Methodology: The total 42,007 represents distinct properties - if 2+ landlords co-own the same property, it's counted only once. This provides the most accurate representation of investor-owned SFR properties.

Why totals don't sum: When broken down by Individual vs Corporate ownership (or by tier), properties with co-ownership across categories are counted once per category. For example, if a property is co-owned by an individual AND a corporate landlord, it appears in both counts. This is why Individual + Corporate totals may exceed the distinct total by 2-4%, and percentages may sum to 100-104%.

Market Visualization

Alaska: SFR vs other property coverage, Q2 2026
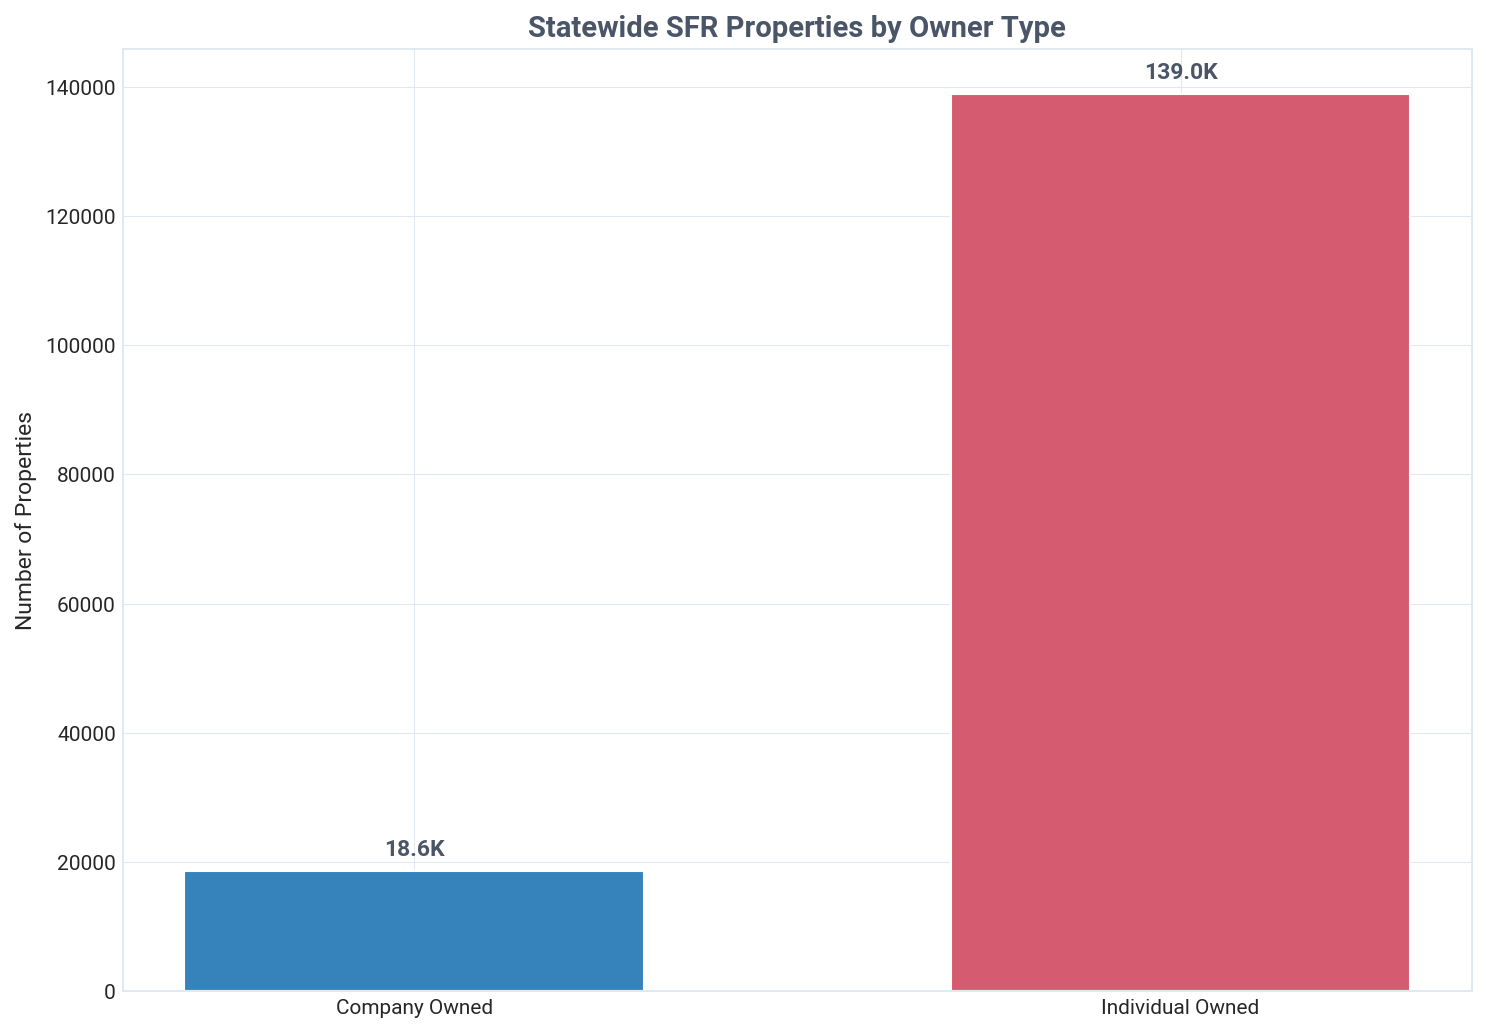
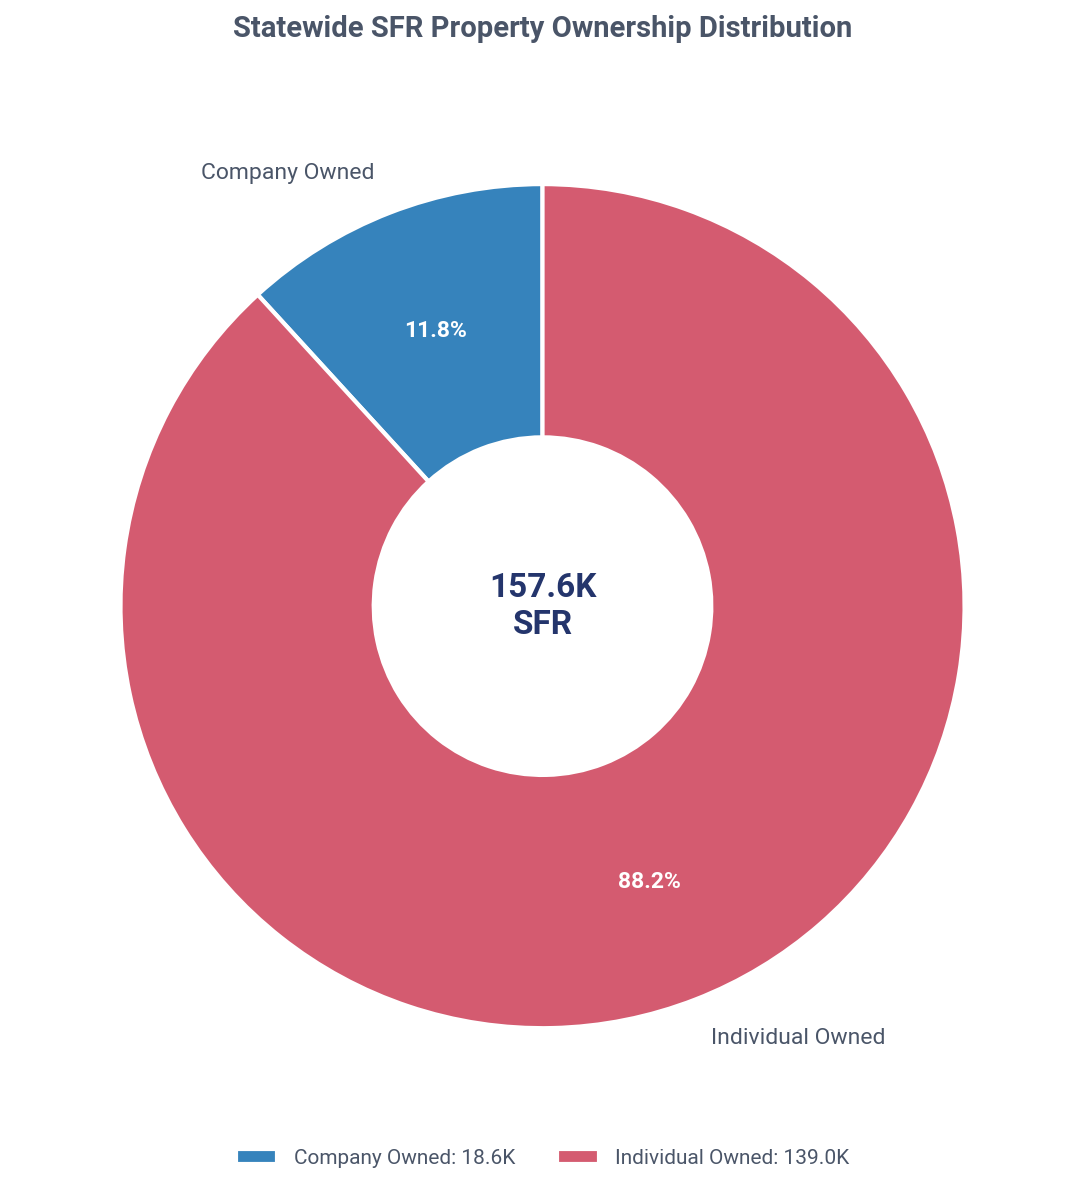
Alaska: SFR ownership share, company vs individual, Q2 2026
Alaska: company vs individual landlords, Q2 2026

Key Market Insights

Alaska's SFR Market Dominated by Small Investors Owning 99% of Rental Homes
Investors own 26.7% of Alaska's single-family housing, a portfolio of 42,007 properties. The market is overwhelmingly controlled by mom-and-pop landlords (99.0% of holdings), while institutional investors own just 0.2%. In Q2 2026, landlords were aggressive net buyers, acquiring 29.4% of all homes sold at a 5.5% discount compared to traditional homeowners.
Landlord Owned Current Holdings
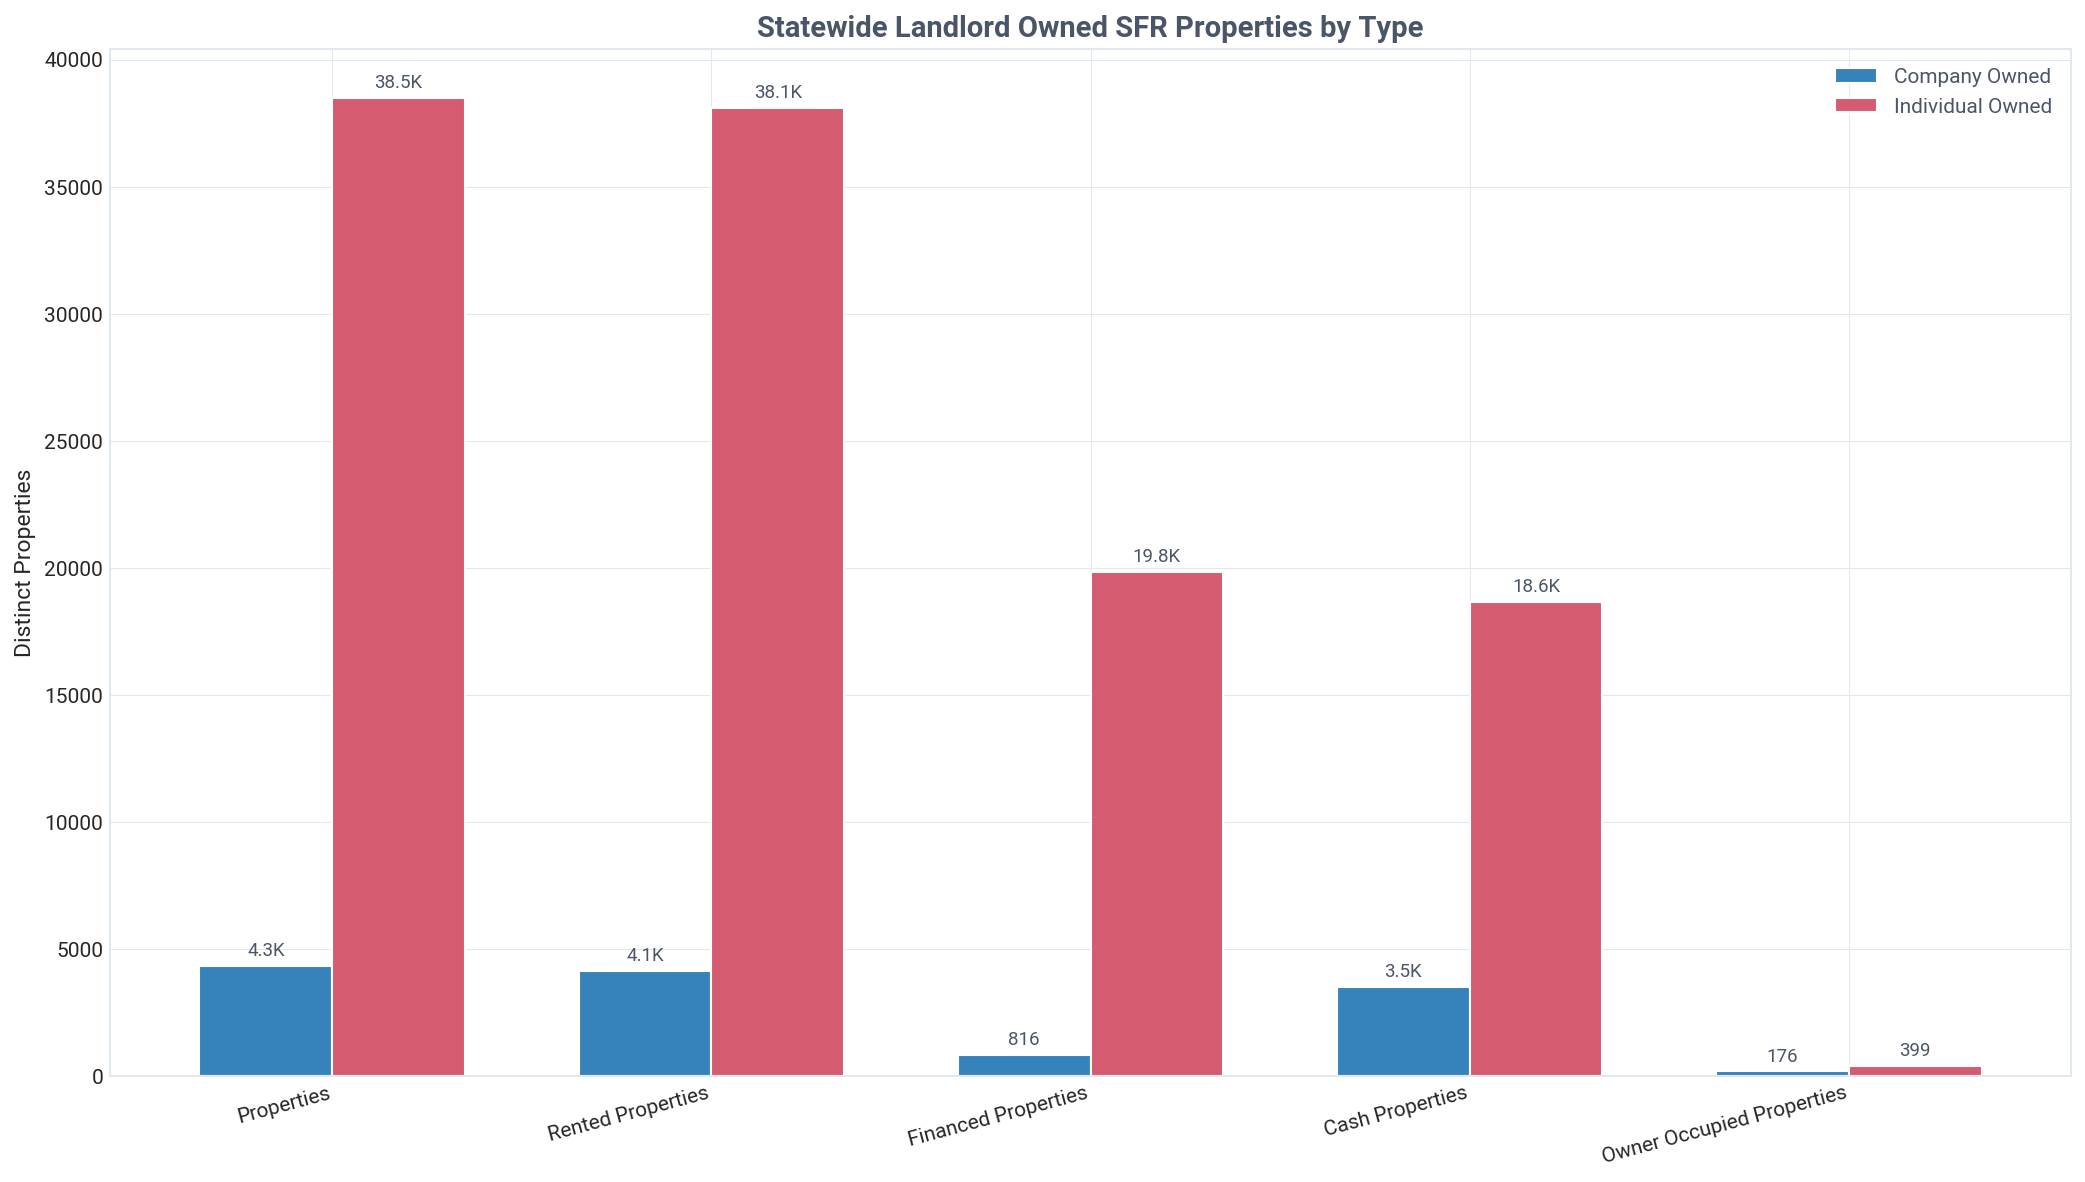
Investors own 42,007 SFRs in Alaska, with individual landlords holding 91.6% of the portfolio.
The investor portfolio is almost evenly split between cash and financed properties, with 21,546 homes owned outright and 20,461 carrying a mortgage. An overwhelming 98.6% of these properties are non-owner-occupied, indicating a strong rental focus. There are 53,107 individual landlords compared to just 3,784 company landlords.
Landlord vs Traditional Homeowners
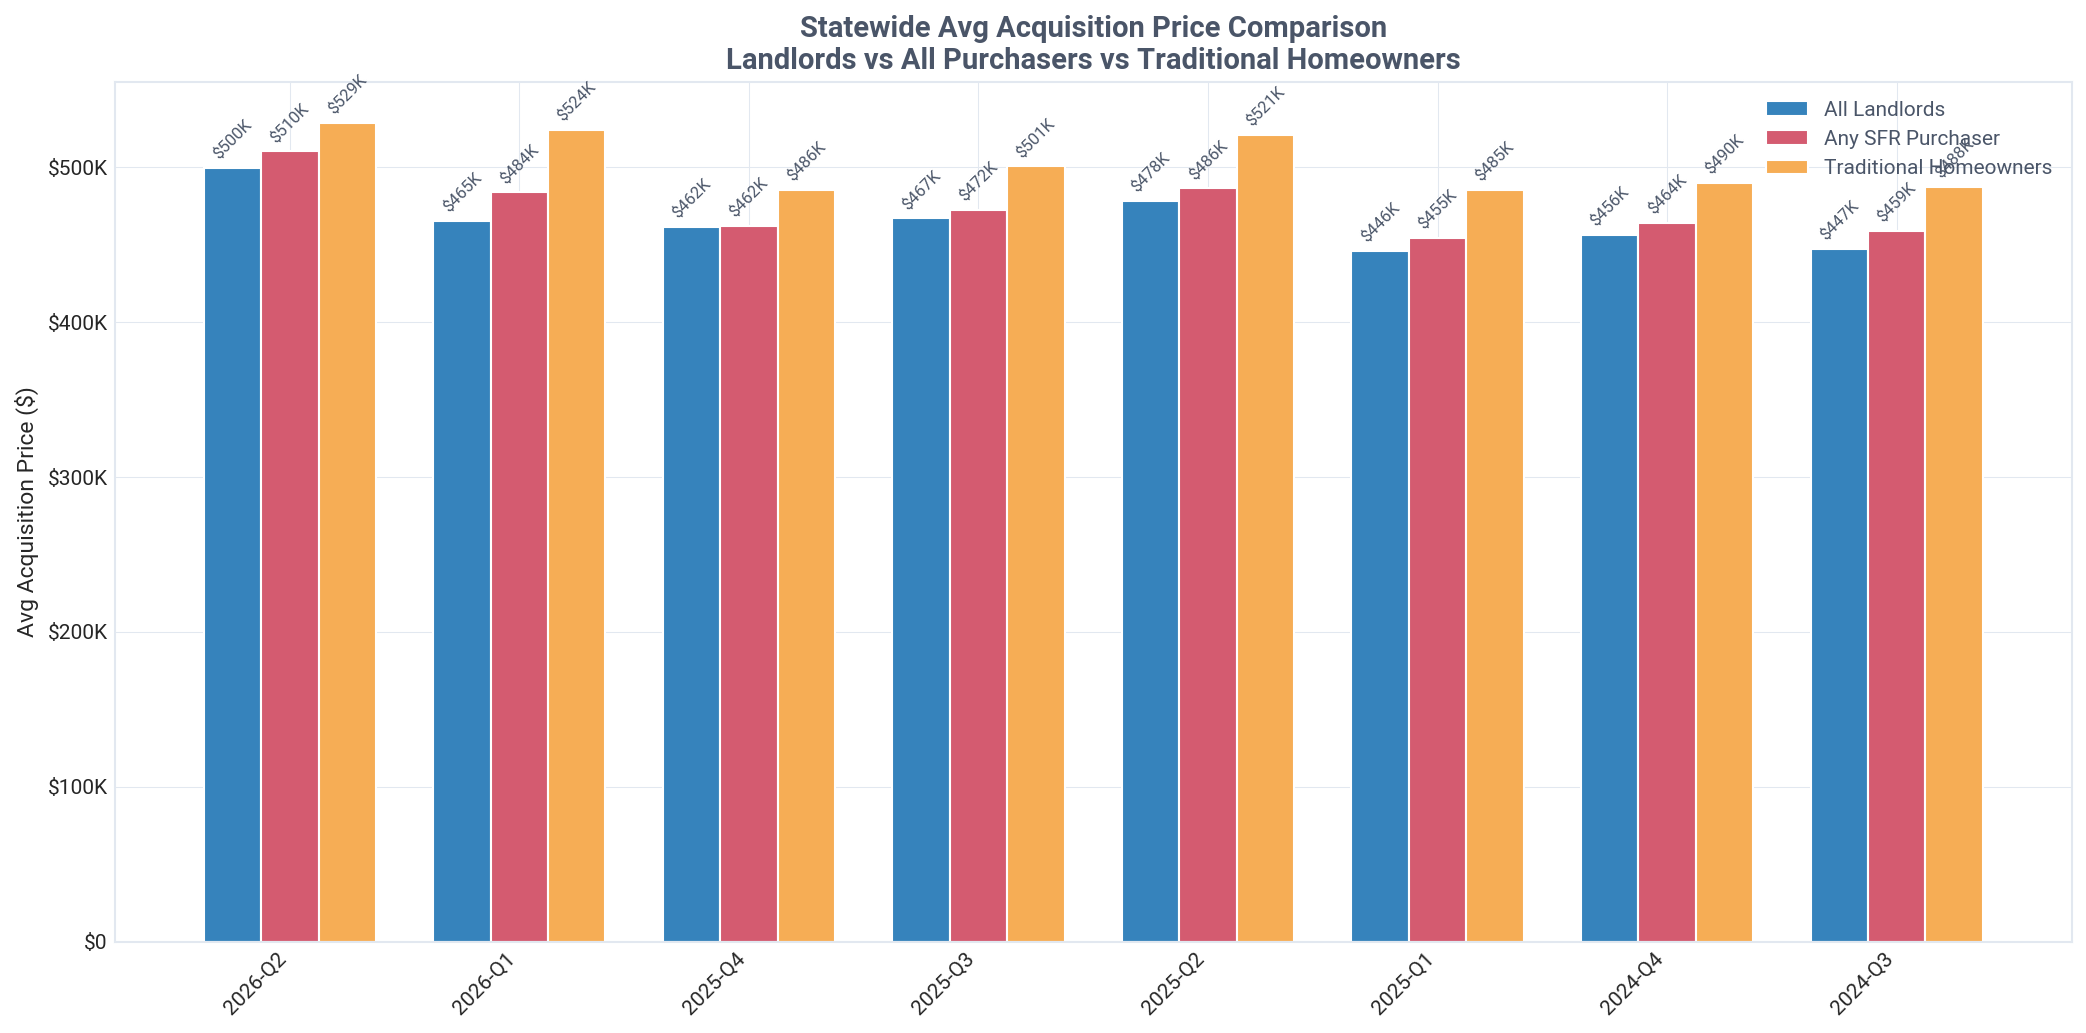
Landlords in Alaska paid 5.5% less than homeowners in Q2 2026, an average discount of $29,013.
The price gap between landlords and homeowners has narrowed significantly from Q1 2026, when landlords enjoyed a much larger 11.3% discount ($59,225). Since the 2020-2023 period, the average landlord acquisition price has surged 35.7% from $368,430 to $499,870 in Q2 2026.
Current Quarter Purchases
Landlords acquired 29.4% of all single-family homes sold in Alaska during Q2 2026.
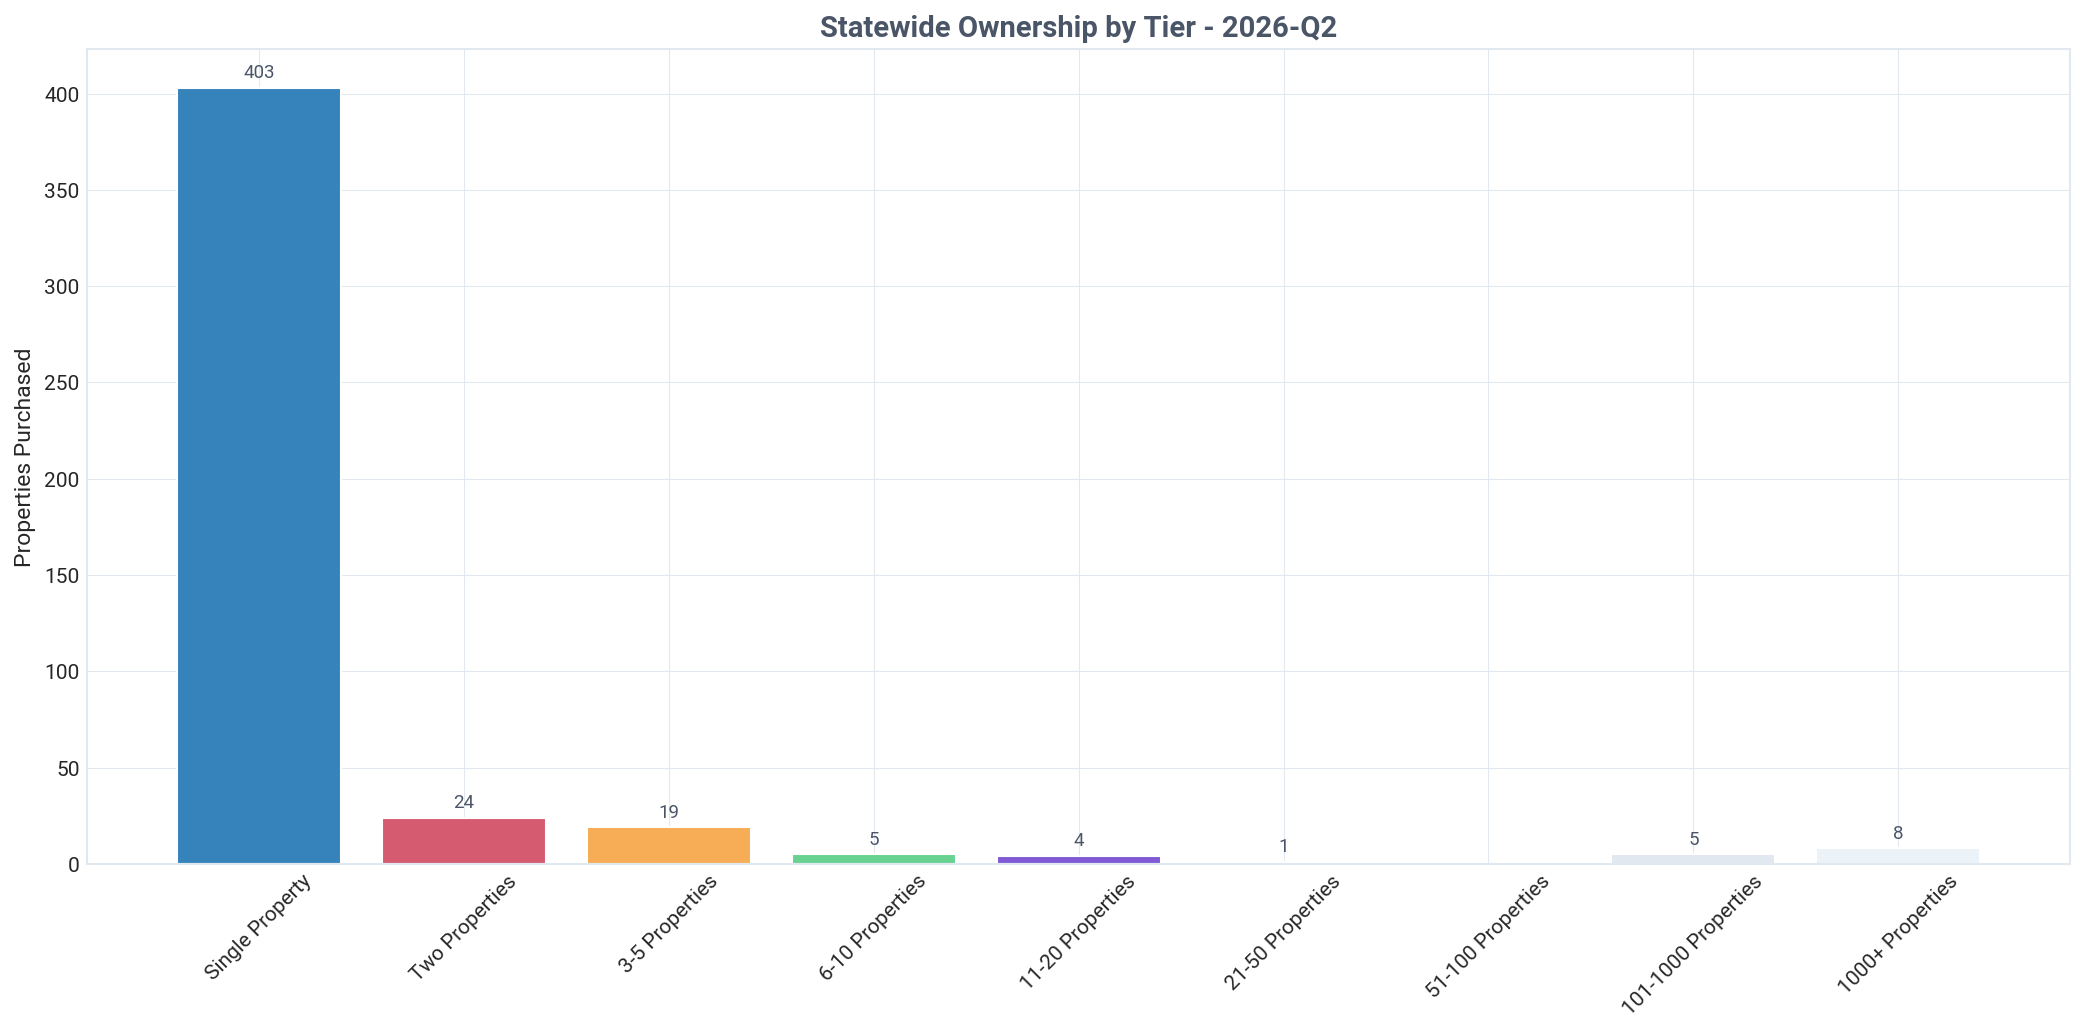
Mom-and-pop landlords were responsible for 96.2% of all investor purchases this quarter, acquiring 451 properties. In stark contrast, institutional investors with over 1,000 properties purchased just 8 homes. The market saw an influx of 557 new single-property landlord entities.
Ownership by Tier
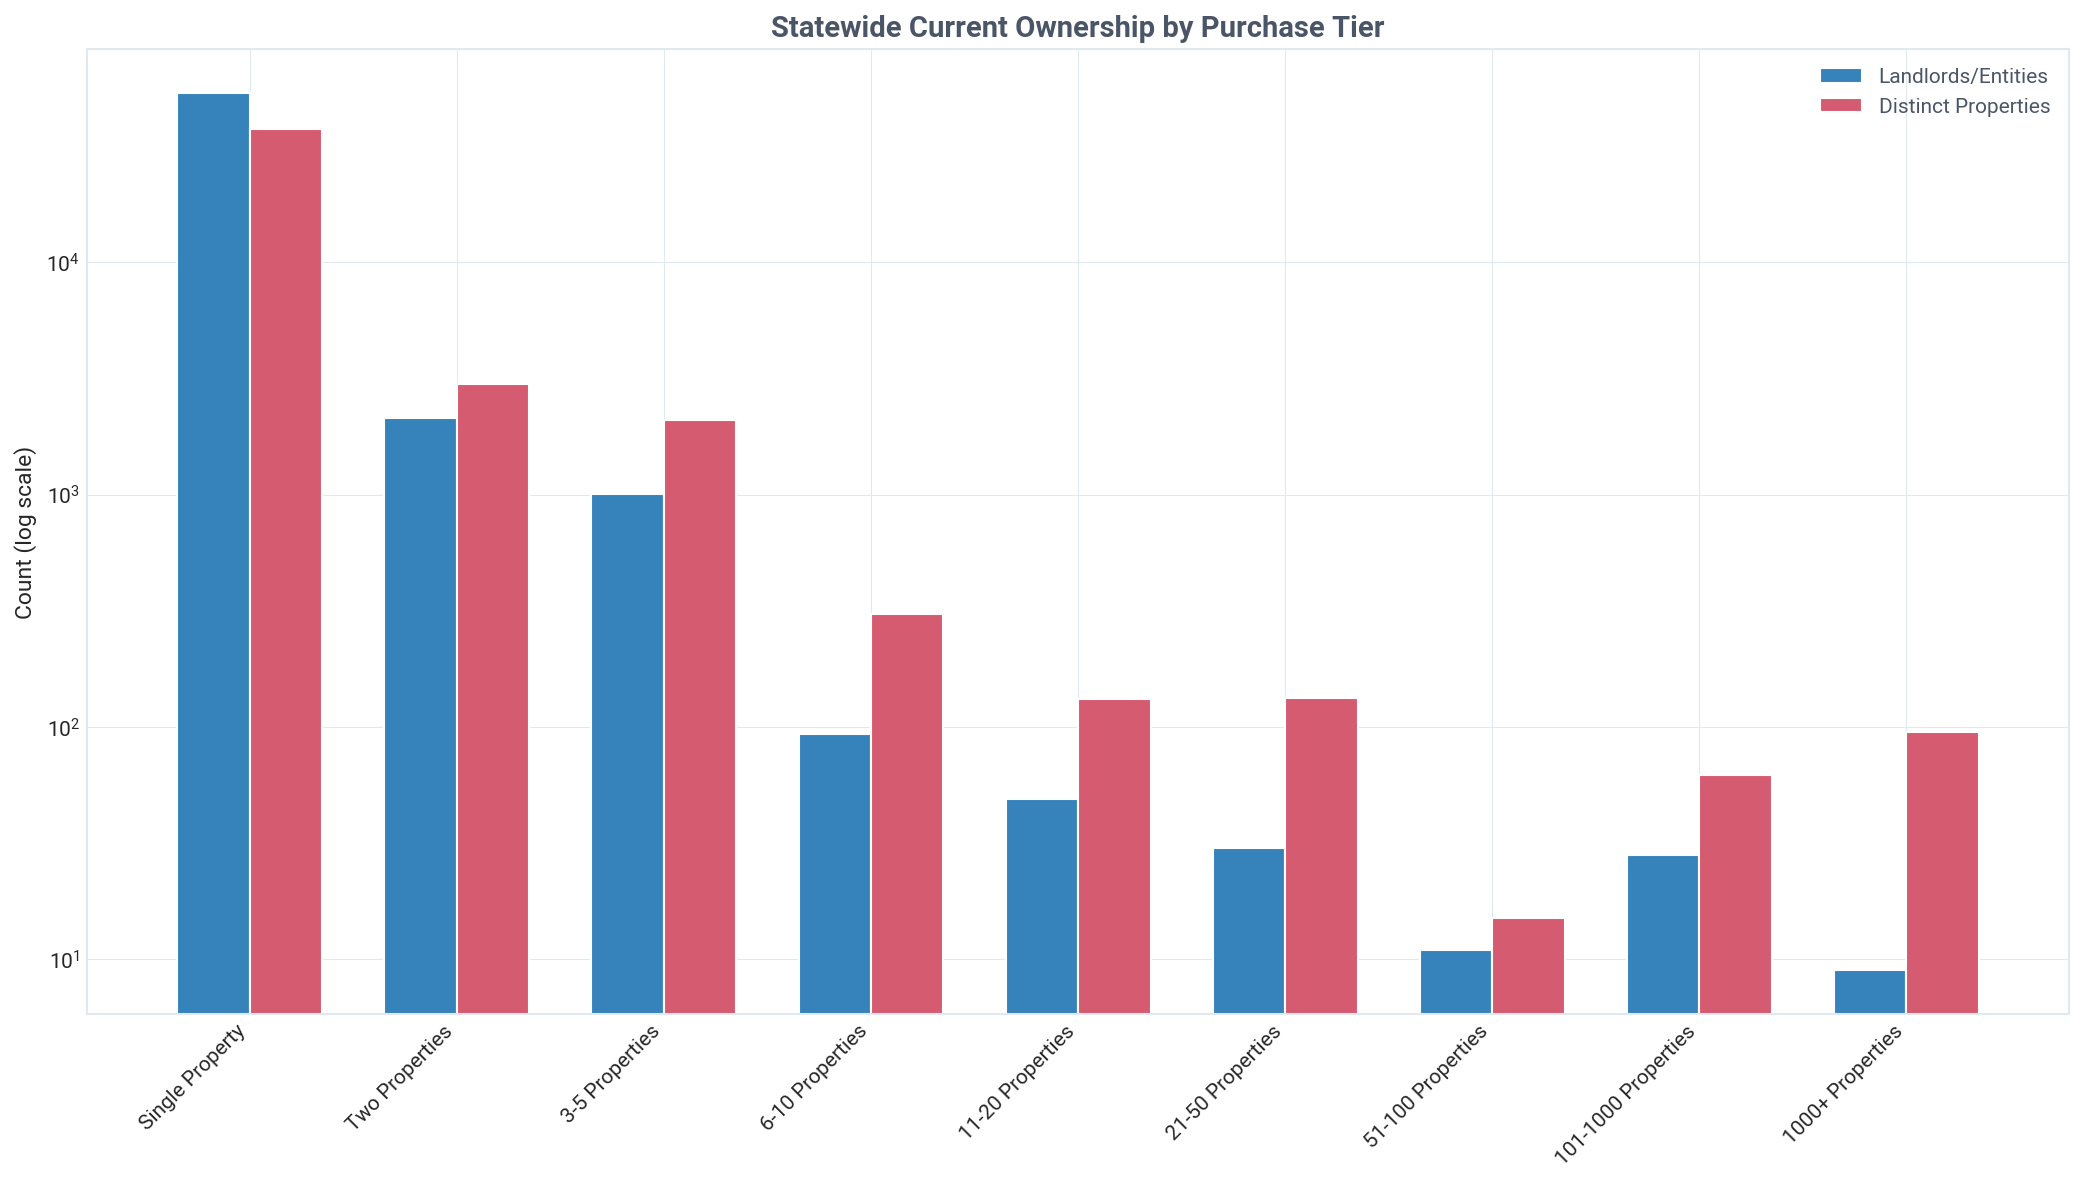
Mom-and-pop landlords control a staggering 99.0% of Alaska's investor-owned SFR housing.
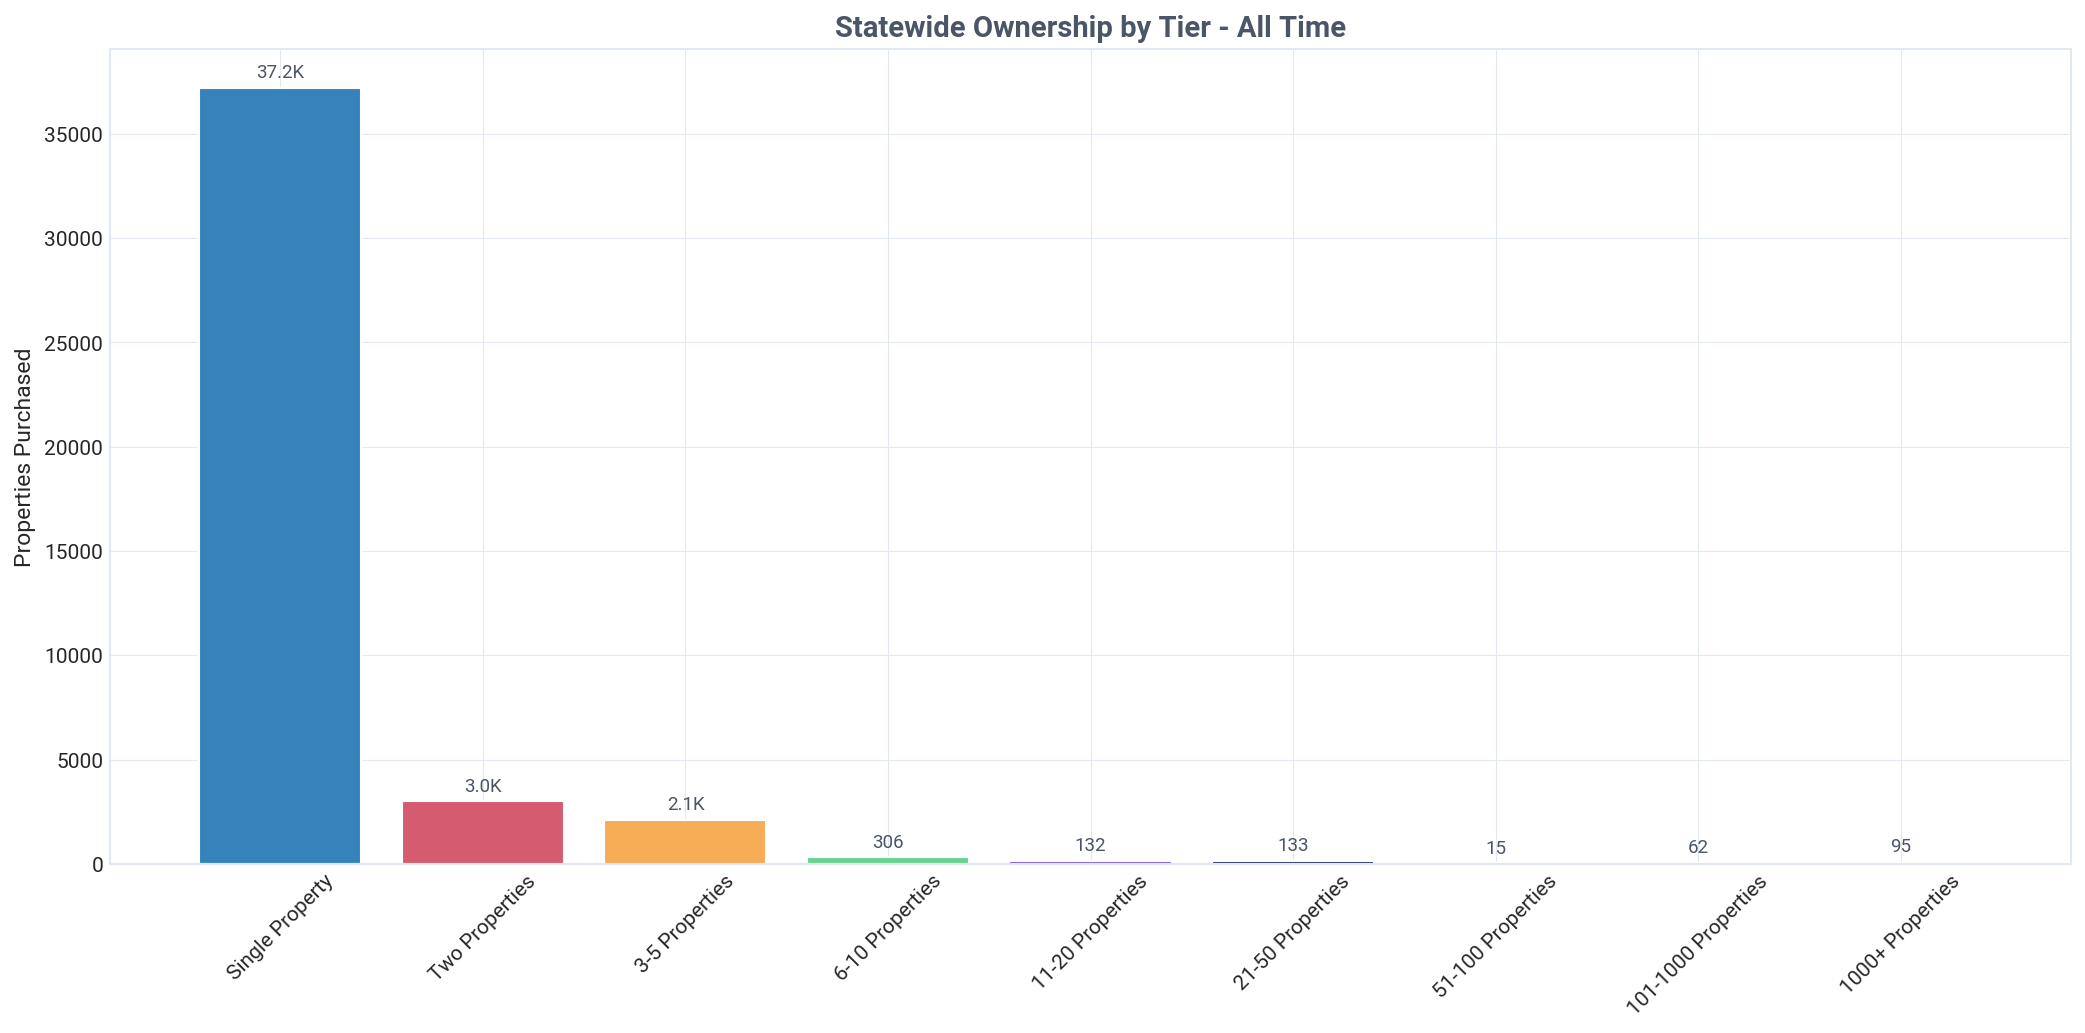
In contrast, institutional investors with portfolios of over 1,000 properties own just 0.2% of the total, or 95 homes. Single-property landlords alone make up the largest segment, holding 86.5% of all investor-owned properties (37,213 homes).
Ownership by Tier & Type
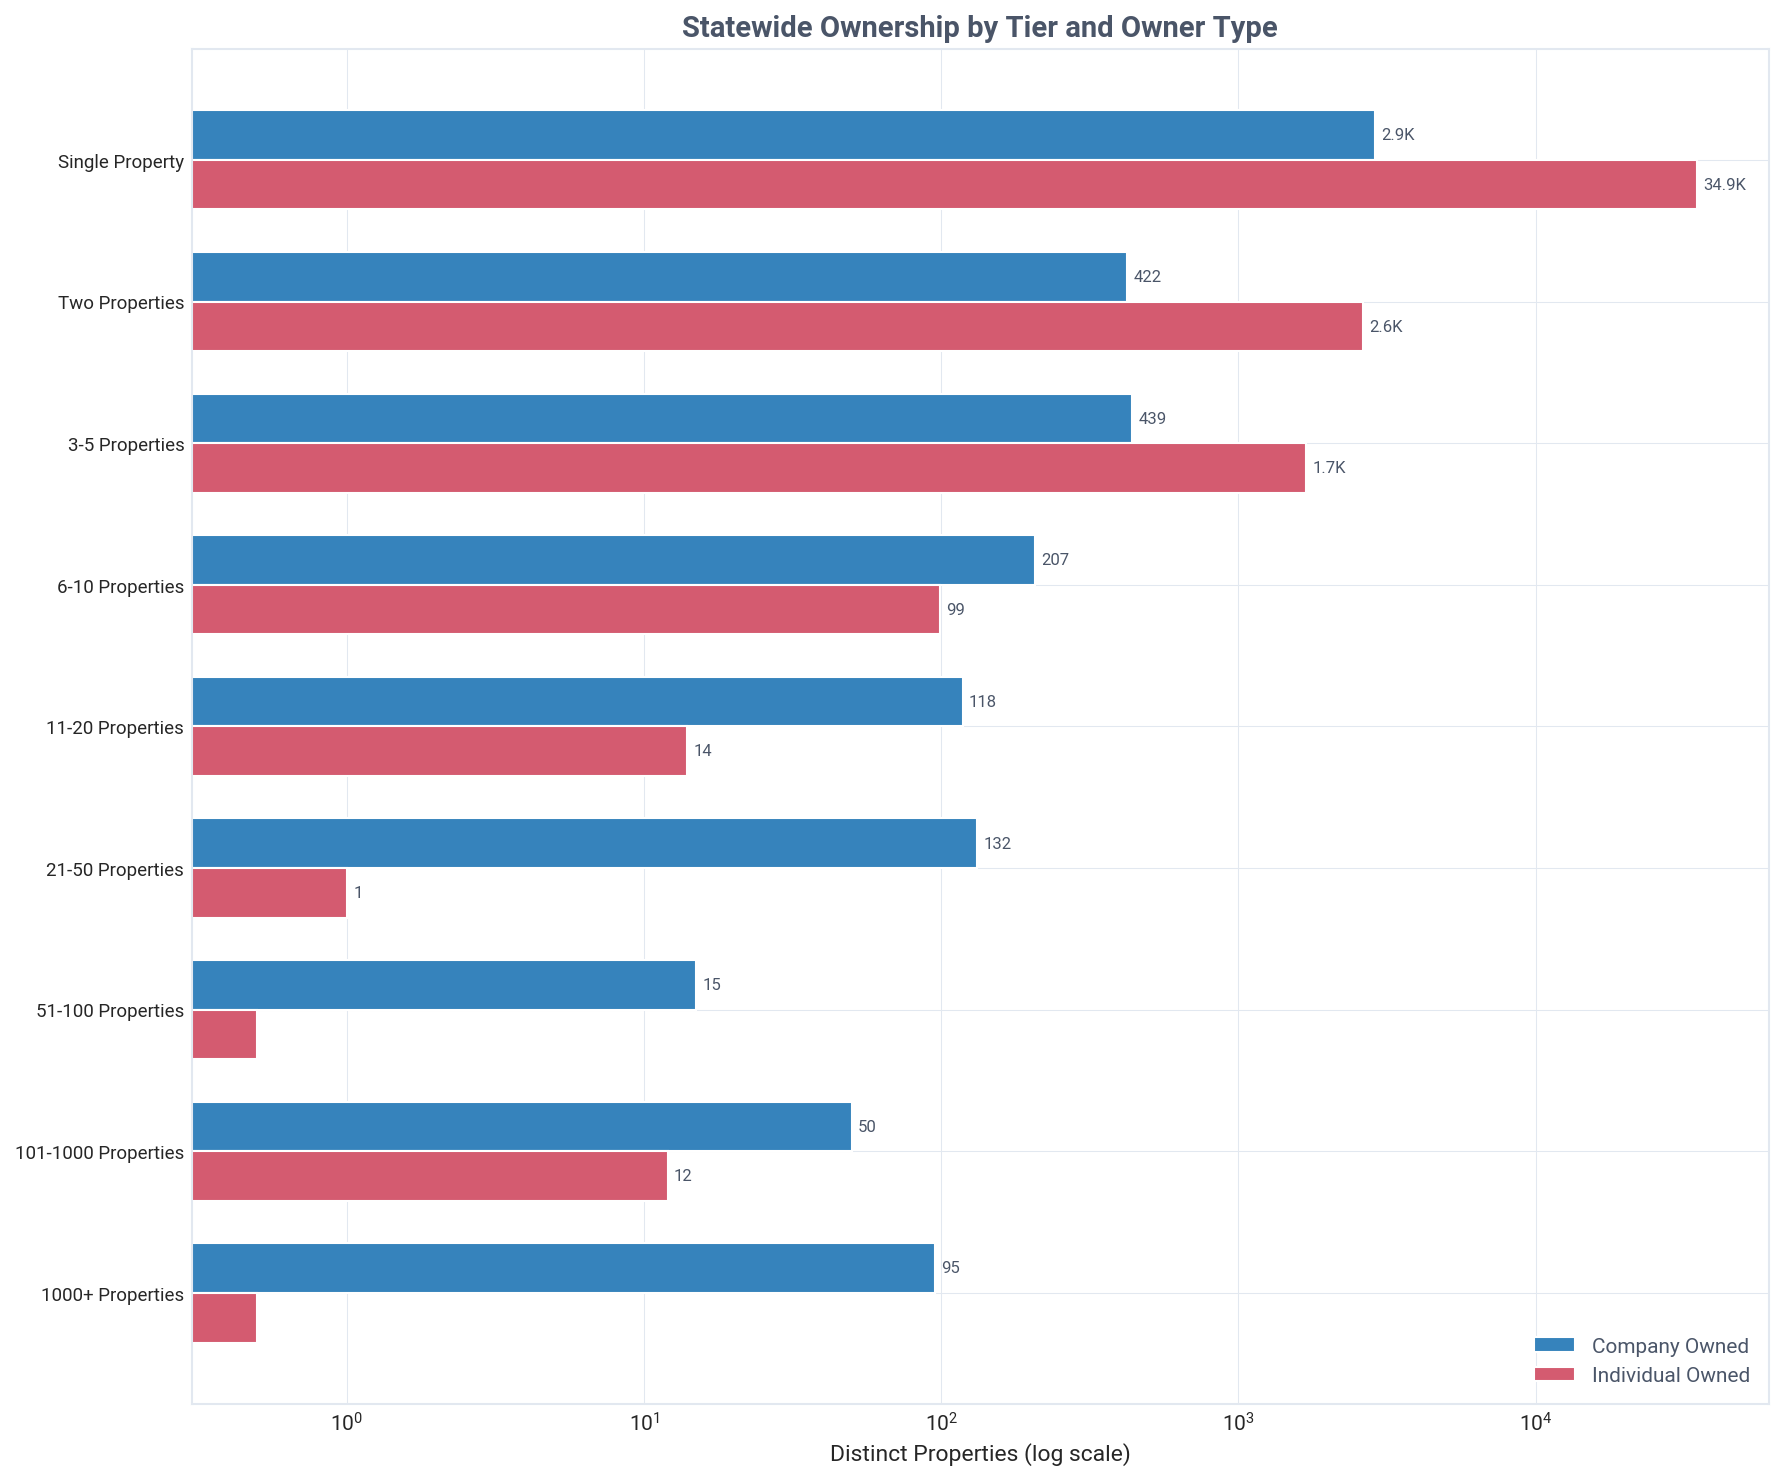
Companies become the majority owners at the 6-10 property tier, holding 67.6% of homes in that segment.
While individuals dominate smaller portfolios with 92.4% ownership in the single-property tier, companies control nearly all larger portfolios, owning 99.2% of homes in the 21-50 property tier. This marks a clear shift in ownership structure as portfolio size increases.
Geographic Distribution
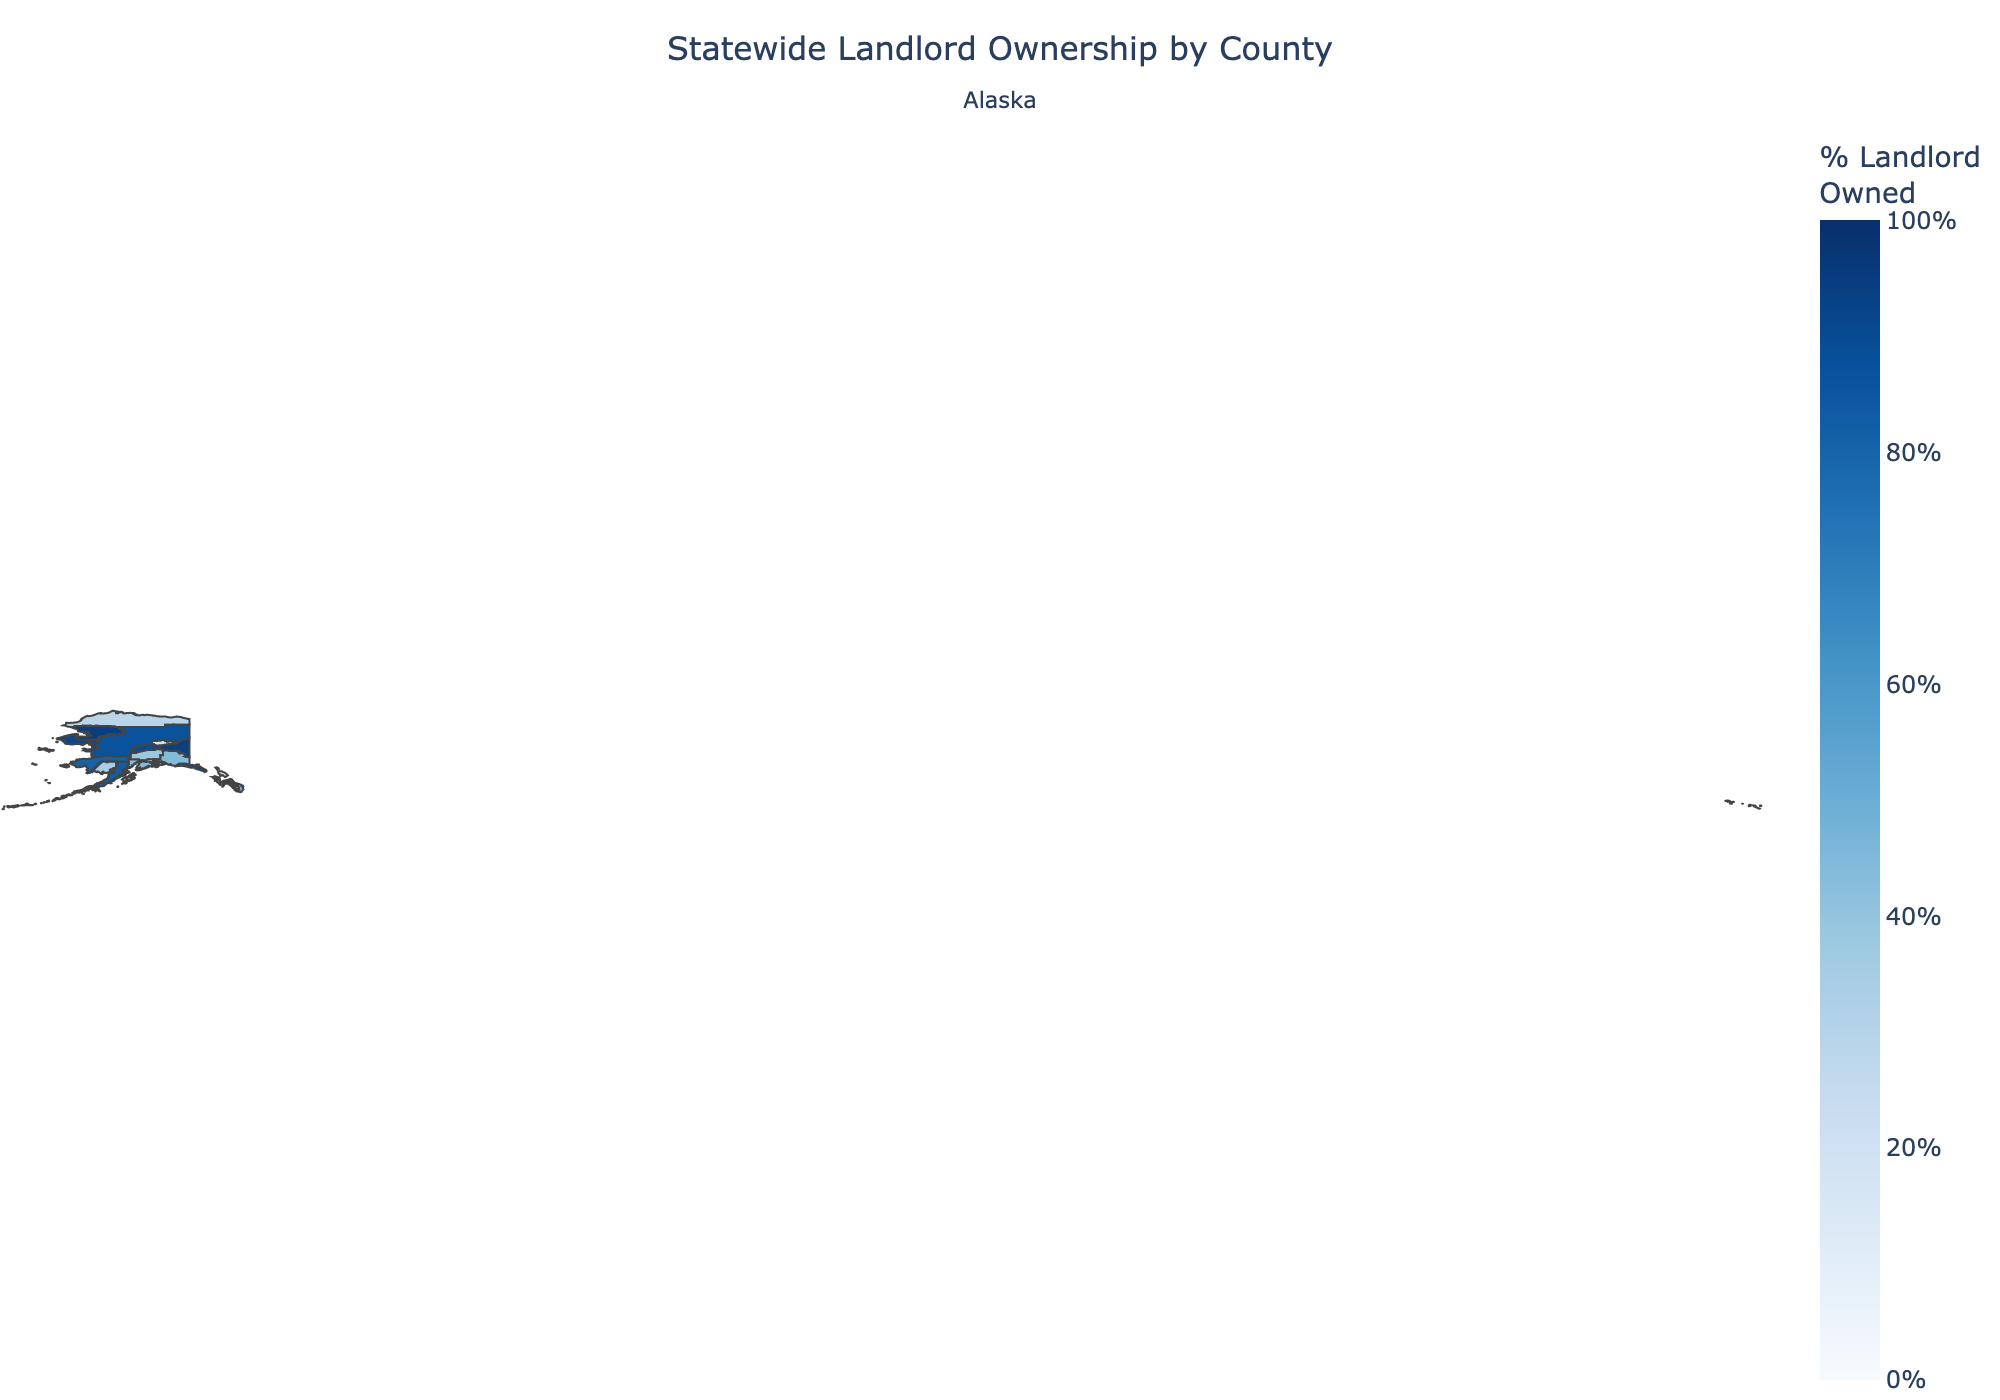
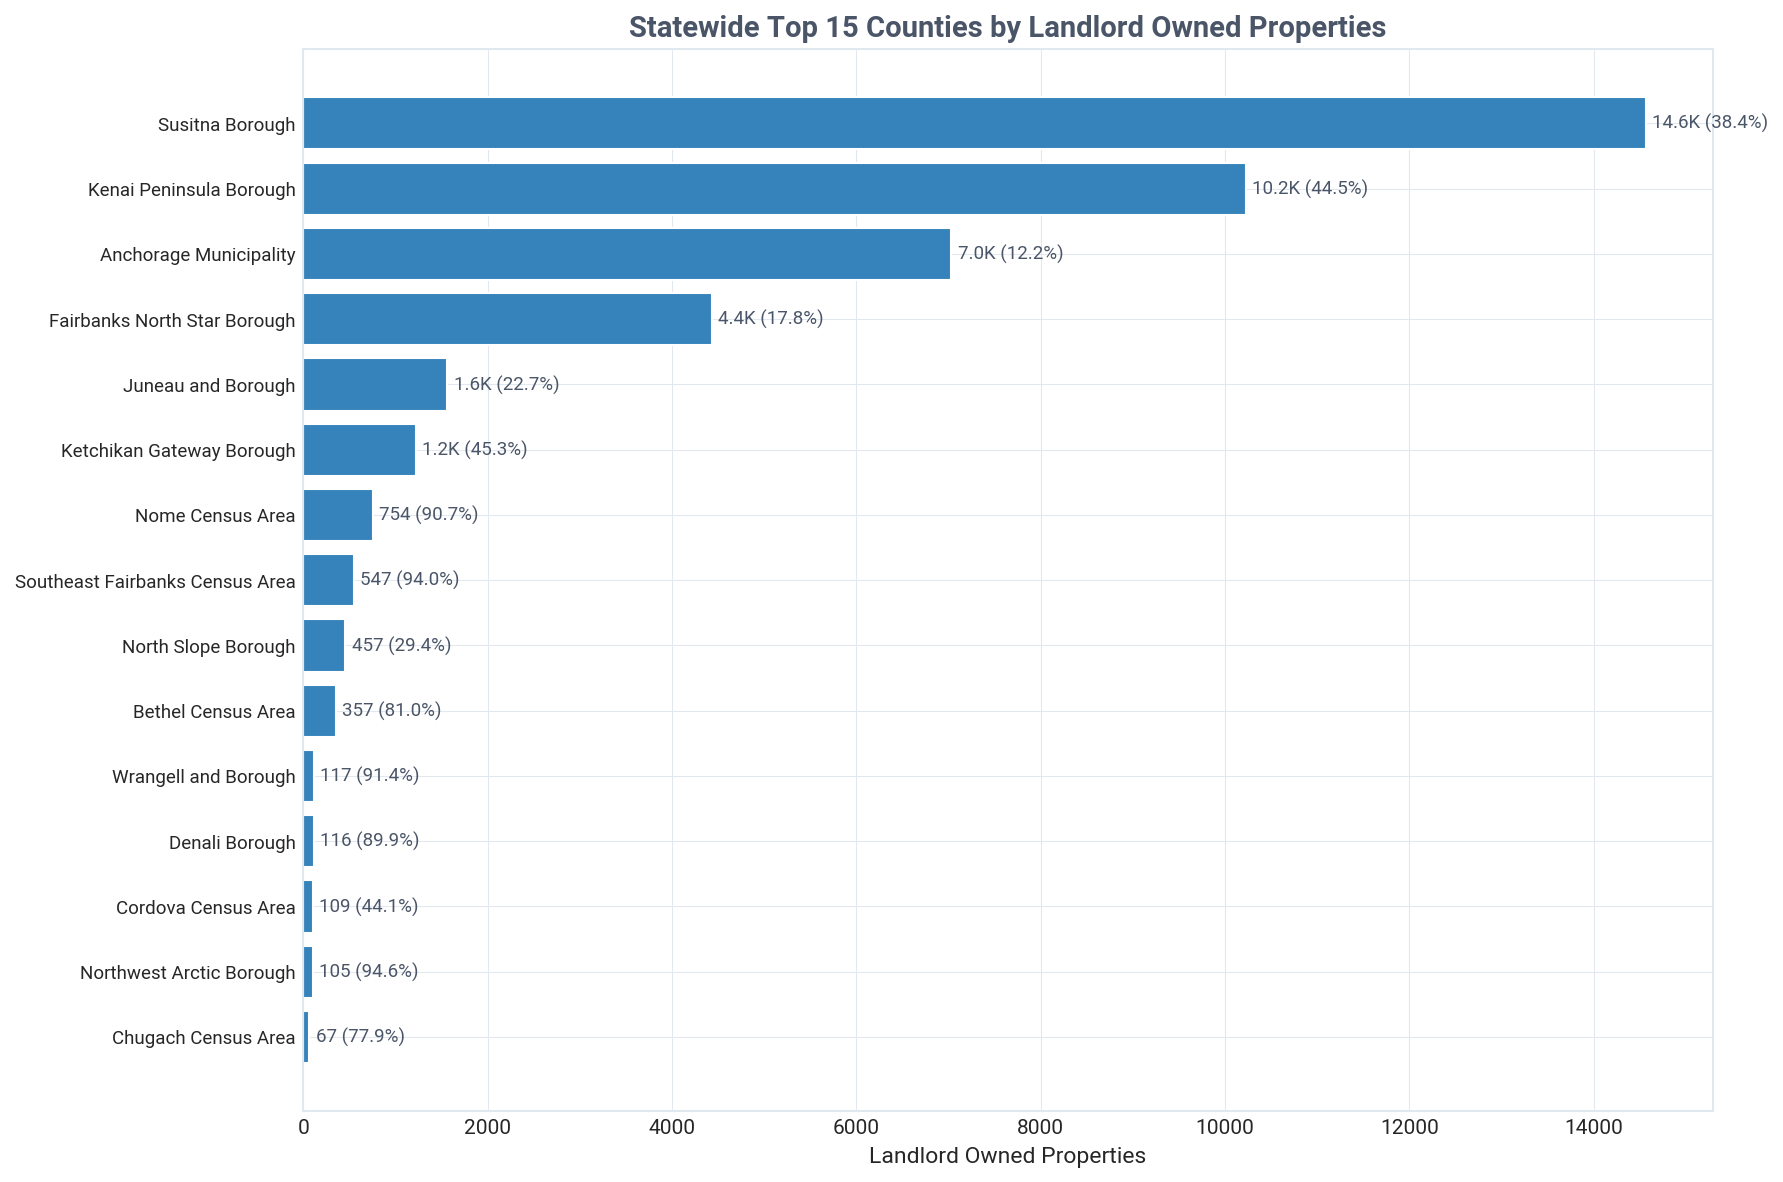
Matanuska-Susitna Borough is the epicenter of investor activity in Alaska, with 14,563 investor-owned properties.
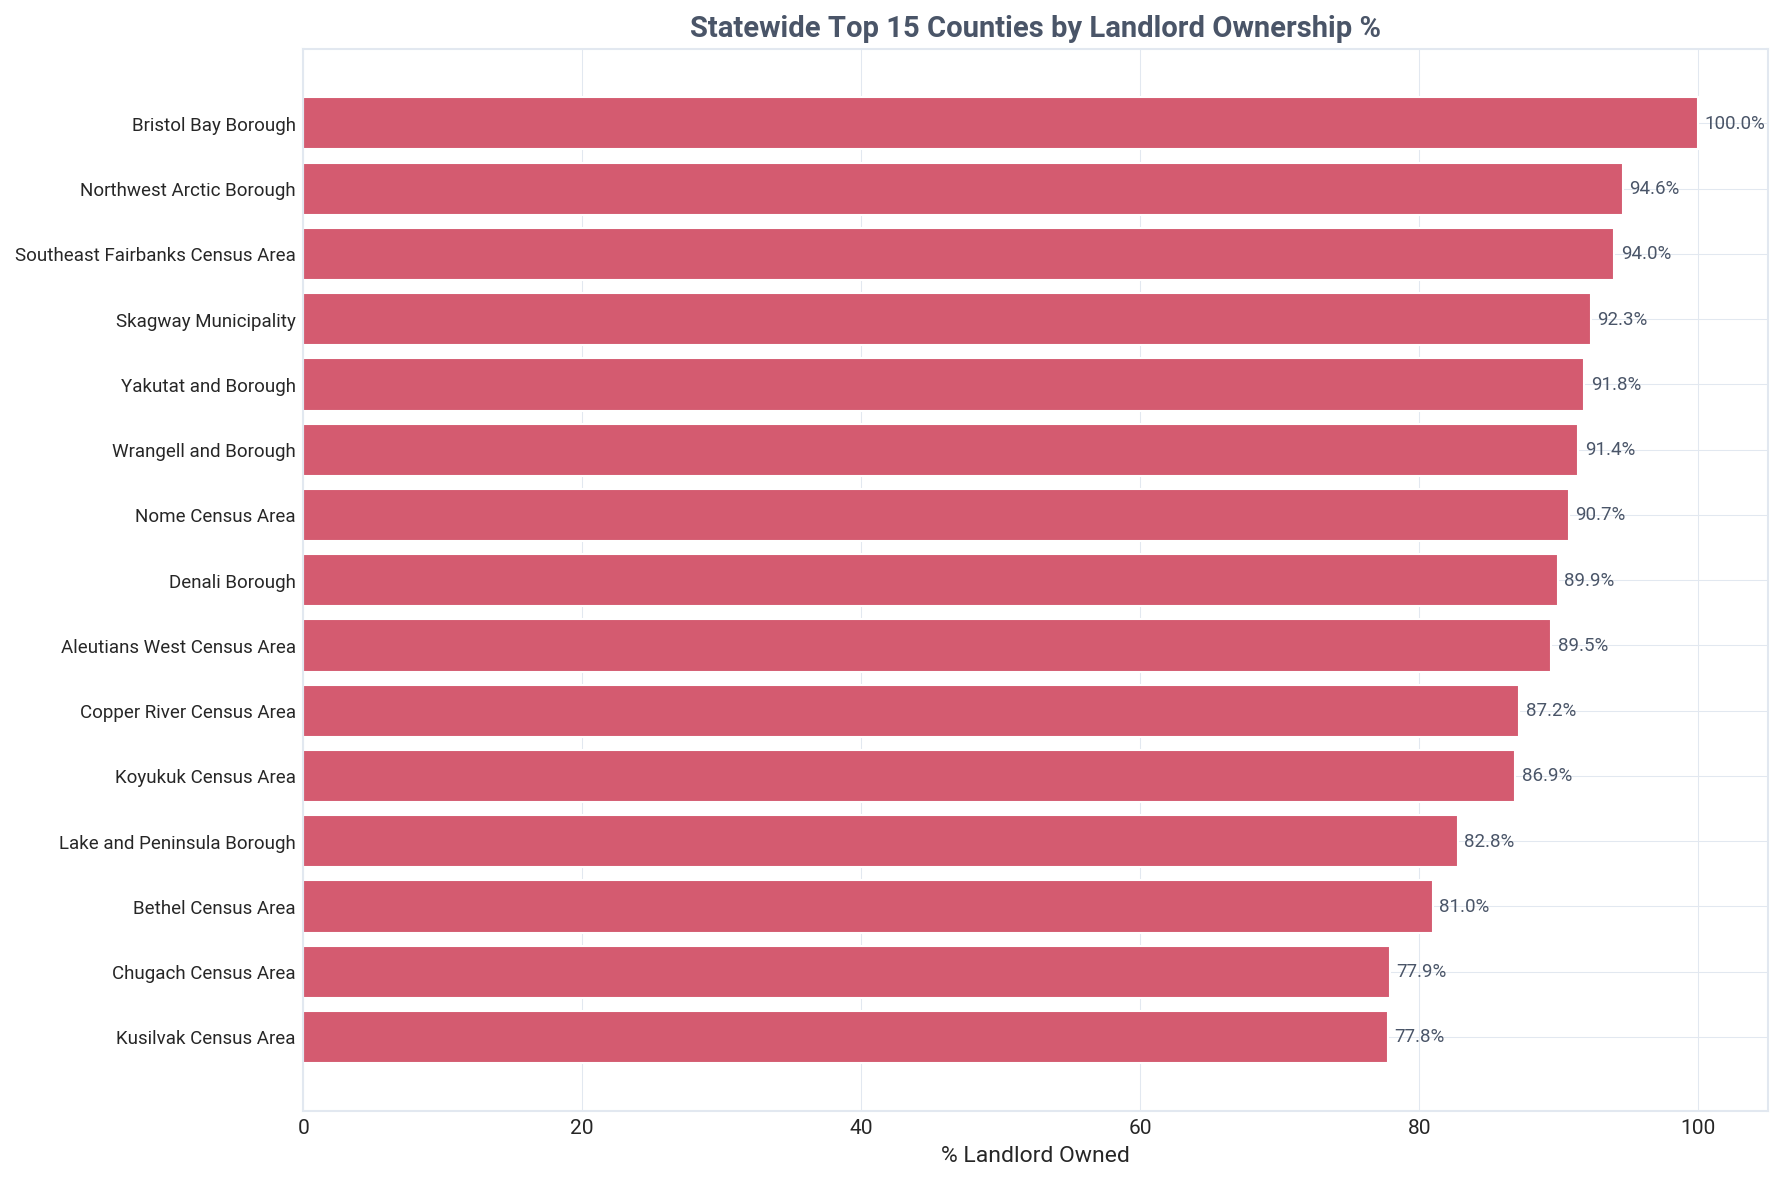
While Matanuska-Susitna leads by sheer volume, several smaller regions have extreme investor ownership rates, with Bristol Bay Borough at 100% and Northwest Arctic Borough at 94.6%. In contrast, Anchorage Municipality, a major population center, has a much lower investor ownership rate of 12.2%.
Historical Transactions
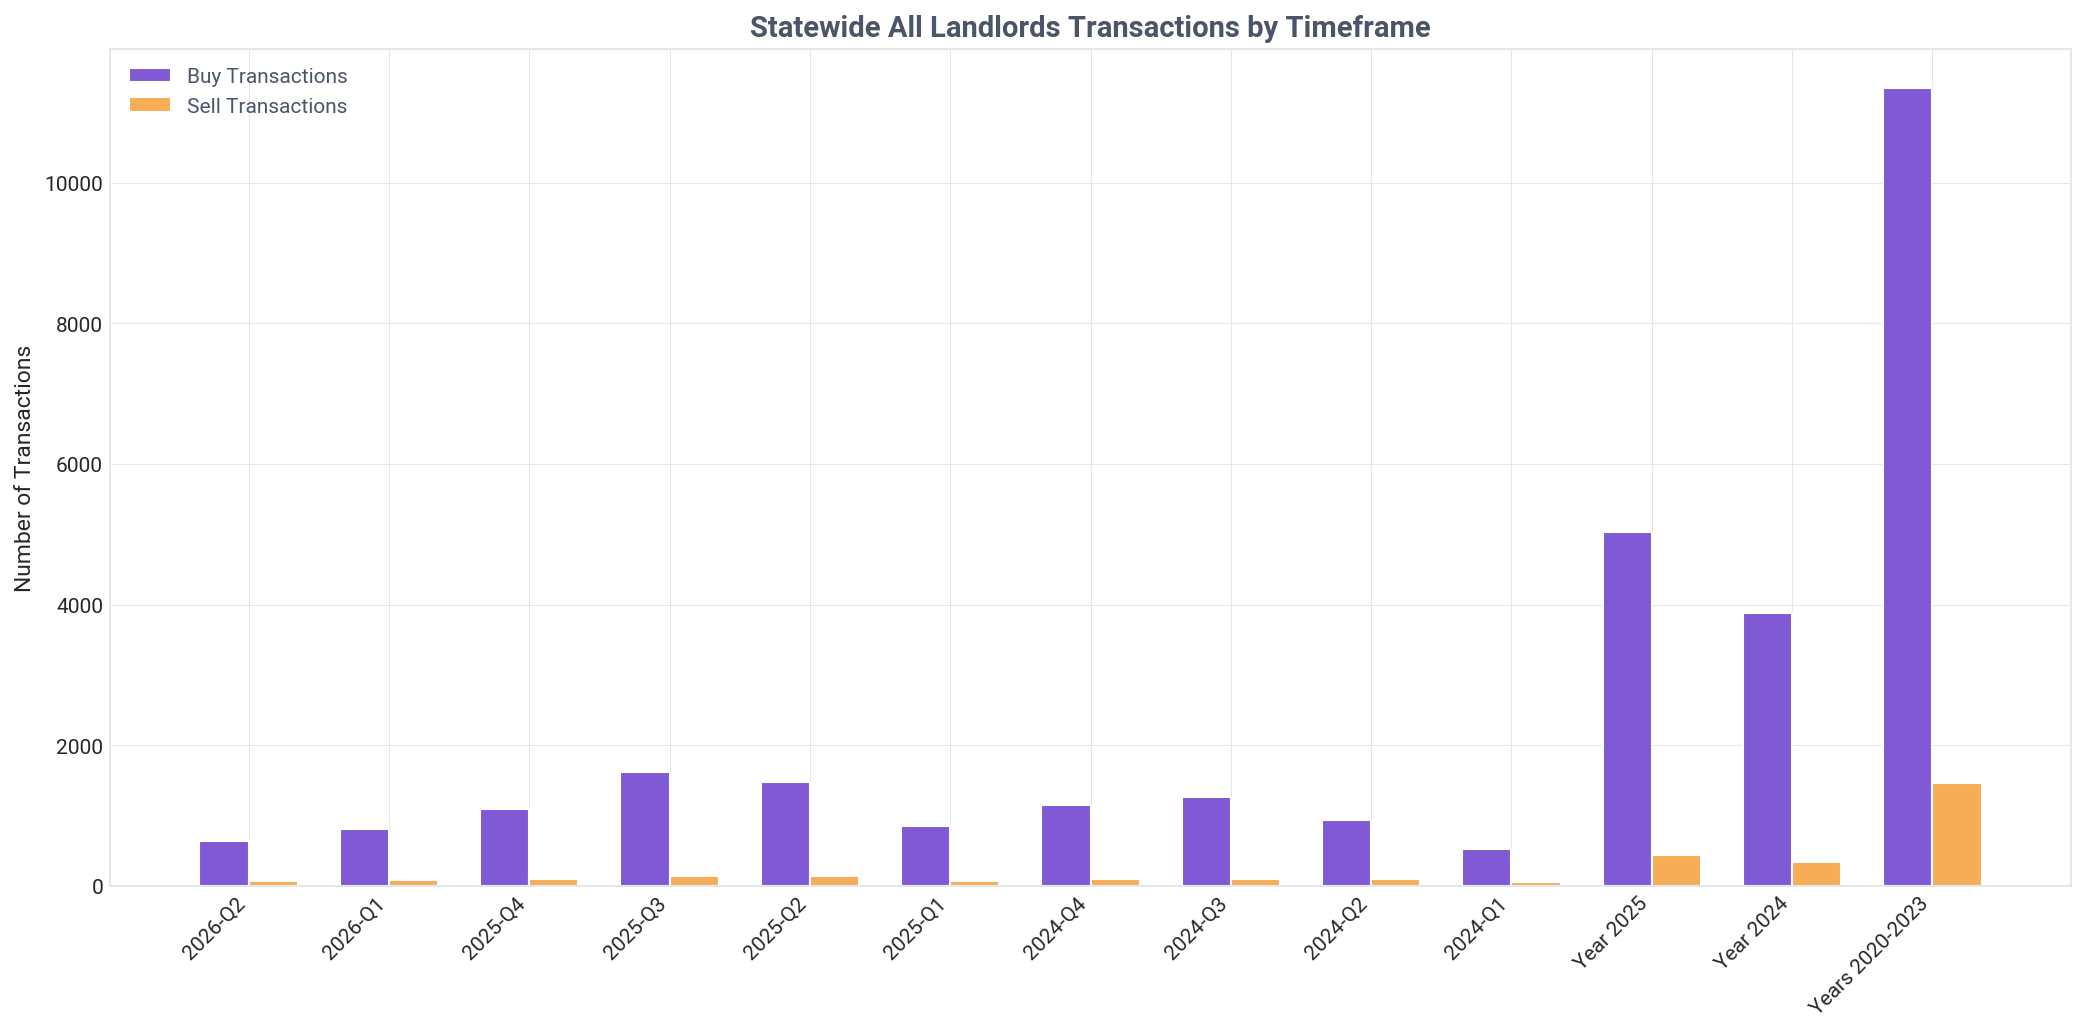
Alaska's landlords are aggressive net buyers, acquiring nearly 10 properties for every 1 they sold in Q2 2026.
This strong accumulation trend is consistent over time, with landlords maintaining a net buyer position every quarter and year on record. In Q2 2026, landlords bought 635 properties while selling only 64. Even institutional investors were net buyers, though on a much smaller scale, adding 2 properties to their portfolios (11 buys vs. 9 sells).
Current Quarter Transactions
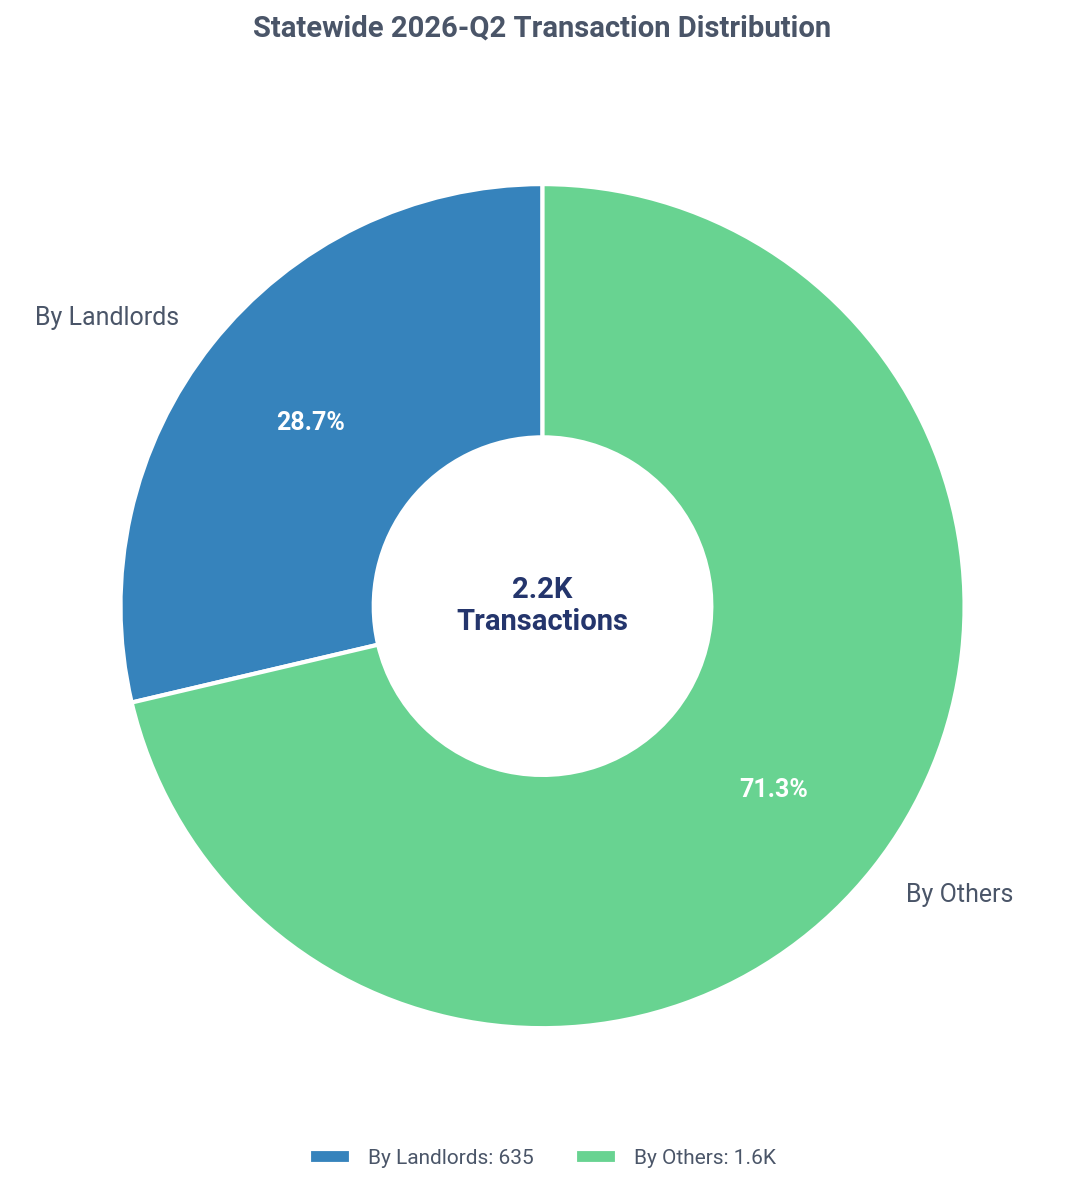
Investors were involved in 28.7% of all real estate transactions in Alaska during Q2 2026.
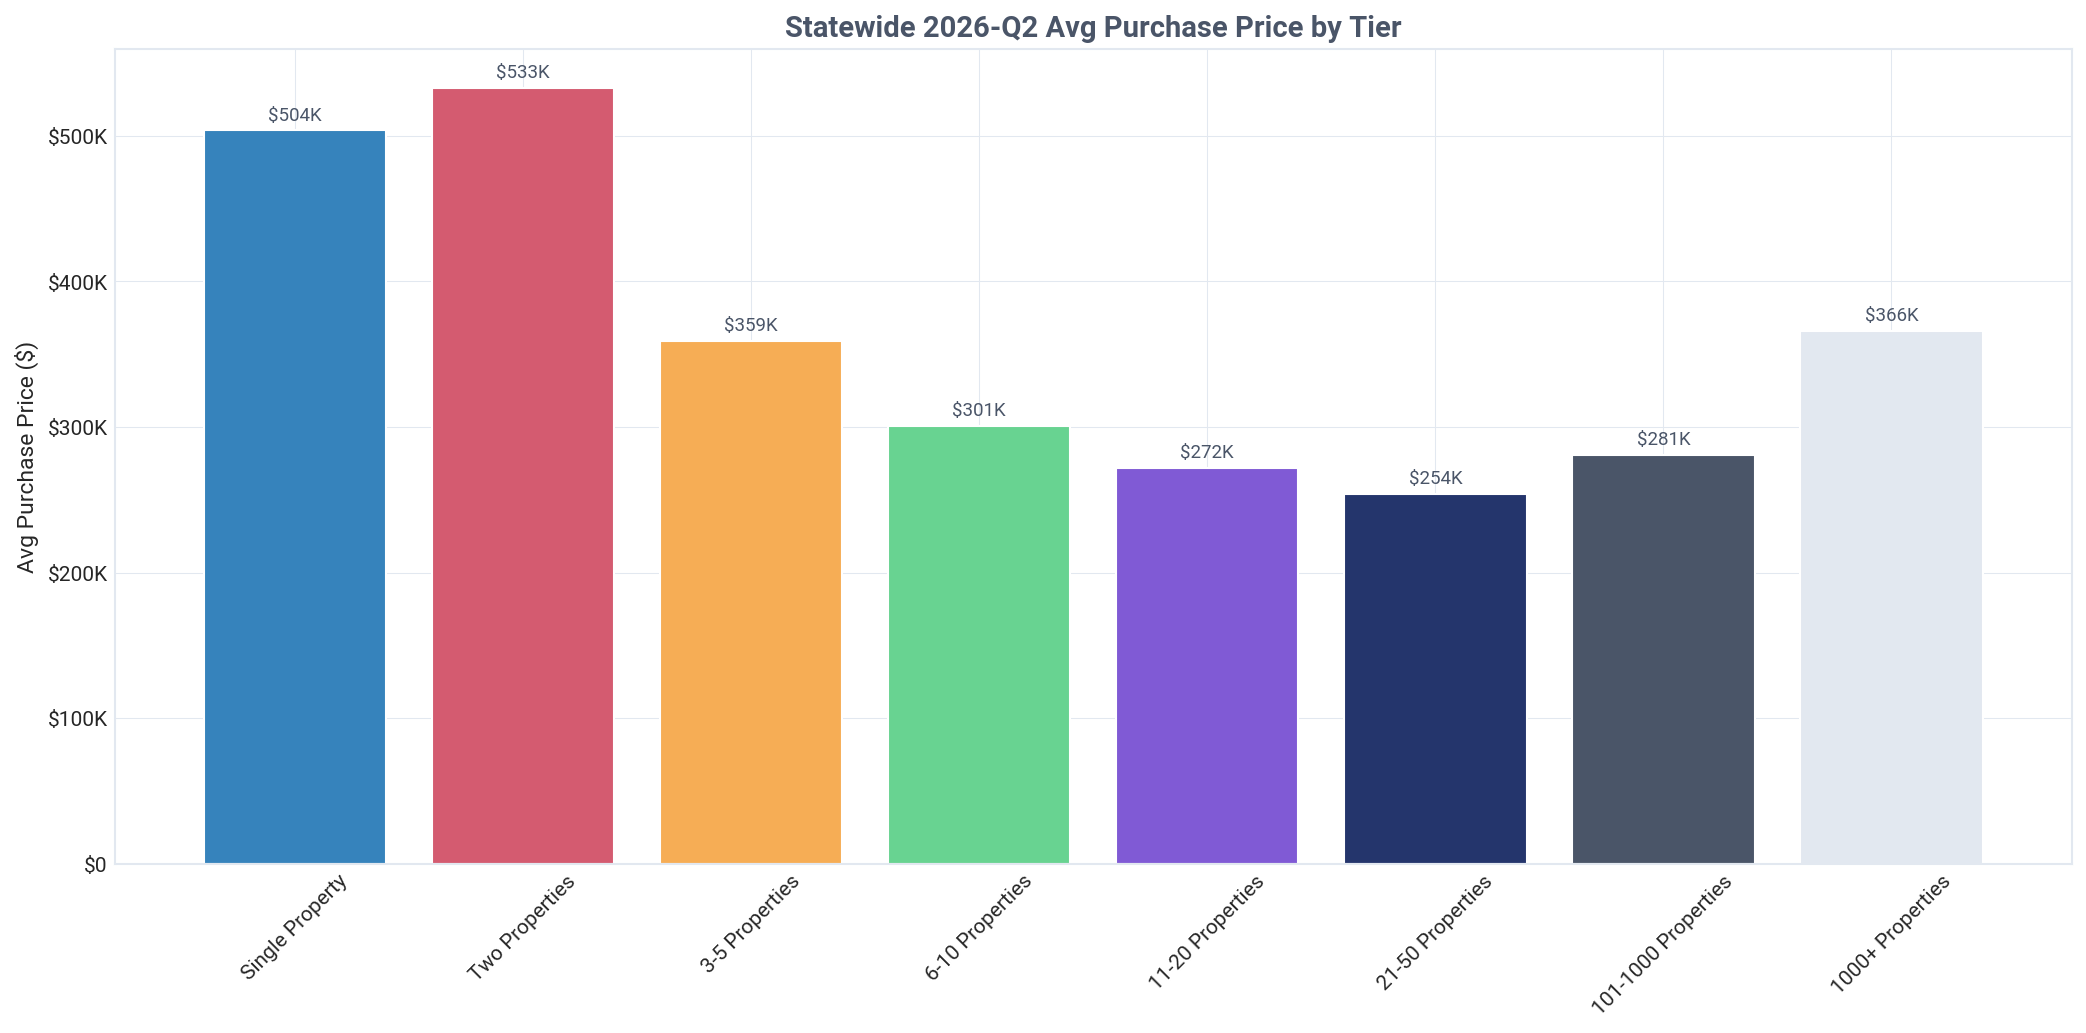
A significant price disparity exists between buyer tiers: new single-property landlords paid the most at $503,793, while institutional investors paid 27.3% less at $366,021. Institutional buyers also sourced the majority of their deals (54.5%) from other landlords, a strategy not used by new entrants (3.2%).

Want deeper insights tailored to your investment strategy?

TALK TO AN EXPERT

Current Holdings Portfolio

Analysis of landlord property holdings by type, financing method, and owner category

Alaska: landlord SFR holdings by type, Q2 2026
Key Insight
Investors own 42,007 SFRs in Alaska, with individual landlords holding 91.6% of the portfolio.
Detailed Findings

In Alaska, real estate investors own 42,007 single-family residential properties, accounting for a significant 26.7% of the state's total SFR market of 157,592 homes. This high penetration rate highlights the critical role investors play in the state's housing ecosystem, particularly in providing rental options.

The ownership structure is overwhelmingly skewed towards individuals rather than corporations. Individual investors control 38,488 properties, representing 91.6% of the investor-owned portfolio, while companies own the remaining 4,326 properties (10.3%). This trend is mirrored in the entity counts, with 53,107 individual landlords far outnumbering the 3,784 company landlords.

A deep dive into the portfolio composition shows a near-even split in financing methods. Investors hold 21,546 properties with no outstanding mortgage (cash-owned) and 20,461 properties that are financed. This balance suggests a mature market with both long-term holders who have paid off debt and newer investors leveraging capital for expansion.

The rental focus of this portfolio is exceptionally high. Of the 42,007 investor-owned properties, 41,436 are actively rented, making up 98.6% of all holdings. This demonstrates that the vast majority of investor activity in Alaska is geared towards providing long-term rental housing rather than short-term speculation or flipping.

The data clearly refutes the narrative of large corporations dominating the rental market in Alaska. Instead, it paints a picture of a landscape built and maintained by tens of thousands of small, individual landlords who form the backbone of the state's single-family rental supply.
Acquisition Timing & Pricing

Comparison of acquisition prices between landlords and traditional homeowners

Key Insight
Landlords in Alaska paid 5.5% less than homeowners in Q2 2026, an average discount of $29,013.
Detailed Findings

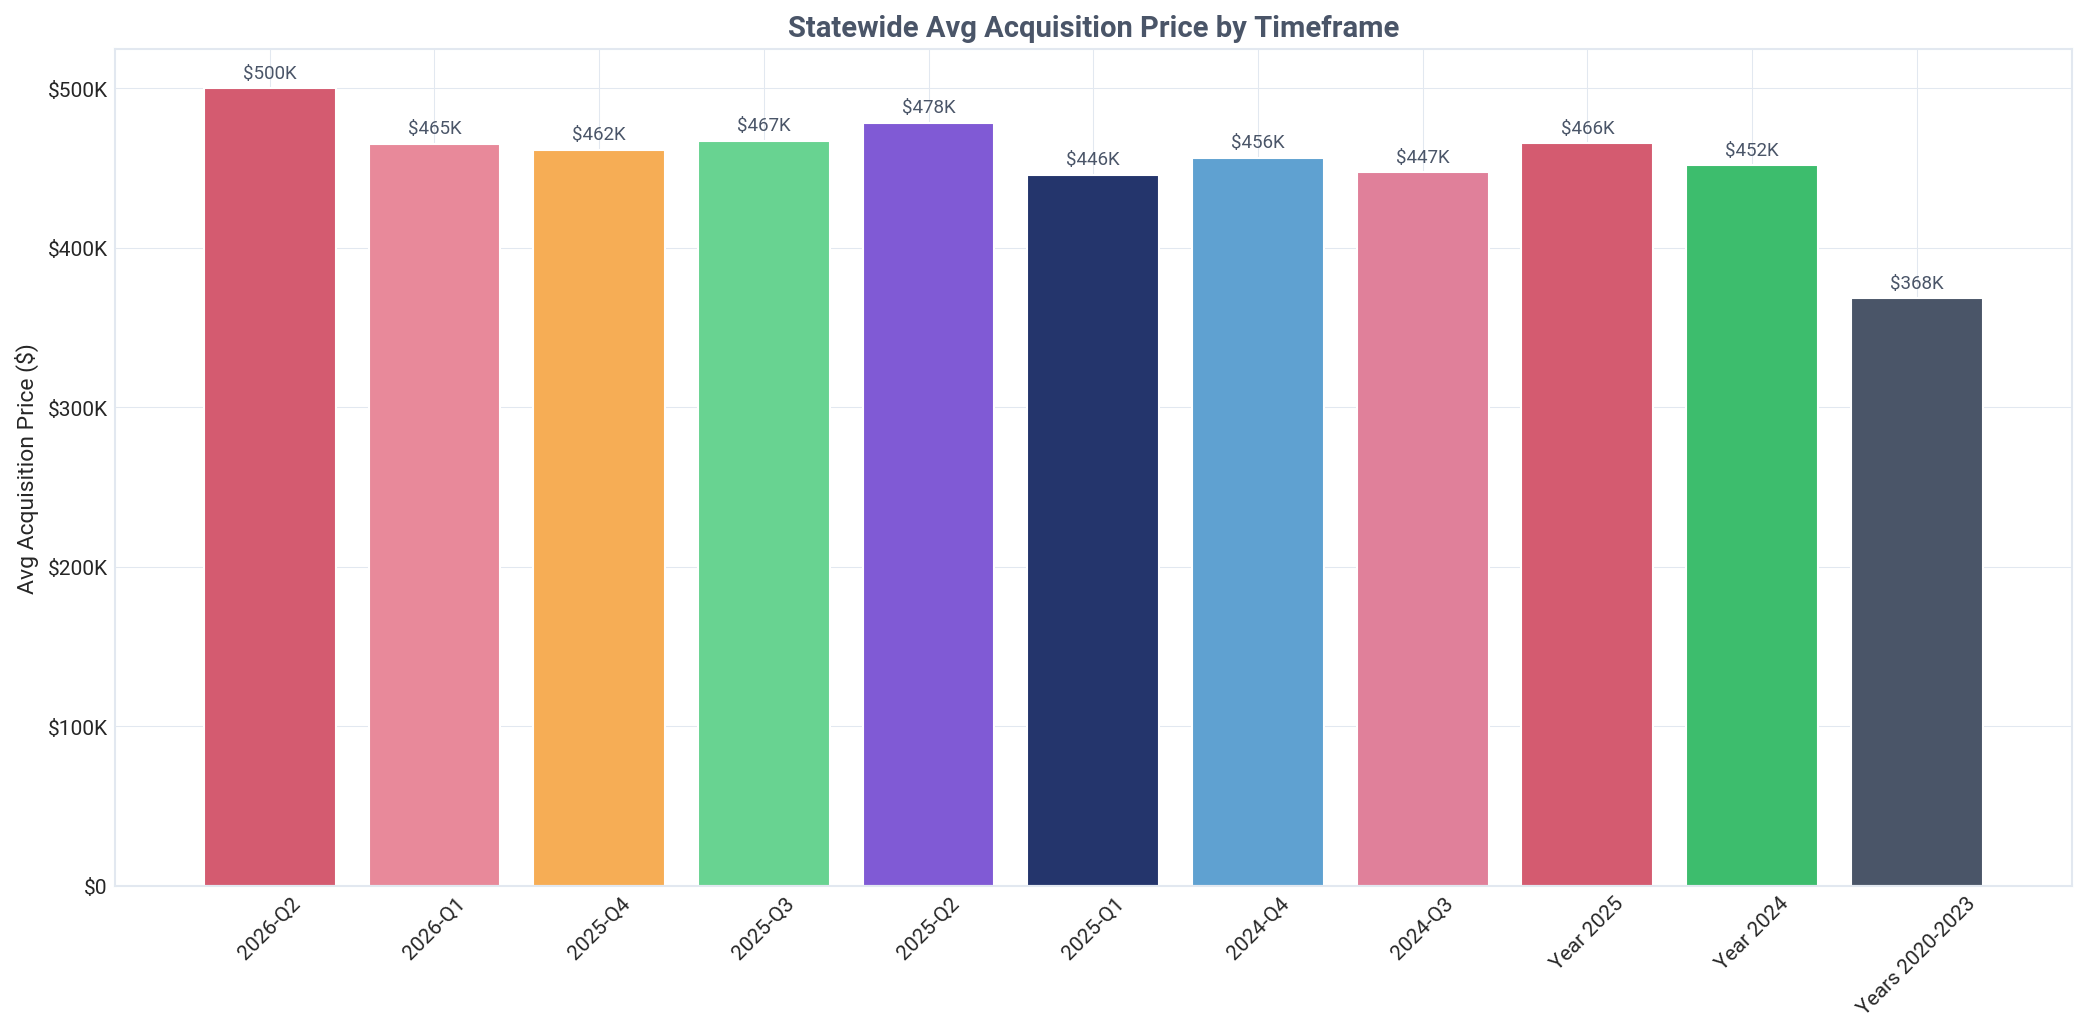
In Q2 2026, investors in Alaska demonstrated a distinct pricing advantage, acquiring properties for an average of $499,870. This was 5.5% less than the $528,883 paid by traditional homeowners, translating to a significant cash discount of $29,013 per property. This suggests investors are more adept at finding undervalued assets or negotiating favorable terms.

However, this pricing advantage appears to be shrinking. The 5.5% discount in Q2 2026 is a sharp reduction from the previous quarter, Q1 2026, when landlords secured properties for 11.3% less than homeowners, a gap of $59,225. This trend could signal increasing competition in the market, forcing investors to bid more aggressively.

The market has seen substantial price appreciation over the last few years. The average landlord acquisition price in Q2 2026 ($499,870) represents a 35.7% increase from the average of $368,430 during the 2020-2023 pandemic-era boom. This rapid rise in values highlights the strong returns for investors who acquired properties during that period.

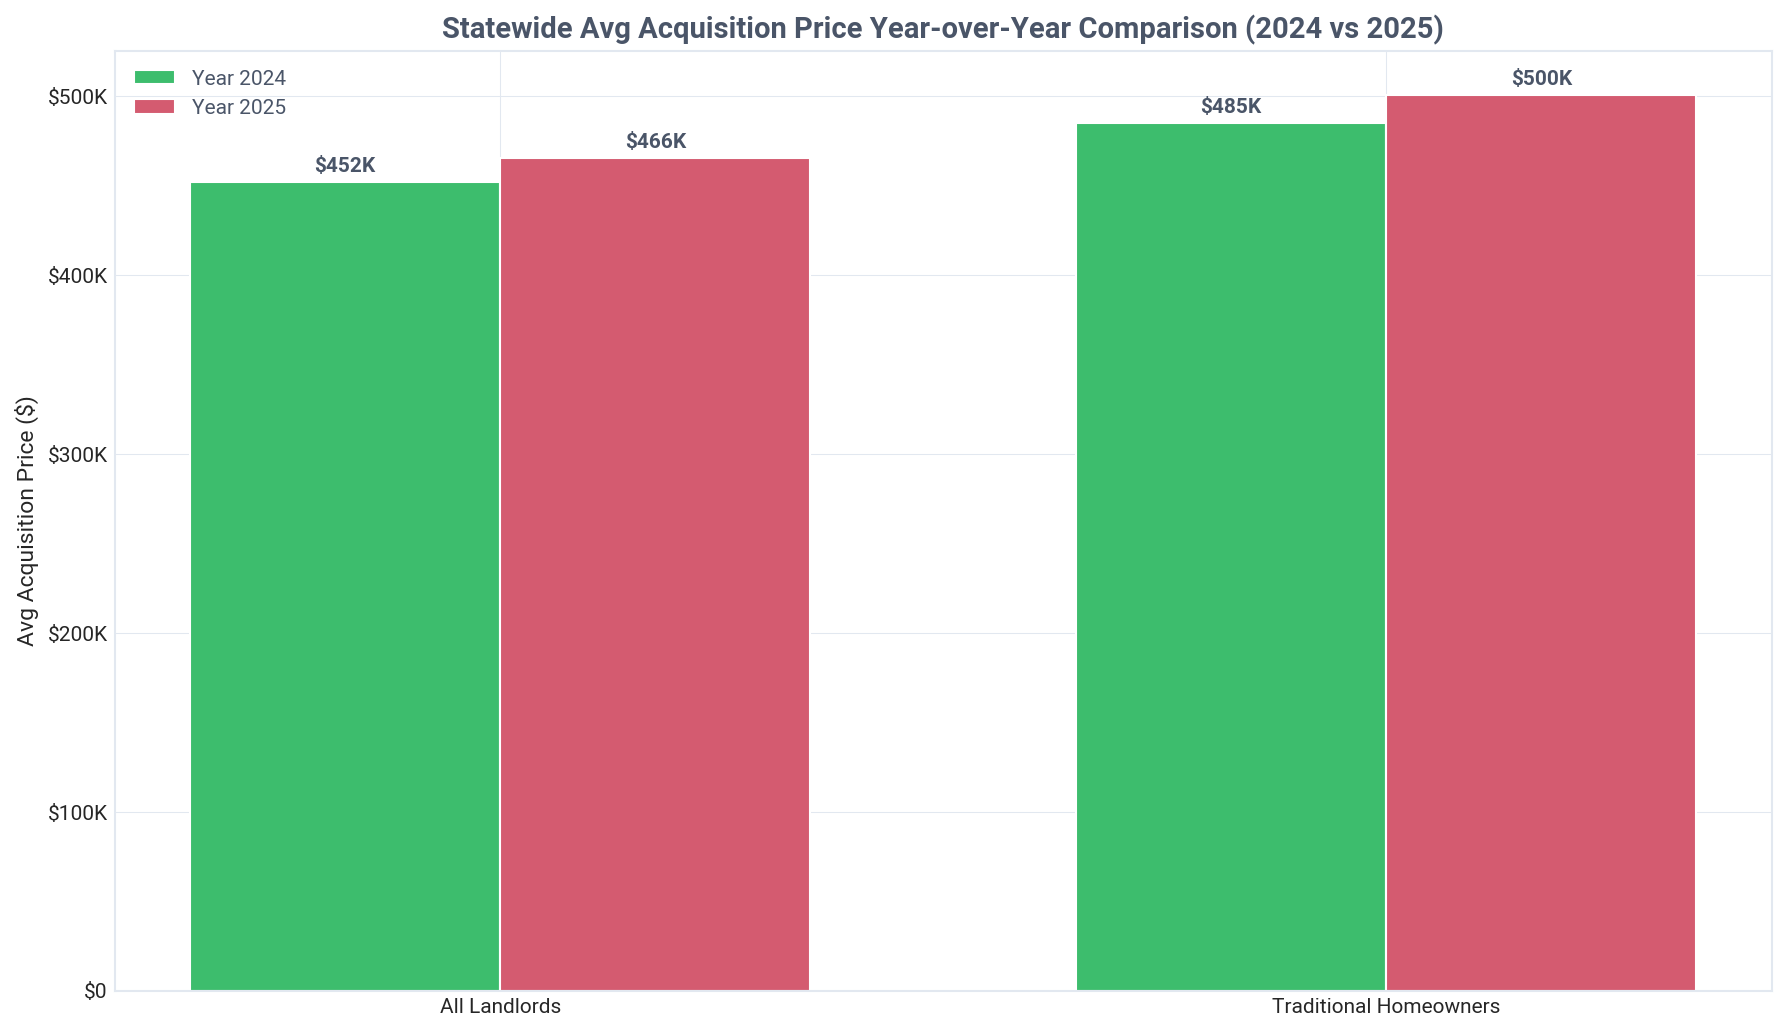
Looking at year-over-year trends, landlord acquisition prices have been on a steady climb. The average price rose from $451,968 in 2024 to $465,651 in 2025, before accelerating further into 2026. This consistent growth underscores the strength and momentum of Alaska's housing market.

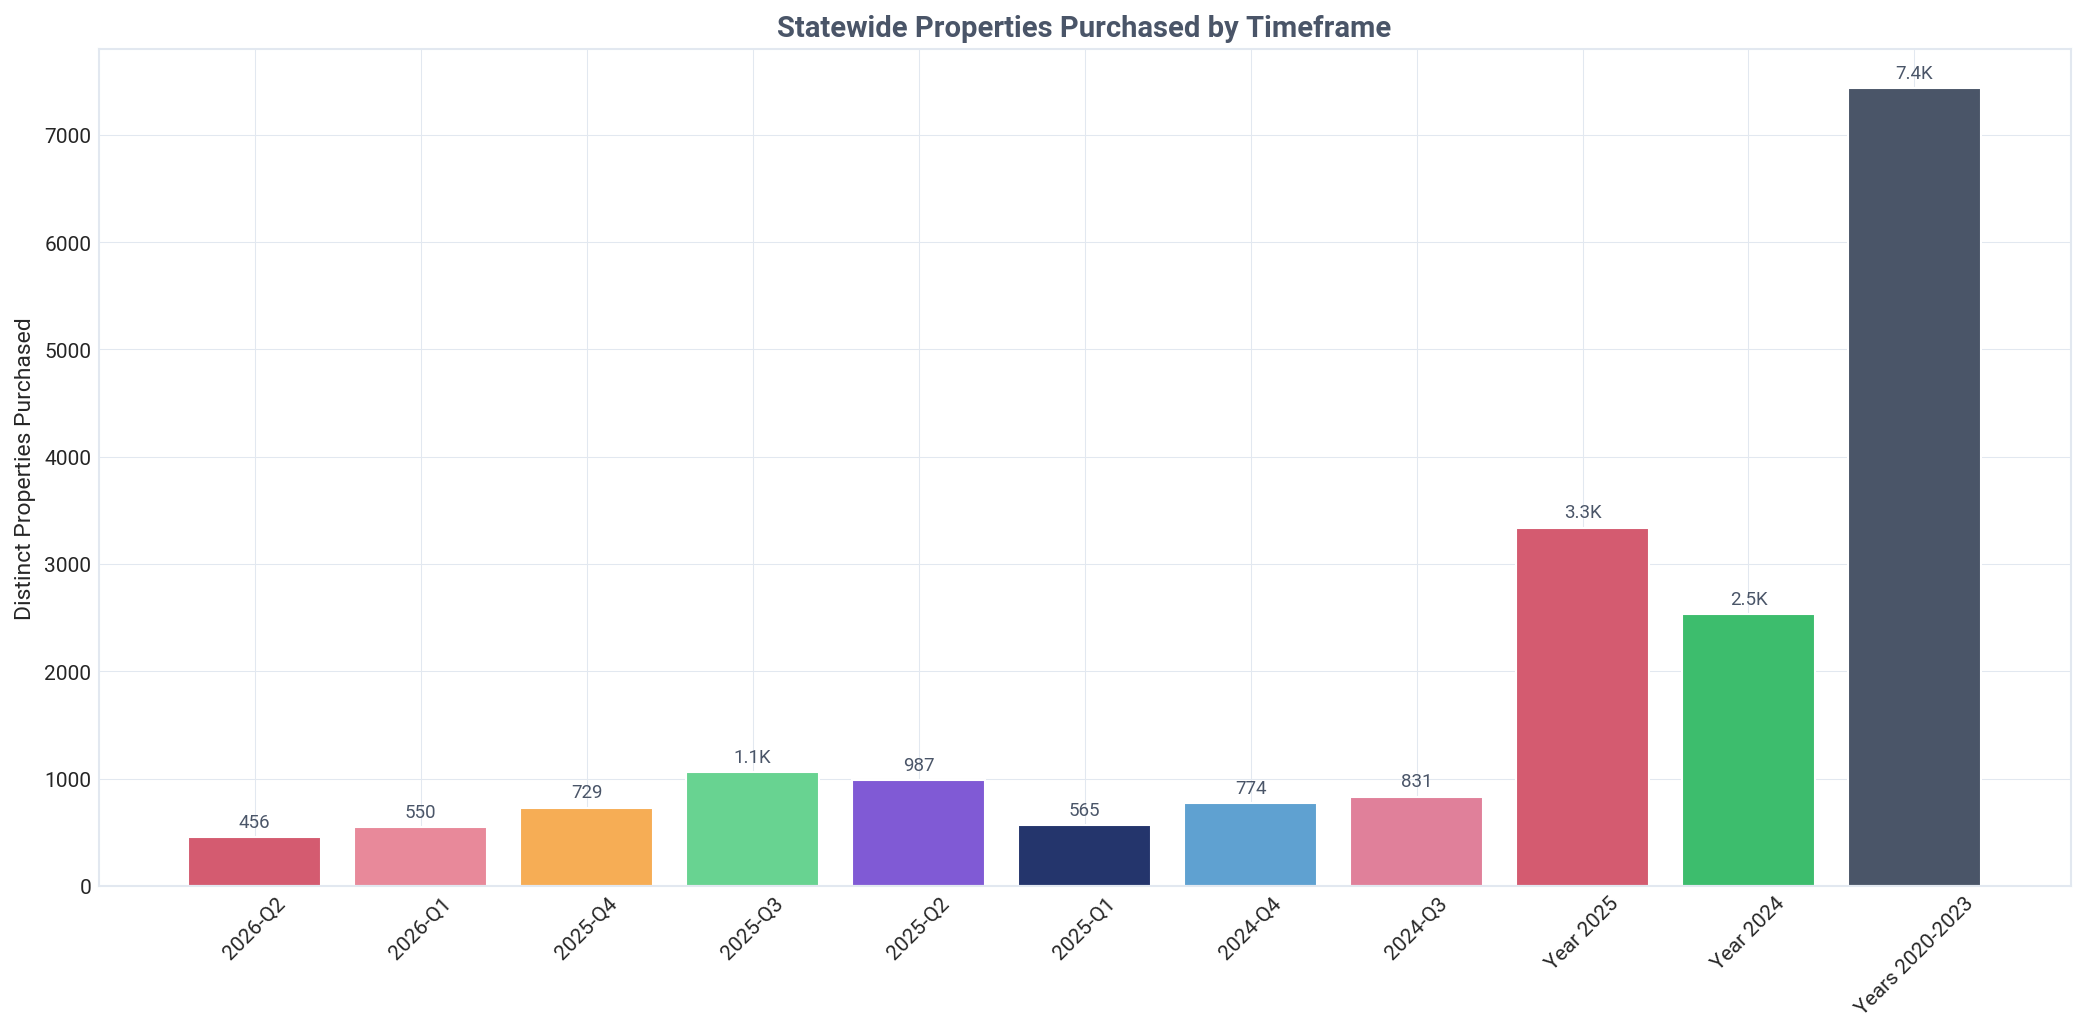
Acquisition volume has fluctuated, with a peak of 1,059 properties purchased in Q3 2025. The 456 properties acquired in Q2 2026 represent a moderation from recent highs but still indicate sustained investor demand. The combination of rising prices and solid acquisition volumes points to a healthy and active investment climate.

Alaska: properties purchased by timeframe, Q2 2026
Alaska: average acquisition price by timeframe, Q2 2026
Alaska: average acquisition price by buyer type, Q2 2026
Alaska: average acquisition price year over year, Q2 2026

Current Quarter Purchase Summary

Analysis of Q2 2026 purchase activity by investor tier and type

Alaska: purchases by tier, Q2 2026
Alaska: purchased property share by tier, Q2 2026
Key Insight
Landlords acquired 29.4% of all single-family homes sold in Alaska during Q2 2026.
Detailed Findings

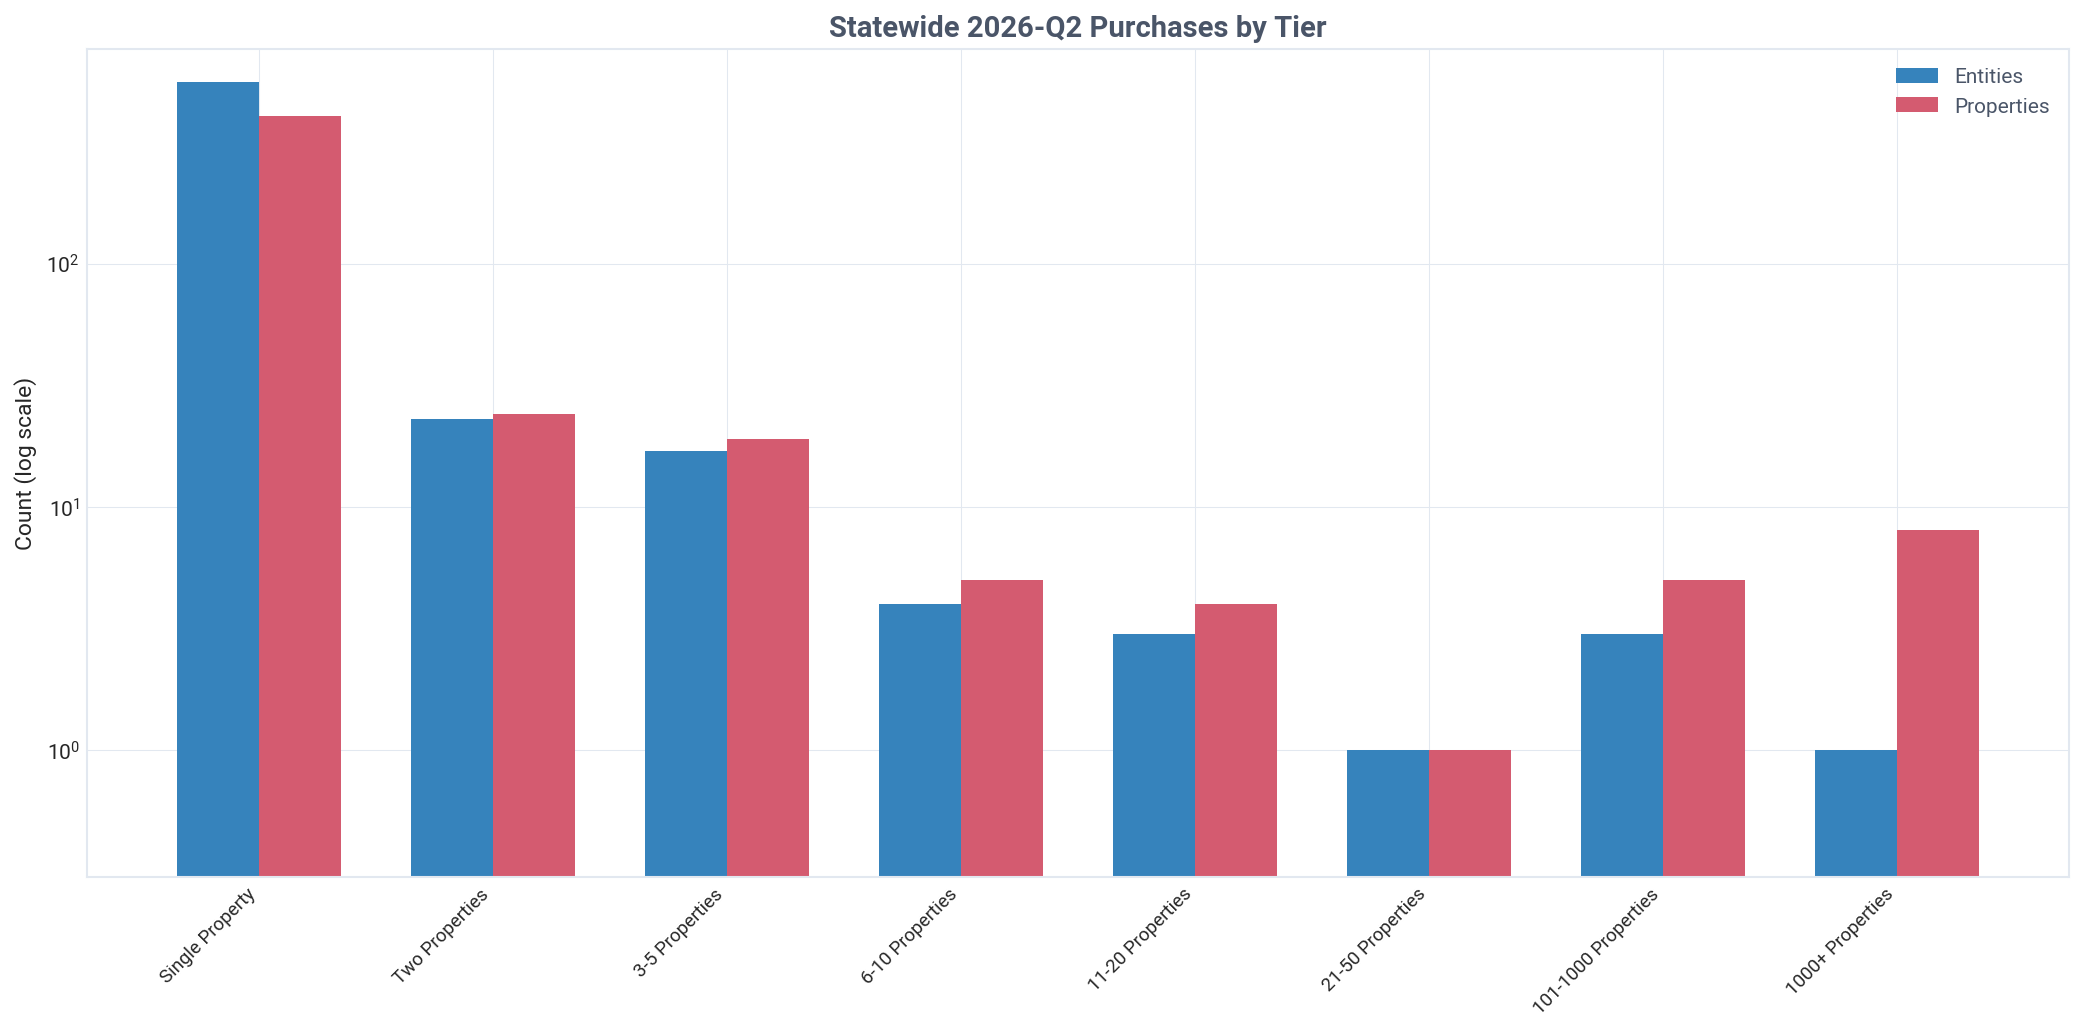
Investor activity remained a powerful force in the Alaskan housing market during Q2 2026, with landlords purchasing 456 of the 1,549 total SFRs sold. This gives investors a significant market share of 29.4% for the quarter, highlighting their role in driving transaction volume. Finding these opportunities often requires access to comprehensive property datasets.

The purchasing activity was almost entirely driven by small-scale investors. Mom-and-pop landlords (owning 1-10 properties) acquired 451 homes, accounting for an overwhelming 96.2% of all investor purchases. This reinforces the theme of a market dominated by smaller players rather than large-scale firms.

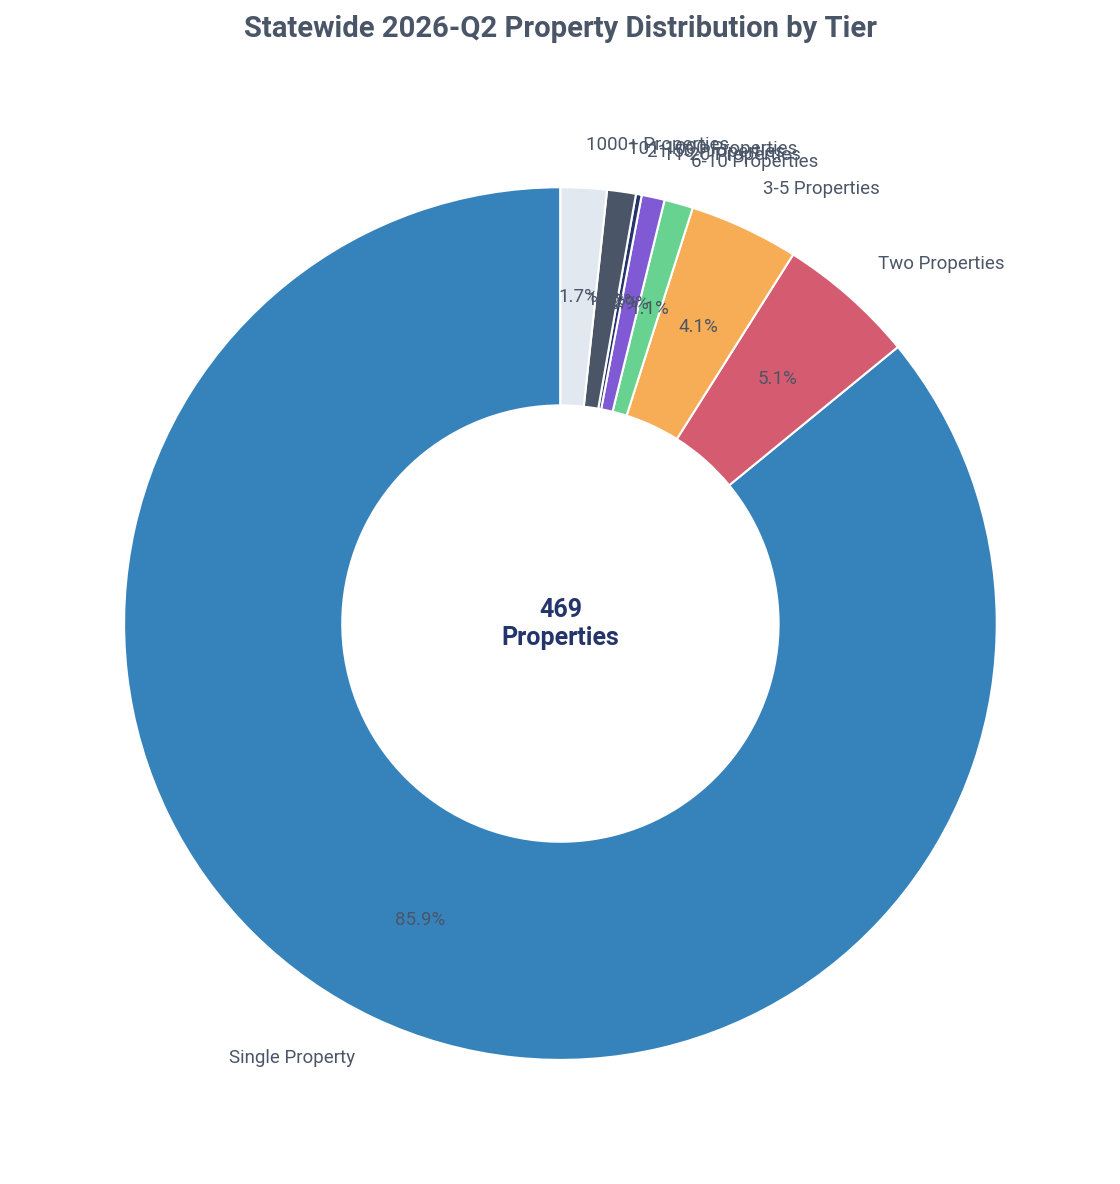
New entrants were a major component of this activity. A remarkable 557 new landlord entities entered the market by purchasing their first investment property. These single-property landlords alone bought 403 homes, representing 85.9% of all investor acquisitions in the quarter and signaling strong grassroots interest in real estate investment.

In sharp contrast, institutional investors (1,000+ properties) had a negligible impact on the market. This tier acquired only 8 properties, making up a mere 1.7% of investor purchases. This data firmly dispels any notion that large, institutional capital is a major driver of Alaska's current market dynamics.

The mid-size tiers showed minimal activity. For example, landlords in the 11-20 property tier purchased only 4 homes, and those in the 21-50 tier bought just a single property. The data clearly shows that Q2 2026 acquisition activity was concentrated at the smallest end of the investor spectrum.

Ownership by Purchase Tier

Distribution of investor-owned properties across portfolio size tiers

Key Insight
Mom-and-pop landlords control a staggering 99.0% of Alaska's investor-owned SFR housing.
Detailed Findings

The distribution of property ownership in Alaska heavily favors small investors. Mom-and-pop landlords, defined as those owning 1-10 properties, collectively control 99.0% of all investor-owned SFRs. This near-total dominance underscores a market structure built on small, independent operators rather than large consolidated portfolios.

The single-property landlord tier is the undisputed backbone of the market. This group alone owns 37,213 properties, which accounts for 86.5% of the entire investor-owned housing stock. This highlights the importance of new and small-scale investors in providing rental housing across the state.

Institutional ownership is practically nonexistent in Alaska. Investors in the 1,000+ property tier hold a combined total of only 95 properties, representing a scant 0.2% of the market. This finding directly contradicts the common narrative of large corporations taking over residential real estate; in Alaska, the opposite is true.

Mid-size investors also represent a very small fraction of the market. Tiers ranging from 11 to 1,000 properties combined own just 342 homes, or about 0.8% of the total investor portfolio. This further illustrates the extreme concentration of ownership among landlords with ten or fewer properties.

The data paints a clear and consistent picture: Alaska's single-family rental market is one of the most decentralized in the nation, characterized by a vast number of small landlords. This structure has significant implications for market stability, rental pricing, and policy-making.

Alaska: current ownership by purchase tier, Q2 2026
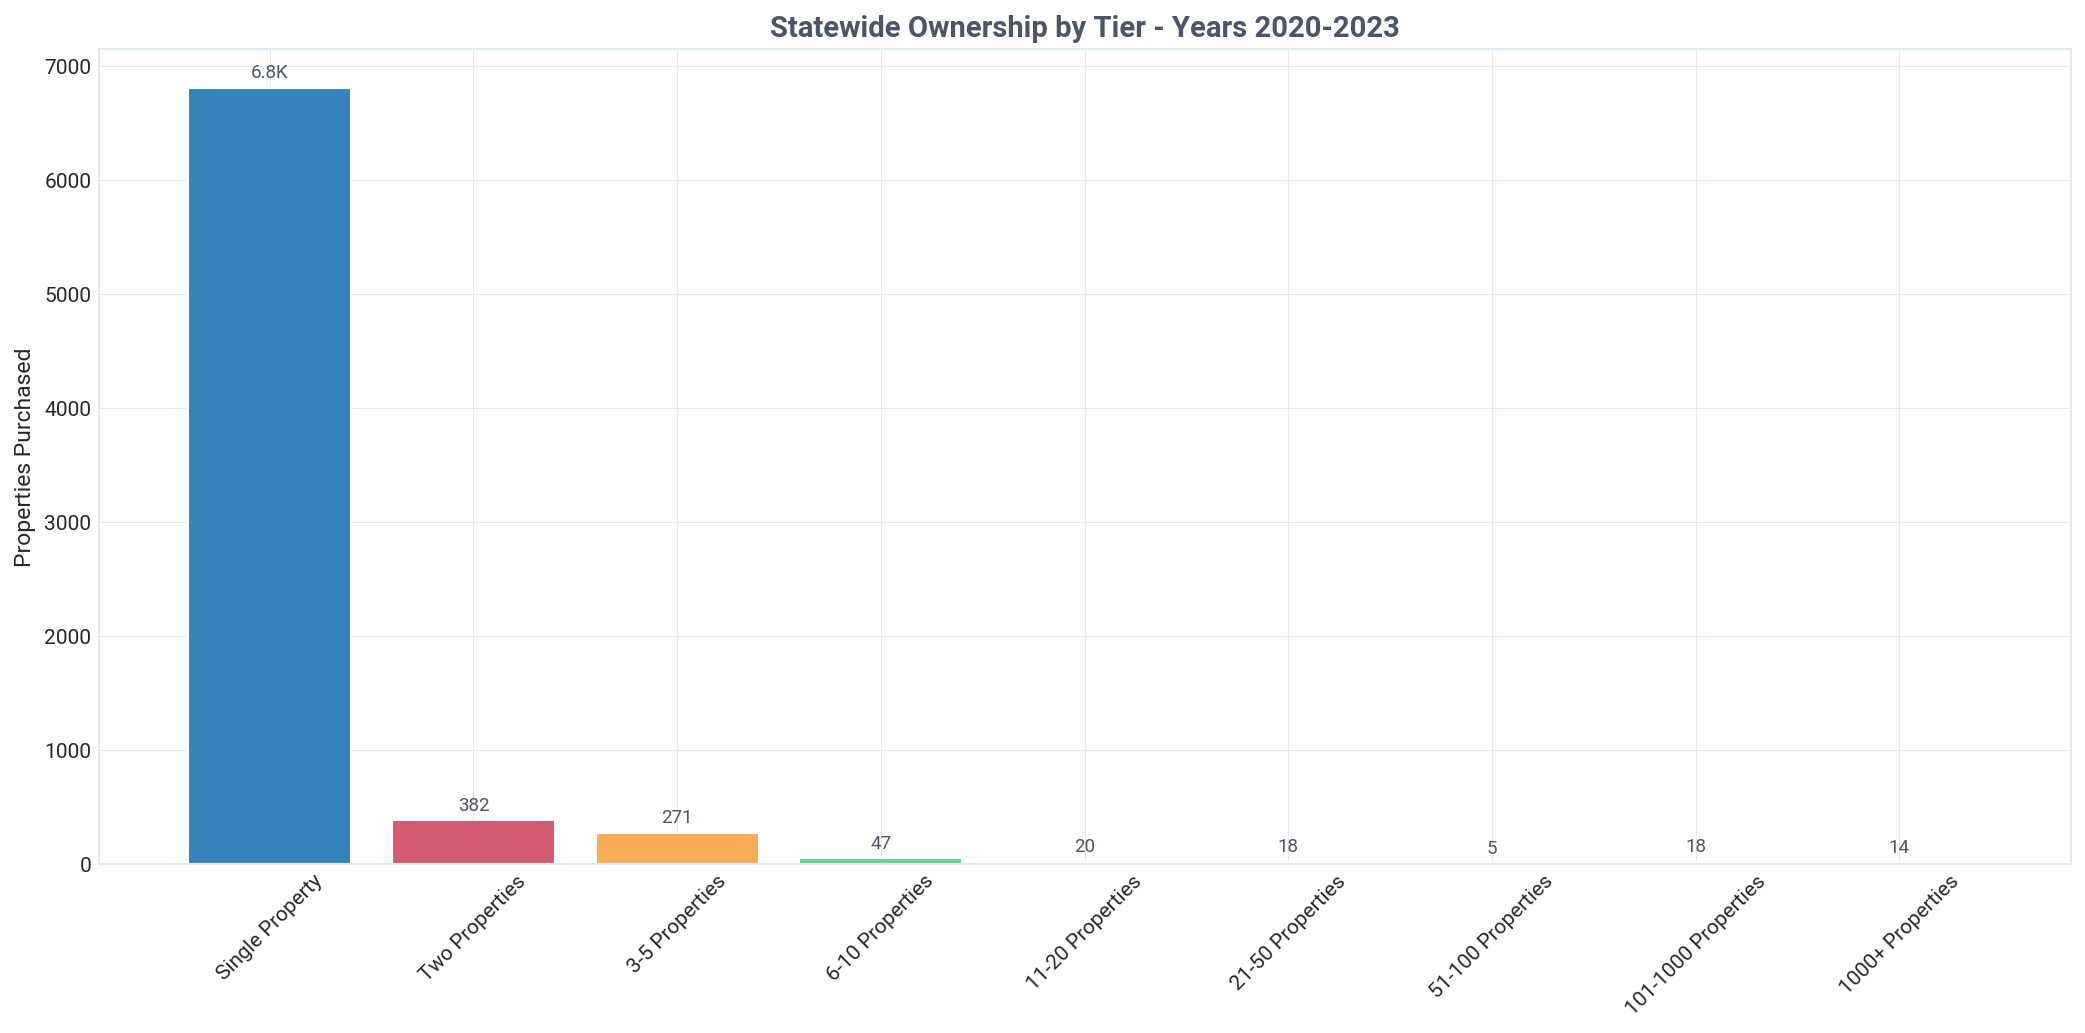
Alaska: properties purchased by tier, all time, Q2 2026
Alaska: properties purchased by tier this quarter, Q2 2026
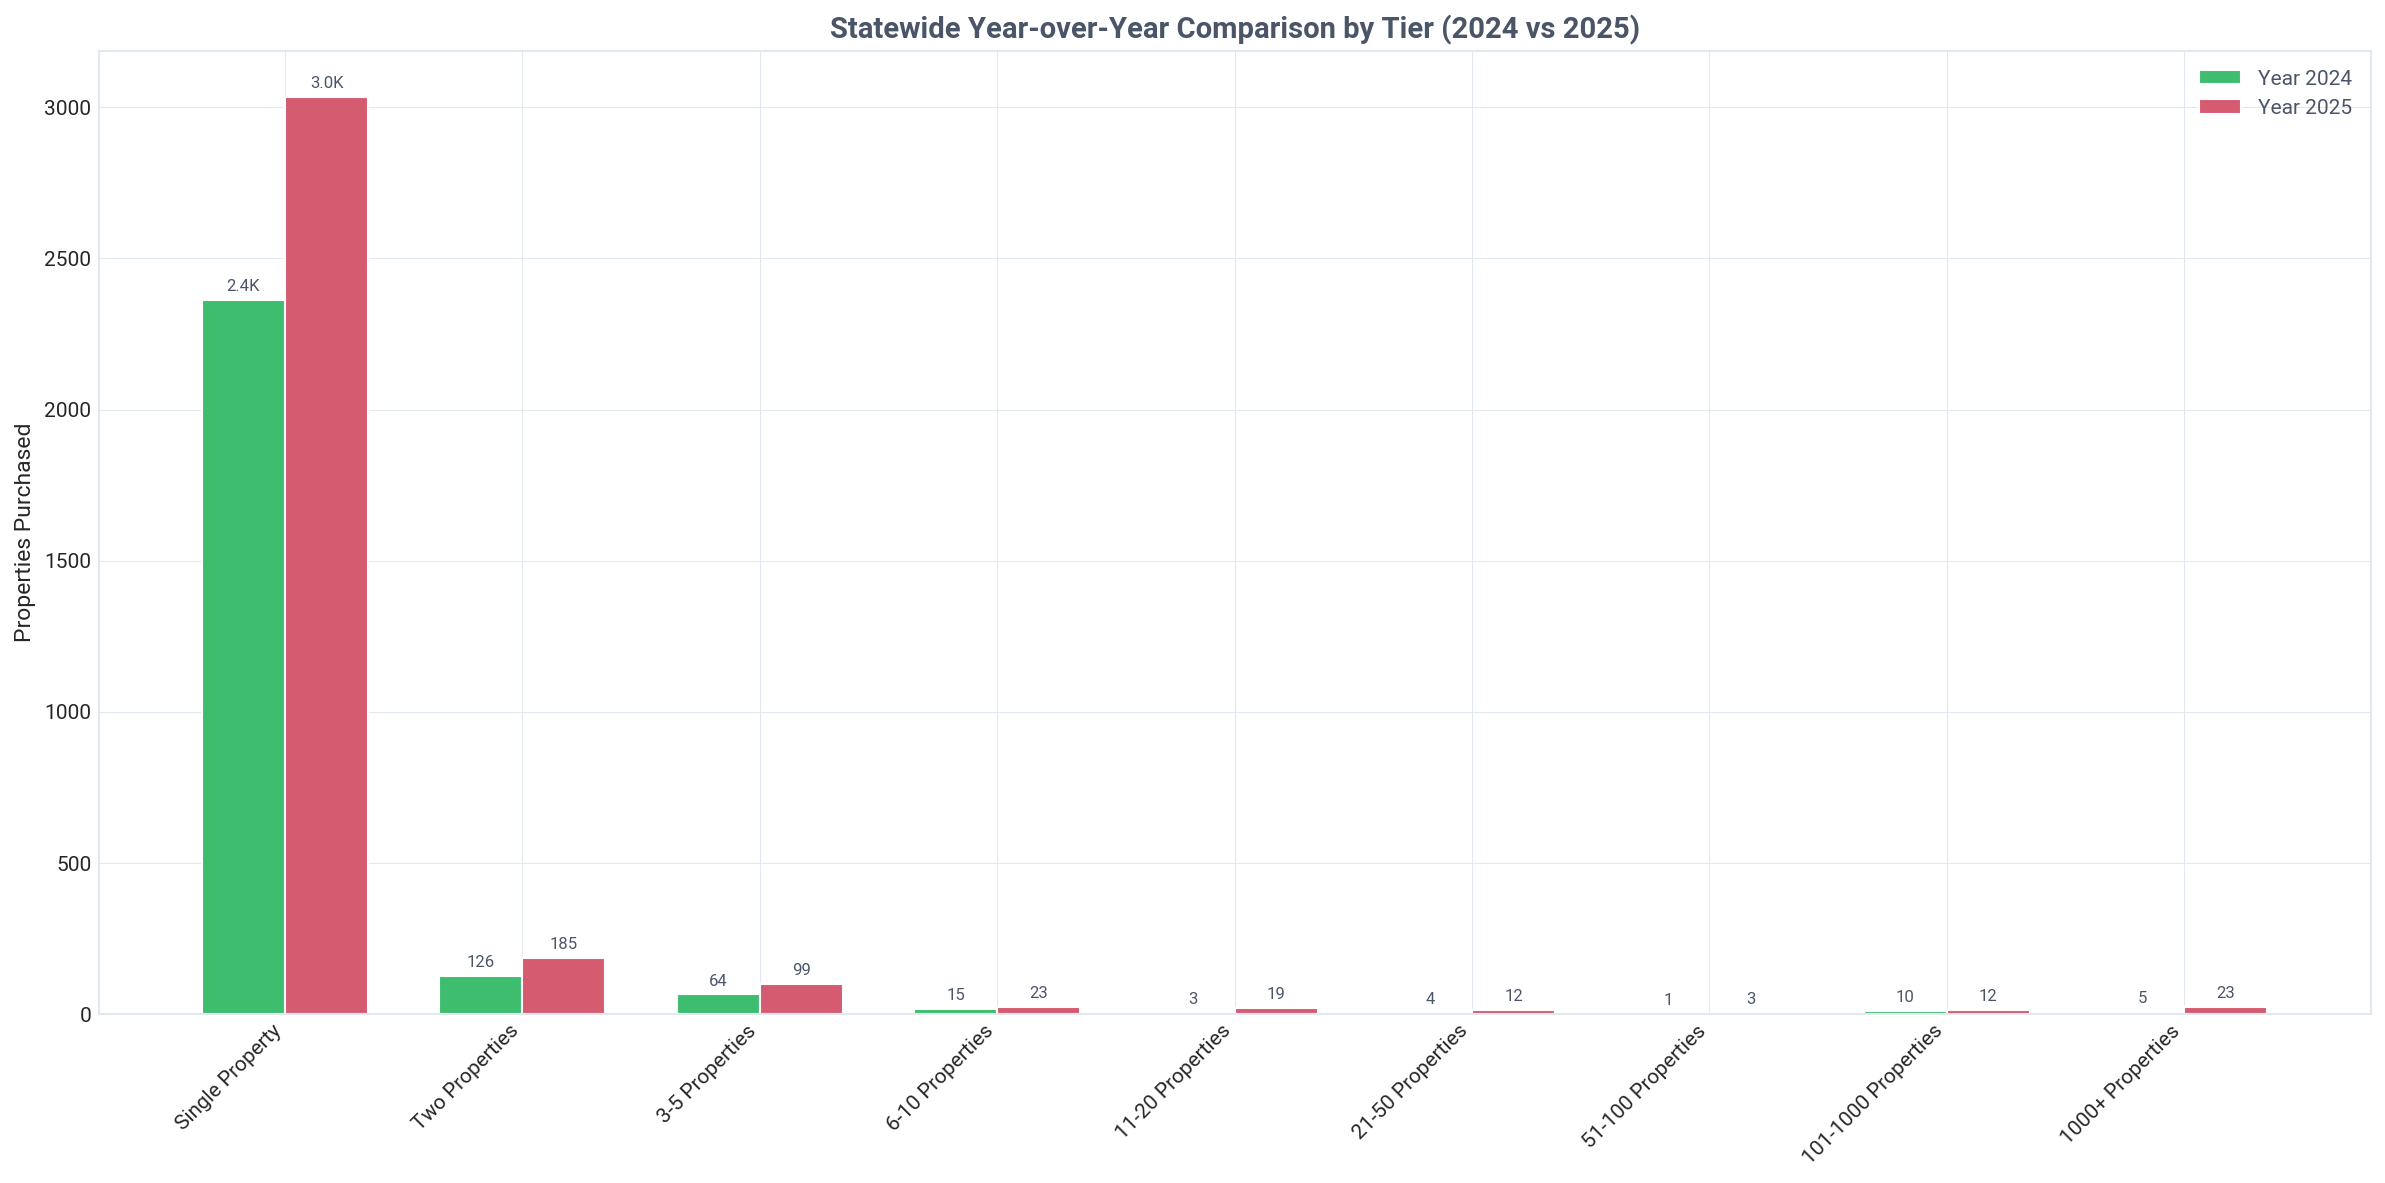
Alaska: properties purchased by tier year over year, Q2 2026

Need custom portfolio analysis based on these tier insights?

TALK TO AN EXPERT

Ownership by Tier & Owner Type

Breakdown of individual vs corporate ownership across portfolio tiers

Alaska: ownership by tier and owner type, Q2 2026
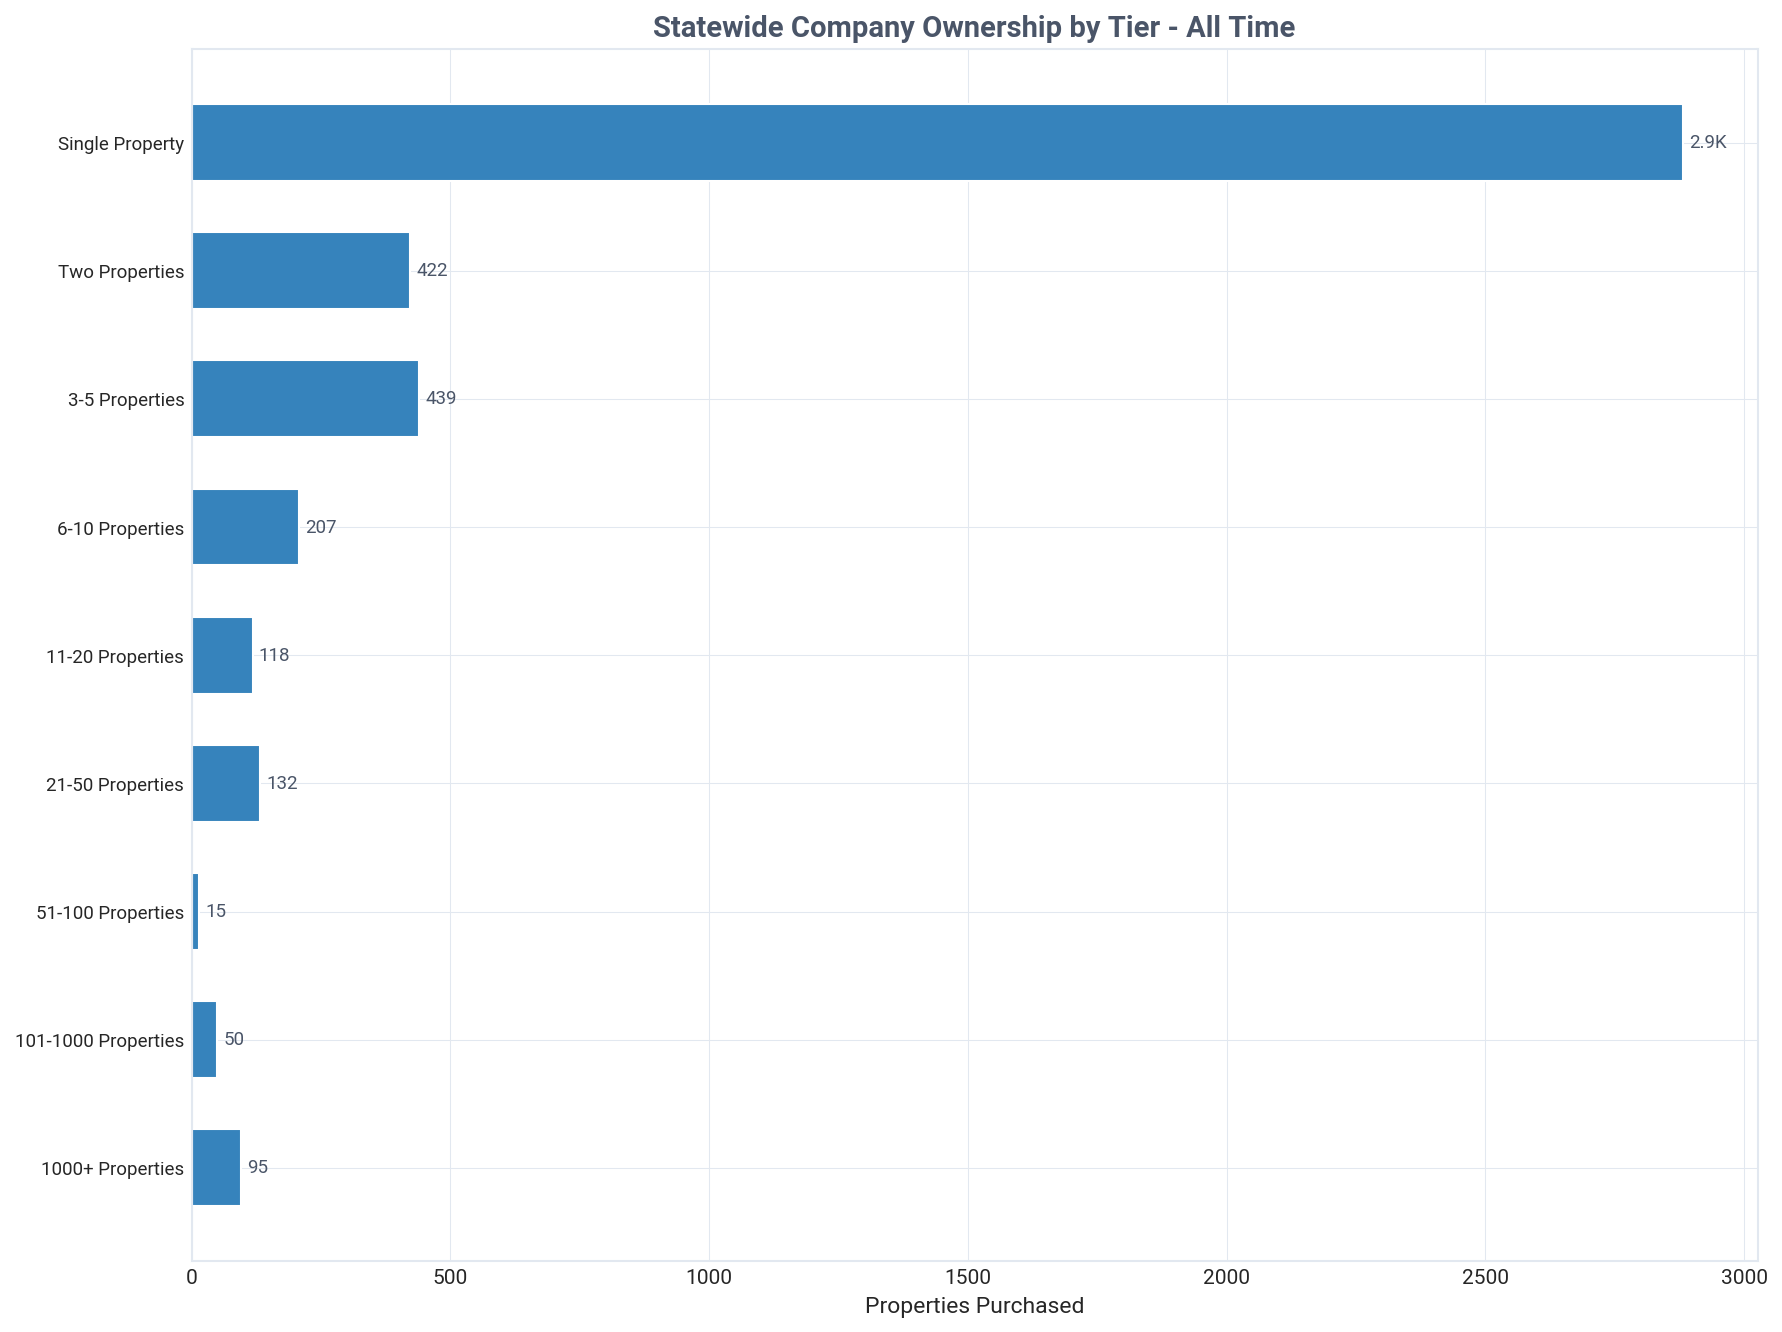
Alaska: company purchases by tier, all time, Q2 2026
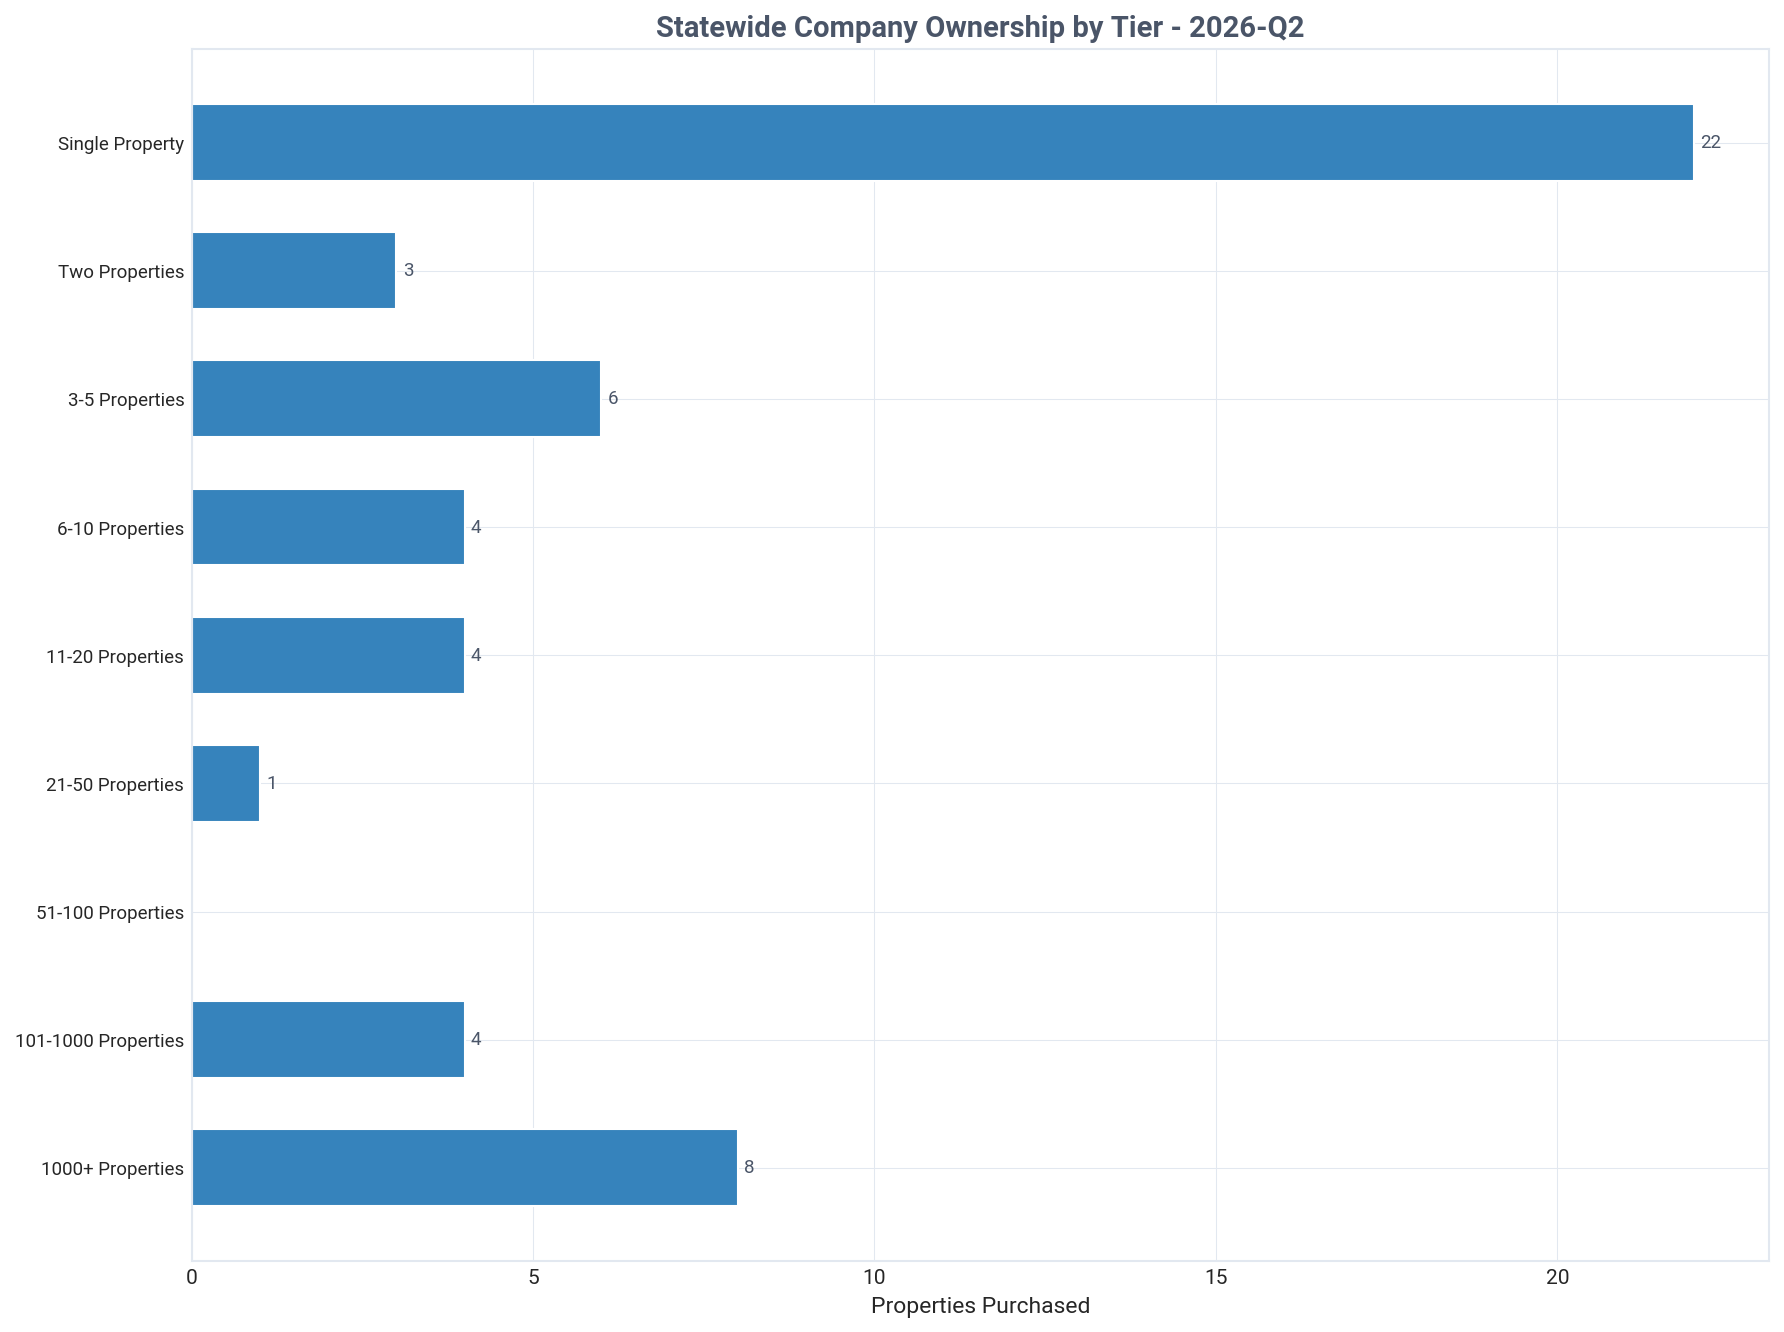
Alaska: company purchases by tier this quarter, Q2 2026
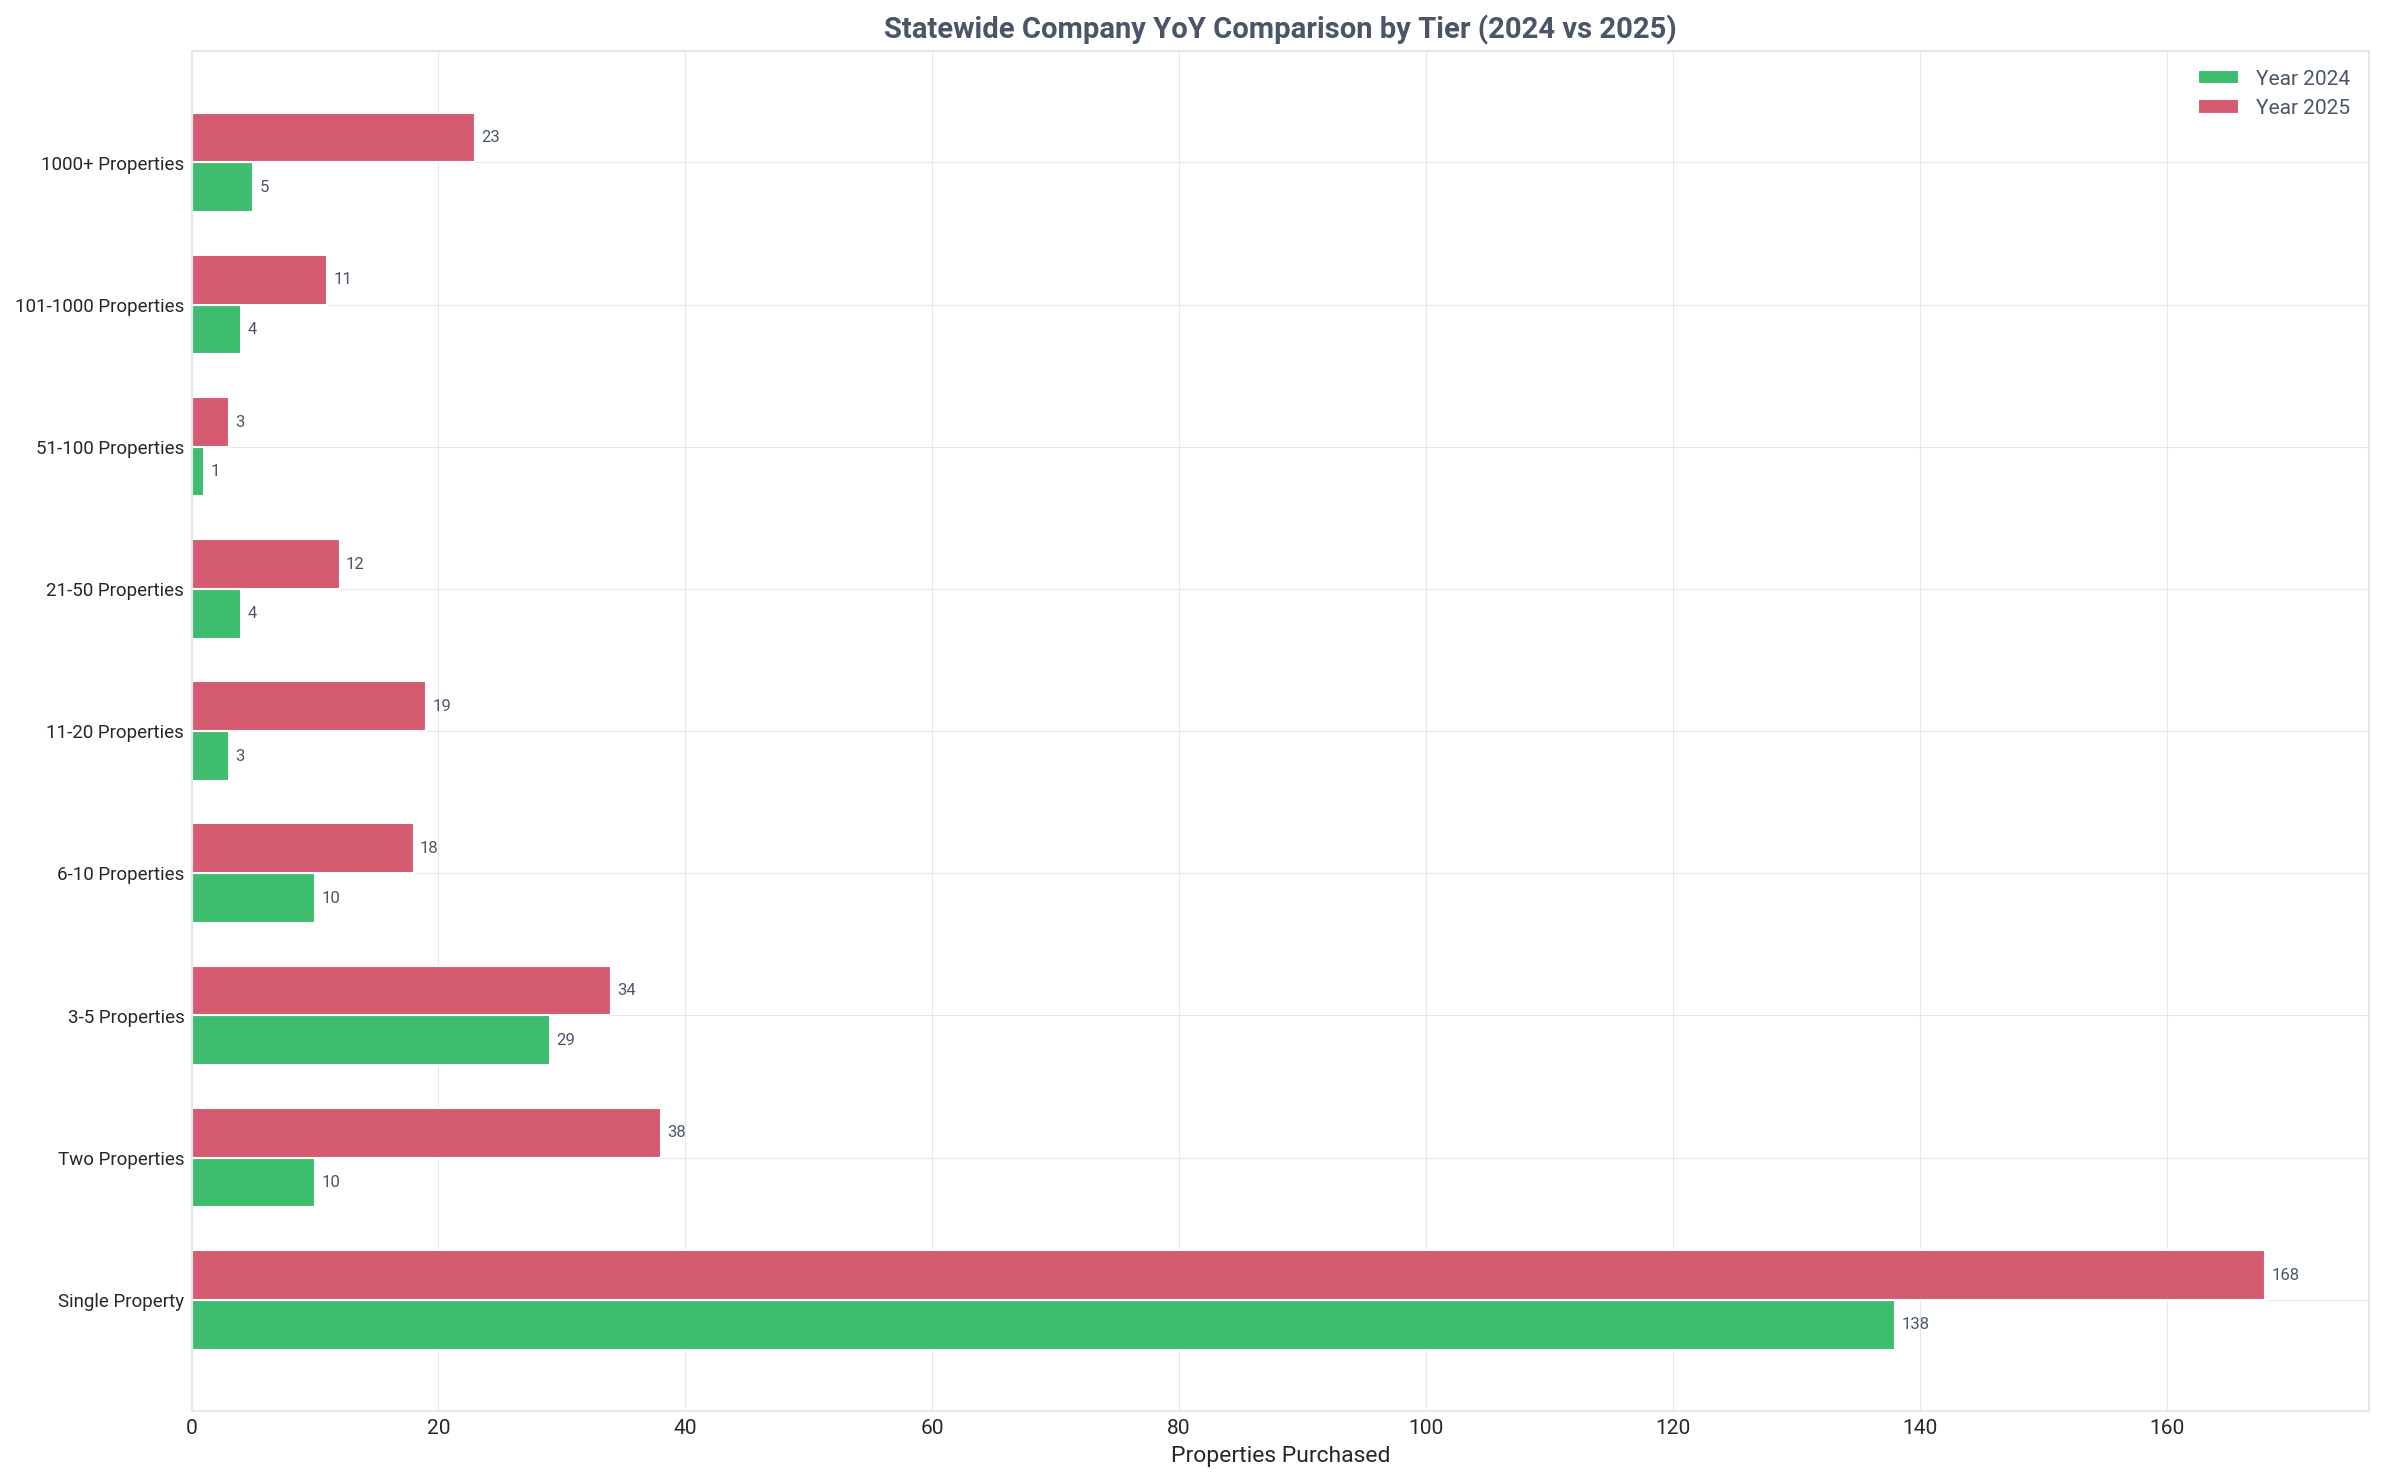
Alaska: company purchases by tier year over year, Q2 2026
Key Insight
Companies become the majority owners at the 6-10 property tier, holding 67.6% of homes in that segment.
Detailed Findings

A distinct crossover point emerges when analyzing ownership by entity type across portfolio tiers. While individuals dominate the smaller end of the market, companies become the majority owners in the 6-10 property tier (Tier 04), where they hold 207 properties, or 67.6% of that segment. This tier marks the clear transition from personal investment to structured business operations.

Individual investors are the primary force in smaller portfolios. They own 34,949 properties (92.4%) in the single-property tier and 2,625 properties (86.2%) in the two-property tier. This demonstrates that the entry point and early growth stages of real estate investing in Alaska are overwhelmingly driven by private individuals.

As portfolios grow, company ownership quickly becomes the standard. In the 11-20 property tier, companies own 89.4% of the homes. This concentration intensifies further up the scale, with companies owning 132 of the 133 properties (99.2%) in the 21-50 property tier.

This pattern suggests a strategic shift where investors formalize their operations into business entities like LLCs as their holdings expand. This is likely done for liability protection, financing advantages, and operational efficiency, a common practice among professional investors who might use a property data API to manage their assets.

Even within the larger tiers, a small individual presence remains. For instance, in the 101-1,000 property tier, individuals still own 12 properties. However, the prevailing trend is clear: the journey from a small landlord to a mid-size operator in Alaska almost always involves transitioning from personal ownership to a corporate structure.

Geographic Distribution

Regional breakdown of investor activity and ownership patterns

Key Insight
Matanuska-Susitna Borough is the epicenter of investor activity in Alaska, with 14,563 investor-owned properties.
Detailed Findings

Investor ownership in Alaska is geographically concentrated, with Matanuska-Susitna Borough serving as the primary hub. The borough contains 14,563 investor-owned SFRs, representing 34.7% of the entire investor portfolio in the state. This area, along with Kenai Peninsula Borough (10,230 properties) and Anchorage Municipality (7,031 properties), holds the vast majority of investment properties.

A striking contrast exists between the areas with the highest count of investor properties and those with the highest rate of investor ownership. While Anchorage has over 7,000 investor properties, its ownership rate is a relatively low 12.2%. This is because its total housing stock is very large. An effective property search tool can help identify opportunities in such diverse markets.

Conversely, several smaller, more remote boroughs exhibit extremely high investor ownership rates, suggesting they are dominated by non-resident owners, potentially for vacation rentals or employee housing. Bristol Bay Borough reports a 100.0% investor ownership rate, followed by Northwest Arctic Borough (94.6%), Southeast Fairbanks Census Area (94.0%), and Skagway Municipality (92.3%).

This bifurcation indicates two different types of investment markets in Alaska. The first consists of large, populated areas like Matanuska-Susitna and Anchorage where investors are a significant but not dominant part of the market. The second consists of smaller, specialized markets where nearly all residential property is held as an investment.

The top five regions by sheer property count (Matanuska-Susitna, Kenai Peninsula, Anchorage, Fairbanks North Star, and Juneau) collectively account for 37,821 properties, or 90.0% of all investor-owned SFRs in Alaska. This reveals that despite the state's vast geography, investor activity is highly focused within a few key economic and residential centers.

Alaska: landlord ownership map, Q2 2026
Alaska: top 15 areas by landlord-owned properties, Q2 2026
Alaska: top 15 areas by landlord ownership share, Q2 2026

Historical Transactions

Buy/sell transaction trends over time for all landlords and institutional investors

Alaska: landlord buy and sell transactions, Q2 2026
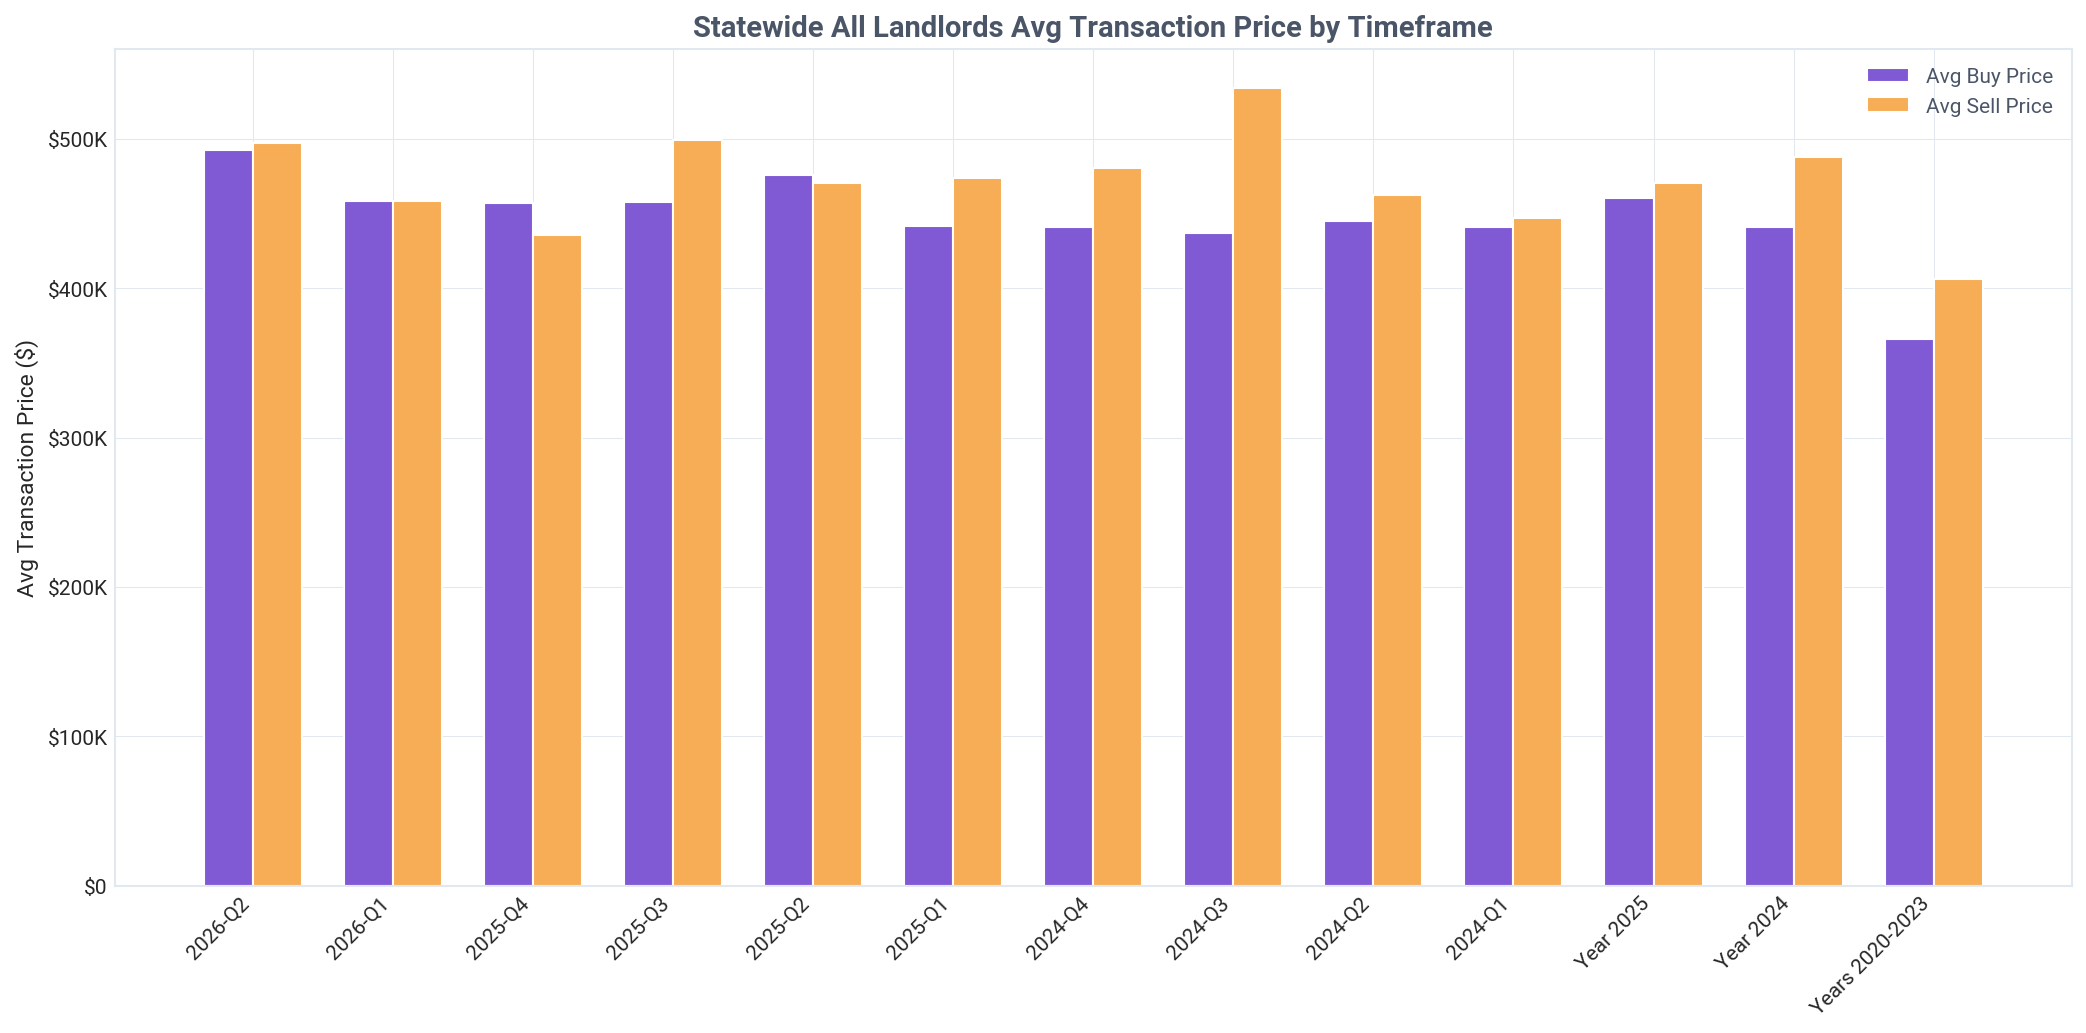
Alaska: landlord average buy and sell prices, Q2 2026
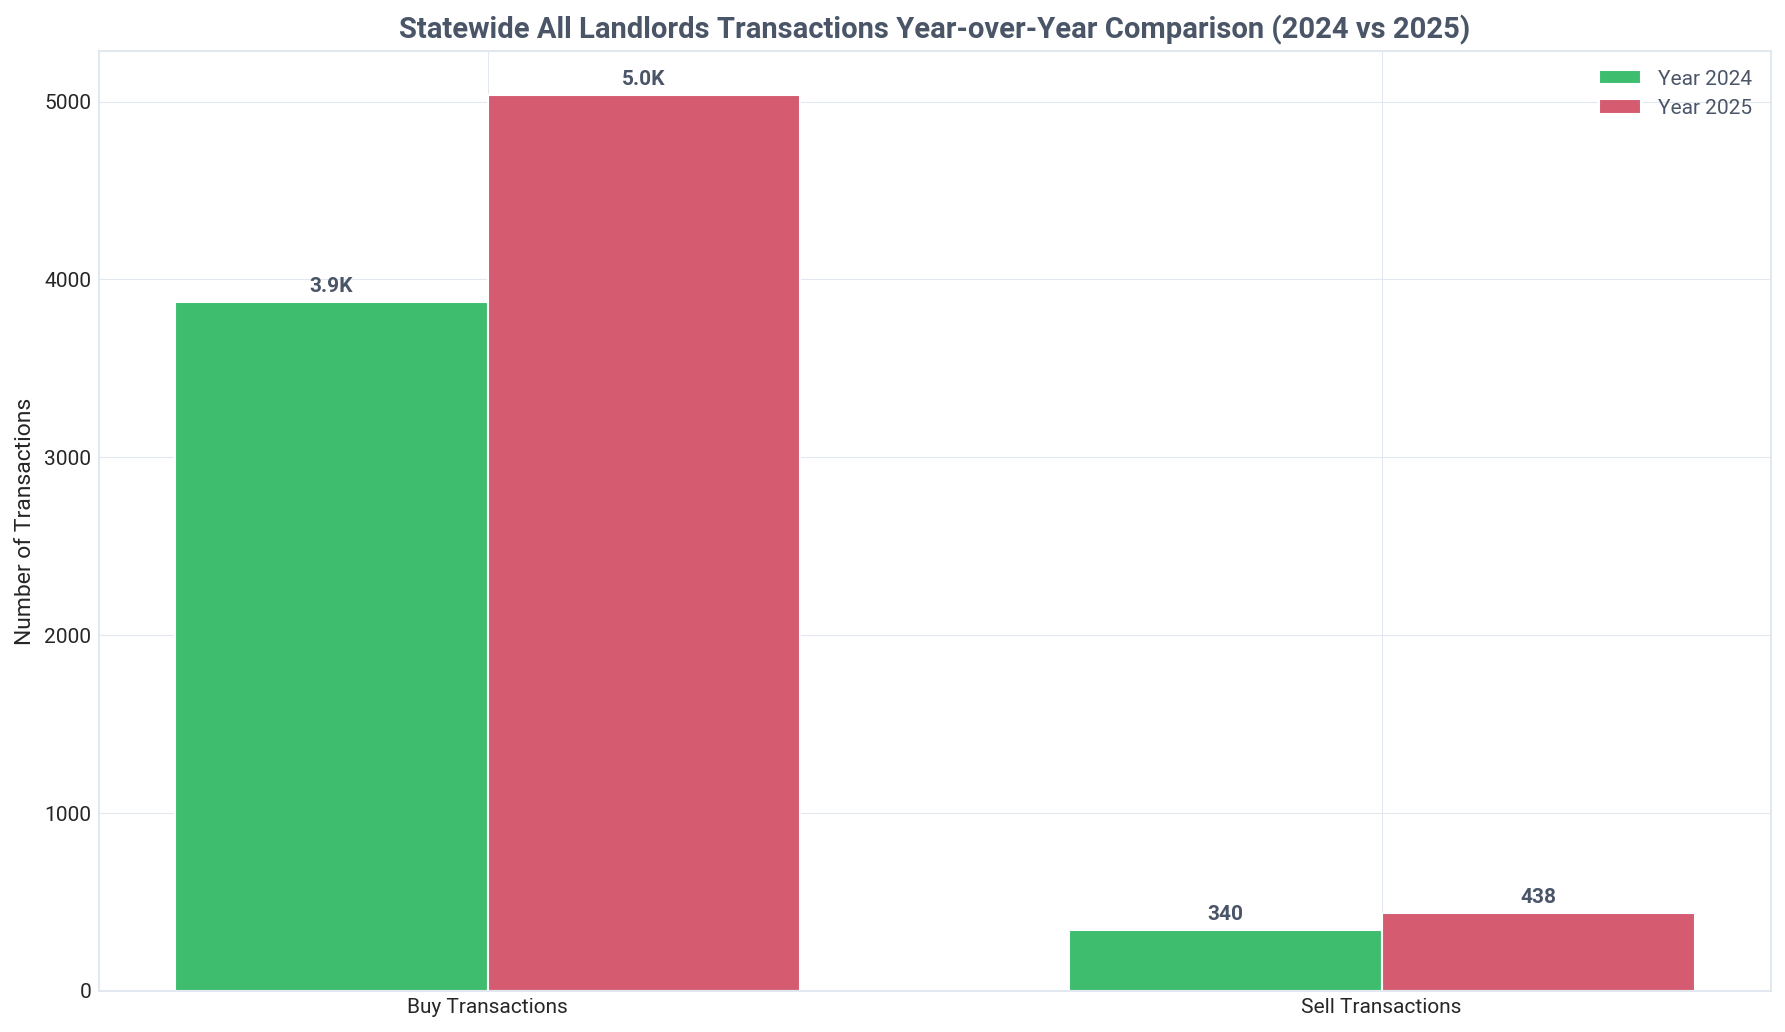
Alaska: landlord transactions year over year, Q2 2026
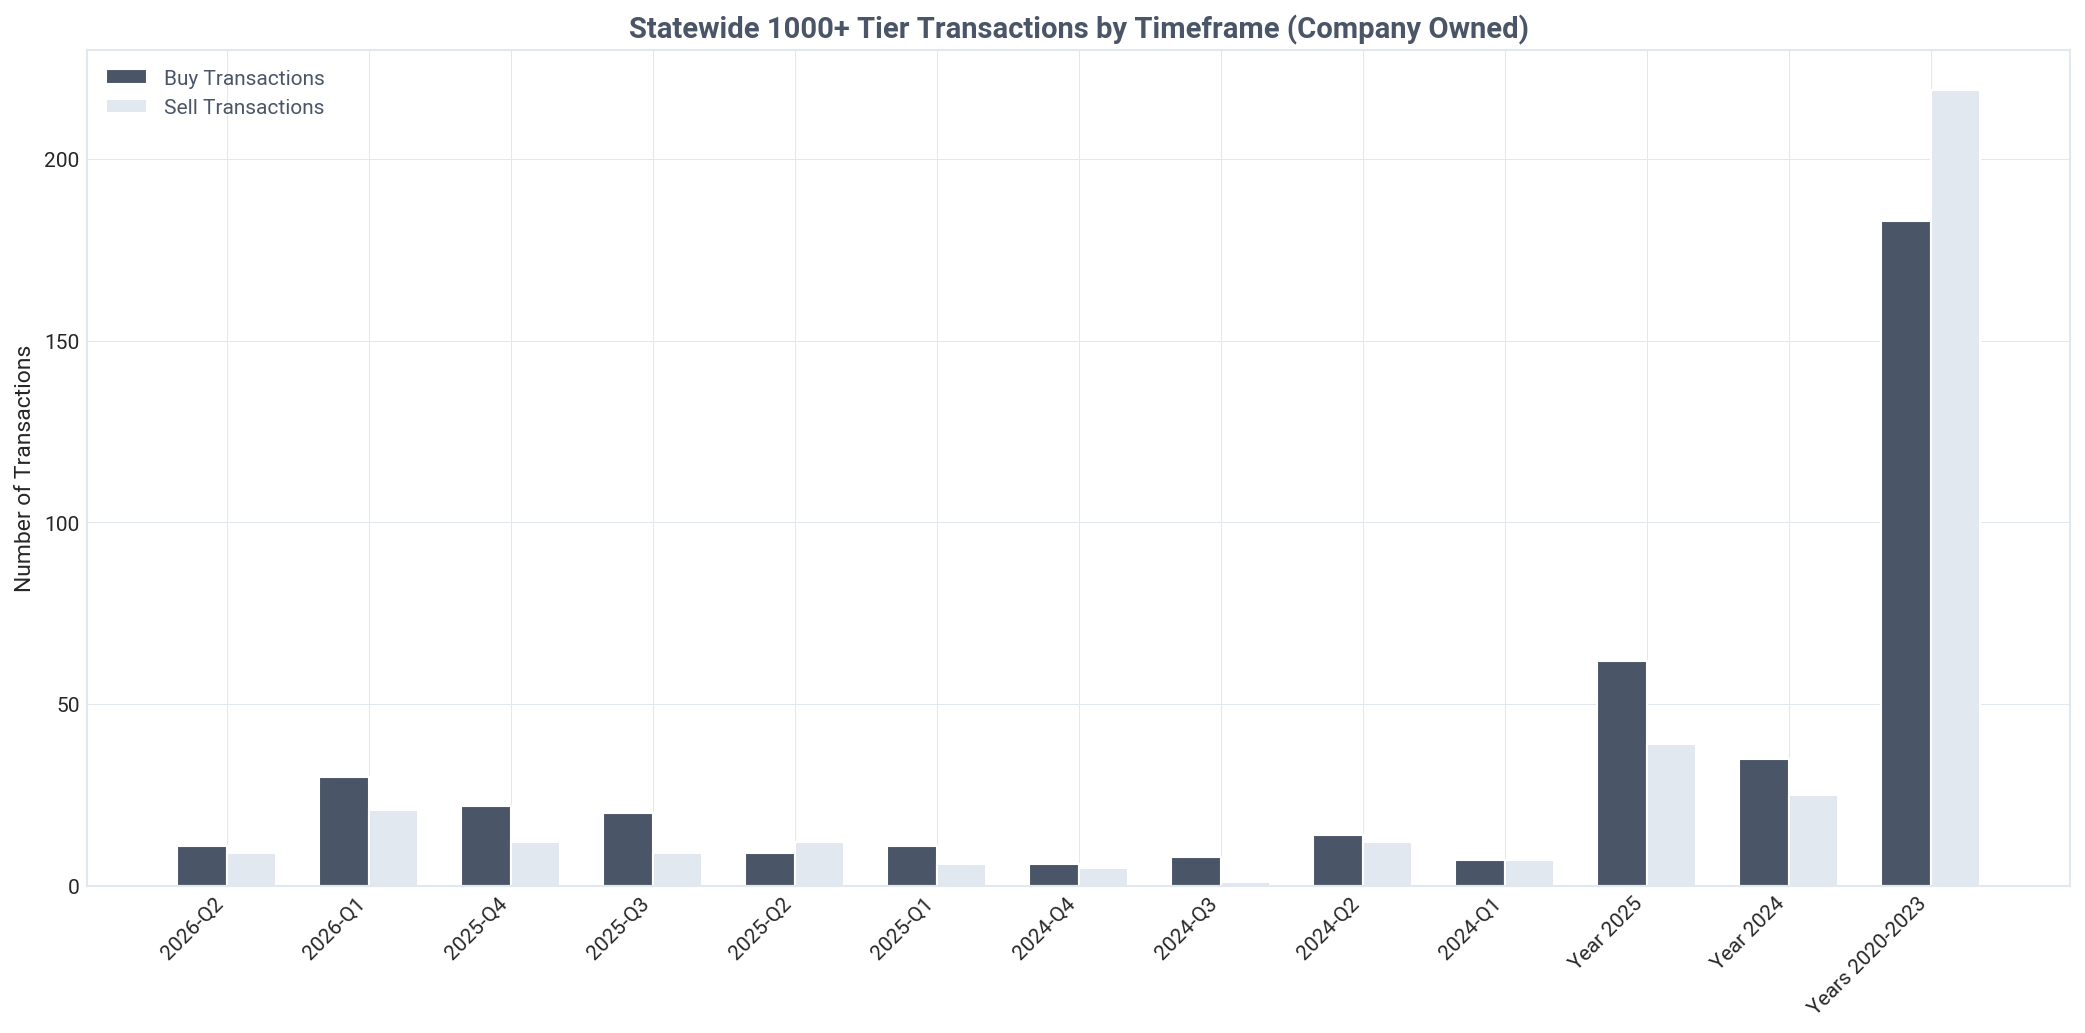
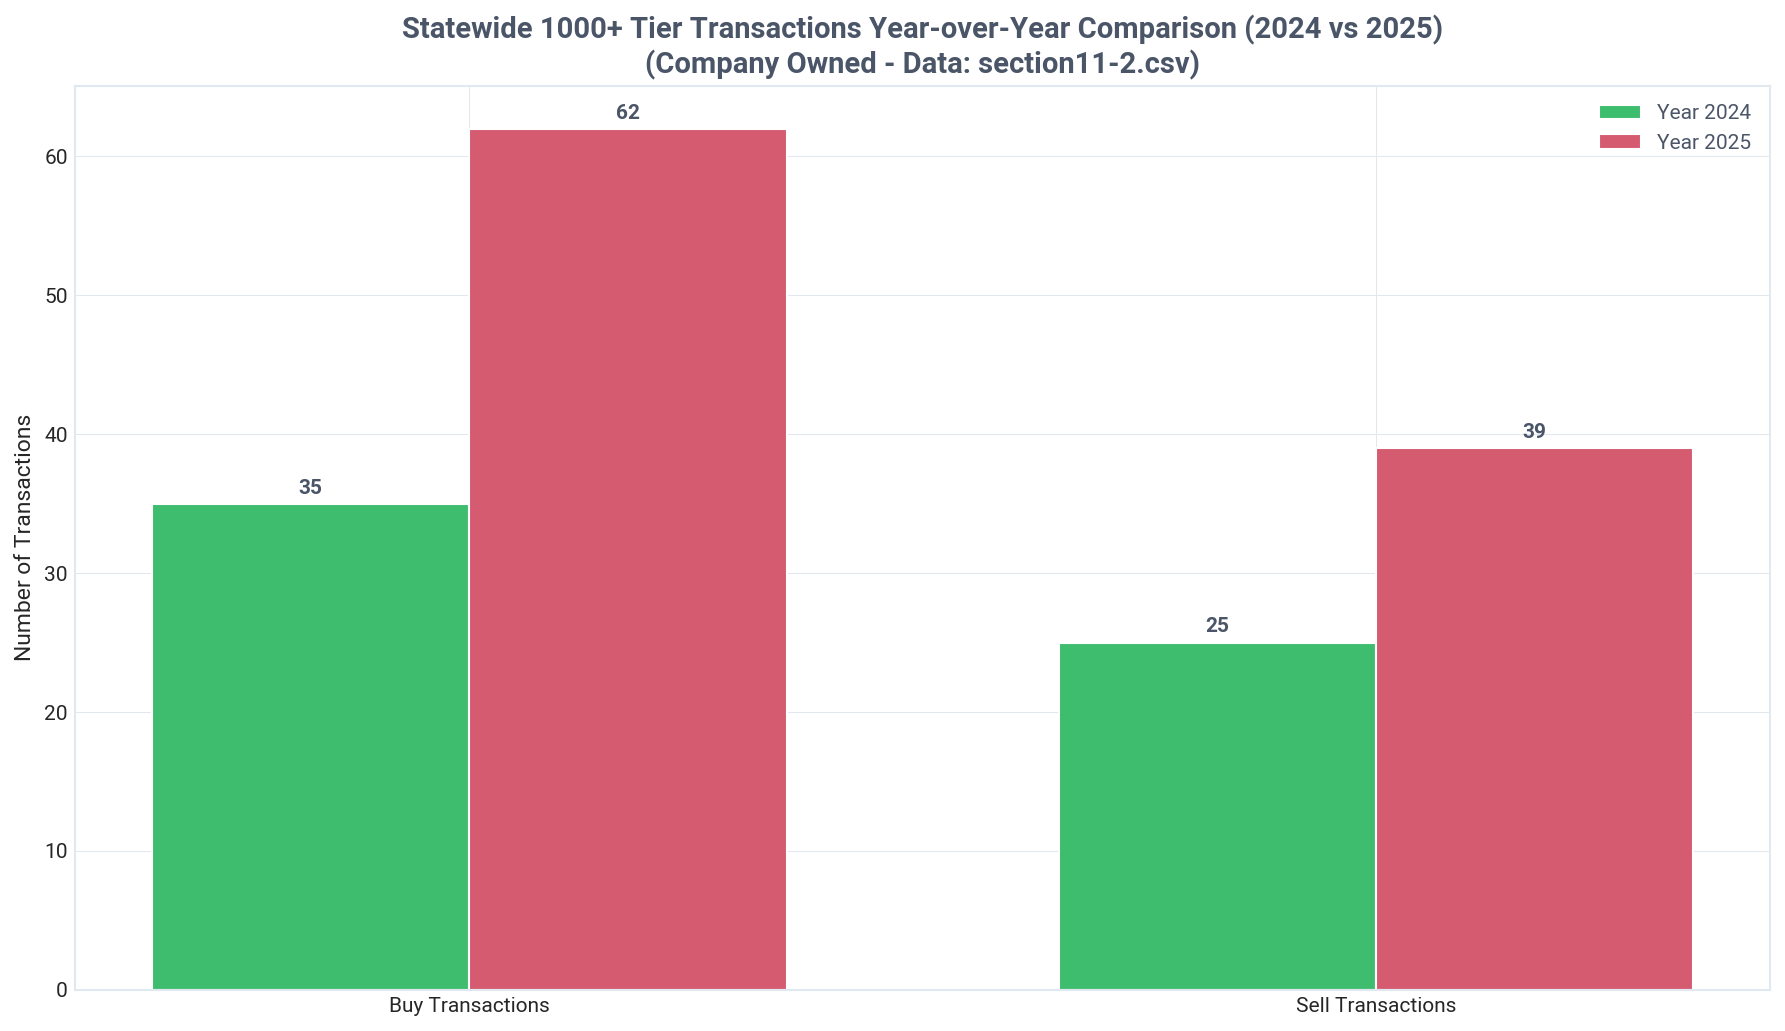
Alaska: 1000+ tier company transactions, Q2 2026
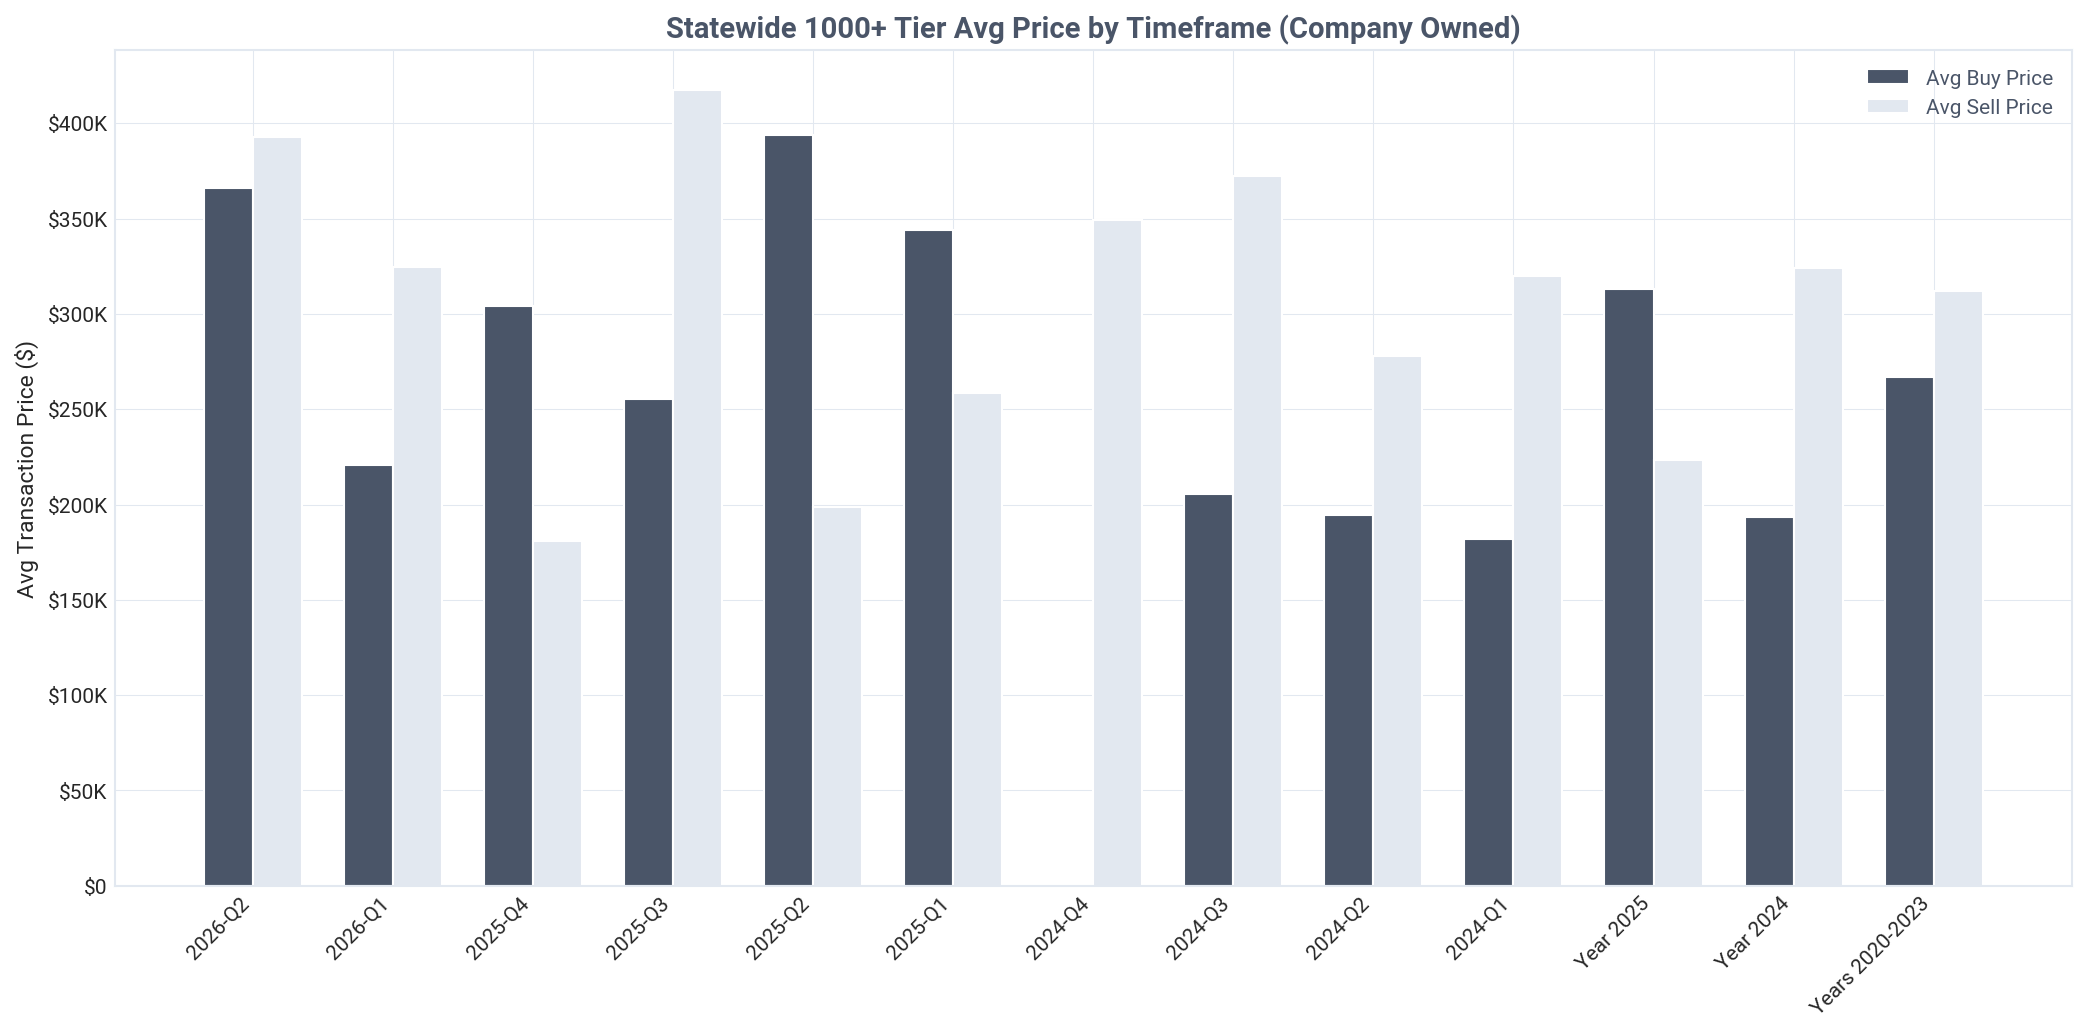
Alaska: 1000+ tier company average prices, Q2 2026
Alaska: 1000+ tier transactions year over year, Q2 2026
Key Insight
Alaska's landlords are aggressive net buyers, acquiring nearly 10 properties for every 1 they sold in Q2 2026.
Detailed Findings

Landlords in Alaska are firmly in an accumulation phase, consistently buying far more properties than they sell. In Q2 2026, this trend was particularly pronounced, with 635 properties purchased versus only 64 sold. This creates a buy-to-sell ratio of 9.92, indicating that for every ten homes investors transacted, nearly nine were acquisitions.

This net buyer behavior is not a recent phenomenon but a persistent long-term trend. In 2025, investors bought 5,034 properties and sold just 438, and in 2024 they bought 3,873 while selling 340. This sustained pattern of portfolio growth signals strong confidence in the future of Alaska's housing market and could be informed by detailed assessor data.

Even the state's small contingent of institutional investors (1,000+ properties) are net buyers, albeit on a much smaller scale. In Q2 2026, this group acquired 11 properties and sold 9, resulting in a net gain of 2 properties. While their transaction volume is low, their strategy aligns with the broader market trend of accumulation.

The transaction data reflects a market with steady liquidity and a clear direction of capital flow into rental housing. The consistent positive net acquisition numbers quarter after quarter and year after year demonstrate that investors are a primary source of demand in the Alaskan real estate market.

Analyzing historical buying and selling across all timeframes shows this pattern holds true. The persistent imbalance between buy and sell volumes points to a strategic, long-term expansion of rental portfolios across the state, driven by thousands of independent investors.

Current Quarter Transactions

Q2 2026 transaction analysis by tier, price, and inter-landlord activity

Key Insight
Investors were involved in 28.7% of all real estate transactions in Alaska during Q2 2026.
Detailed Findings

In Q2 2026, landlords participated in 635 of the 2,215 total SFR transactions, capturing a 28.7% share of all market activity. This substantial involvement underscores their critical role in providing market liquidity and driving sales volume. These transactions might include properties with outstanding debt, which can be tracked with mortgage transaction data.

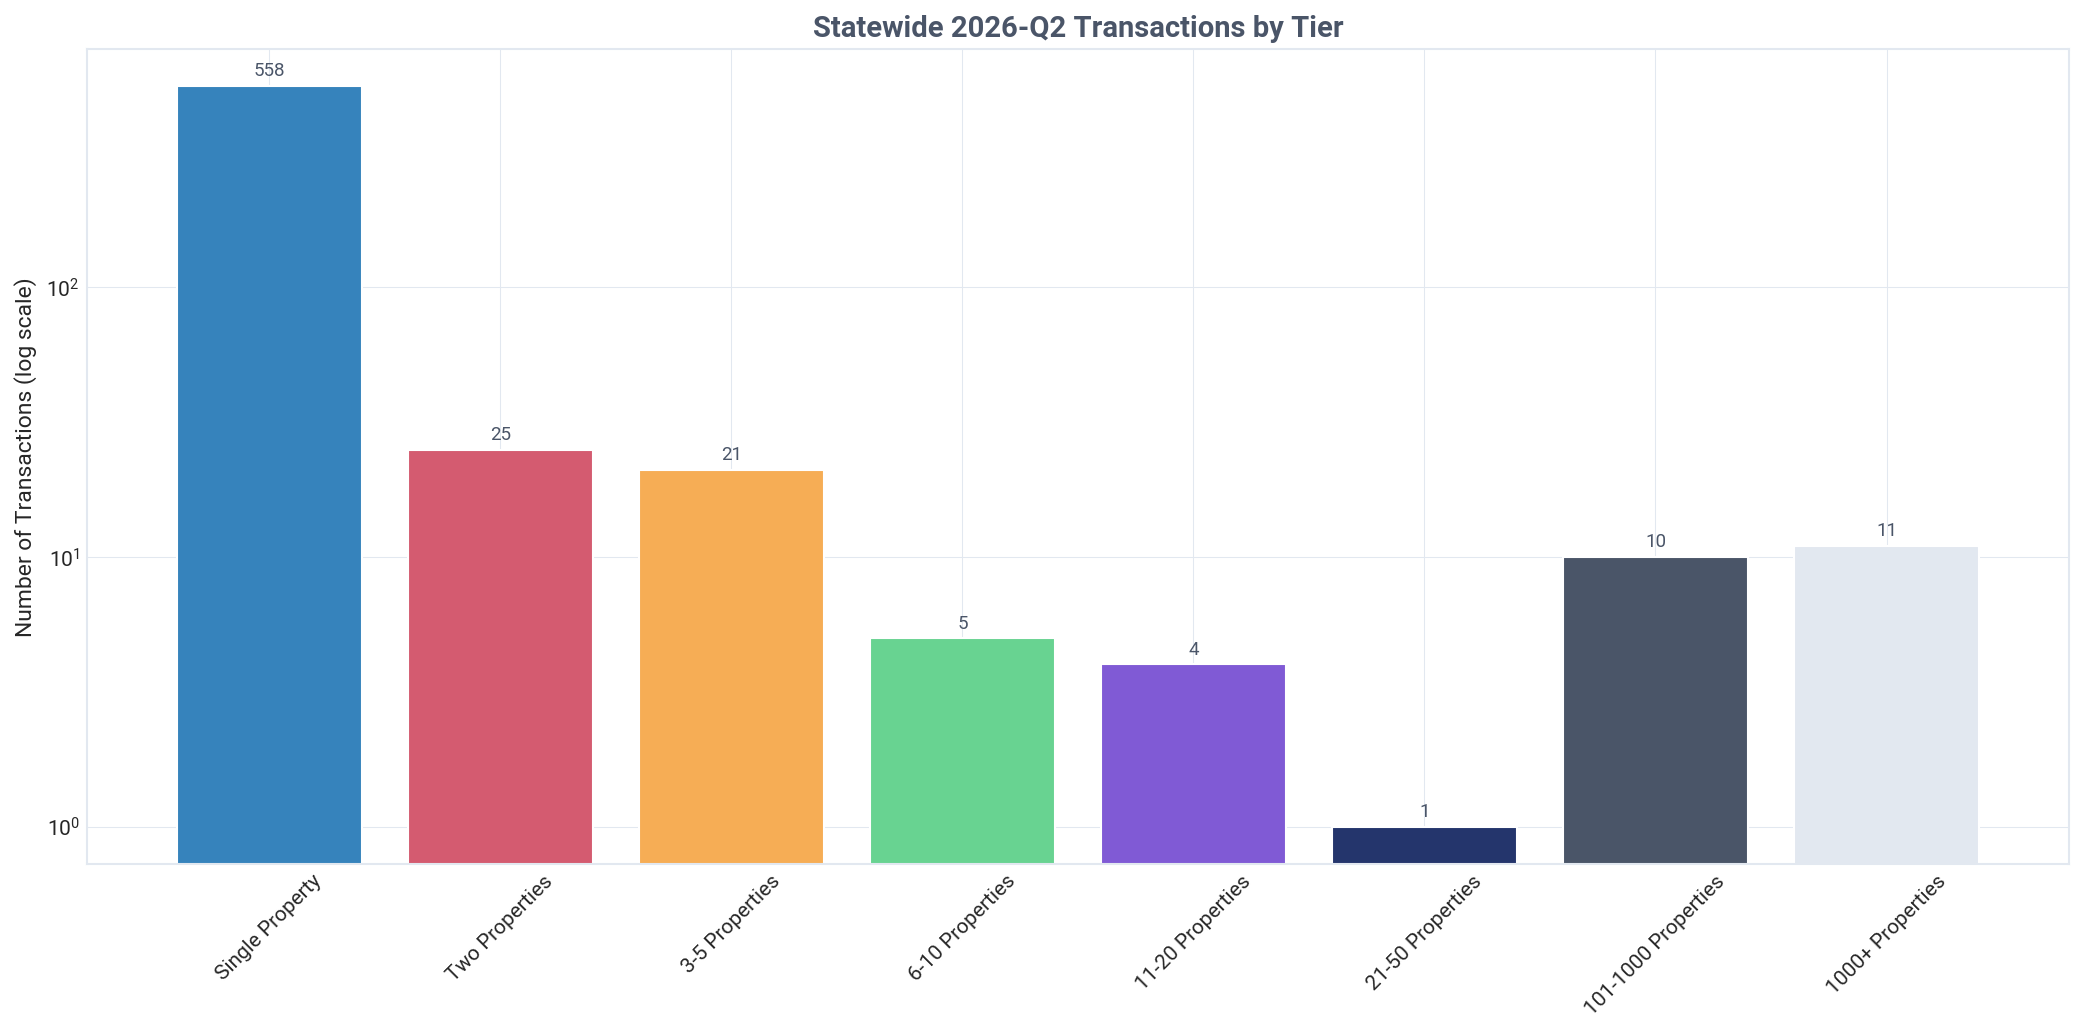
Transaction activity was overwhelmingly concentrated among the smallest investors. Landlords in the single-property tier conducted 558 transactions, representing 87.9% of all investor activity. This mirrors the purchasing trends and confirms that new and small-scale landlords are the most active players in the market.

A clear pricing hierarchy emerged among different investor tiers. New, single-property landlords paid the highest average price at $503,793. In stark contrast, institutional investors (1,000+ tier) paid an average of just $366,021. This reveals a 27.3% discount for large-scale buyers, who likely leverage their experience and resources to secure better deals.

Sourcing strategies also differed dramatically by tier. Institutional investors were highly active in the investor-to-investor market, with 54.5% of their 11 purchases coming from other landlords. This suggests a focus on acquiring established rental properties. Conversely, only 3.2% of purchases by new single-property investors were from other landlords, indicating they primarily buy from the open market, often from traditional homeowners.

The price for mid-size landlords shows a clear downward trend as portfolio size increases. For example, the 3-5 property tier paid $359,258 on average, and the 6-10 tier paid just $301,031. This pattern suggests that more experienced investors with larger portfolios are more disciplined or skilled in acquiring properties below the prices paid by market newcomers.

Alaska: landlord share of transactions, Q2 2026
Alaska: transactions by tier this quarter, Q2 2026
Alaska: average purchase price by tier, Q2 2026

Ready to leverage this data for your real estate investment decisions?

TALK TO AN EXPERT

Executive Summary

Alaska's Housing Market Defined by Small Landlords Owning 99% of Rentals and Driving 29% of Sales
Holdings
Investors own 42,007 single-family homes in Alaska, representing 26.7% of the total market. The portfolio is dominated by individual investors, who hold 91.6% (38,488 properties) compared to just 10.3% (4,326 properties) for companies.
Pricing
In Q2 2026, landlords acquired properties for 5.5% less than traditional homeowners, securing an average discount of $29,013 per home ($499,870 vs. $528,883). This price gap has narrowed from 11.3% in the prior quarter.
Activity
Landlords purchased 456 homes in Q2 2026, accounting for 29.4% of all SFR sales in Alaska. The market saw significant growth from new entrants, with 557 single-property landlord entities making their first purchase.
Market Share
The market is overwhelmingly controlled by small investors, with mom-and-pop landlords (1-10 properties) owning 99.0% of all investor-held SFRs. In contrast, institutional investors (1,000+ properties) control a mere 0.2%.
Ownership Type
Individual investors command smaller portfolios, but companies become the majority owners in the 6-10 property tier. This trend accelerates in larger portfolios, with companies owning over 99% of properties in the 21-50 tier.
Transactions
Landlords are aggressive net buyers with a 9.92x buy-to-sell ratio in Q2 2026 (635 buys vs. 64 sells). Institutional investors are also net buyers, though their activity is minimal (11 buys vs. 9 sells).
Market Narrative

The single-family rental market in Alaska is characterized by the overwhelming dominance of small, independent investors. Landlords own 42,007 SFR properties, a substantial 26.7% of the state's total housing stock. This portfolio is not controlled by large corporations; instead, 99.0% of it is in the hands of mom-and-pop landlords with 1-10 properties. Individual investors make up the vast majority of owners, holding 91.6% of all rental homes, while institutional firms with over 1,000 properties own a negligible 0.2%. This structure defines a highly decentralized market, reliant on the activity of tens of thousands of individual operators. Insights for this investor pulse report are drawn from comprehensive public records, including demographic data.

Investor behavior in Q2 2026 underscored this dynamic. Landlords were a driving force in the sales market, acquiring 29.4% of all homes sold. This activity was fueled by new entrants, with 557 single-property landlord entities joining the market. While active, investors still demonstrated purchasing discipline, paying an average of 5.5% less than traditional homeowners. Transaction patterns reveal a market in a strong accumulation phase, with landlords buying nearly 10 properties for every one they sold. This bullish stance signals deep confidence in the long-term value of Alaska's residential real estate.

The key takeaway from this data is that Alaska's rental housing supply is provided by a grassroots network of local investors, not Wall Street firms. The market's health and growth depend on the ability of these small players to enter and expand. While institutional investors show different strategies, such as paying less and buying from other landlords, their tiny footprint makes them a non-factor in the broader market. The trends suggest continued growth driven by small investors, shaping a competitive and highly fragmented rental landscape across the state.

About This Report

Report Methodology

This report analyzes BatchData's Investor Pulse dataset, covering single-family residential (SFR) investor activity across the United States.

Data is extracted from 15 CSV files covering ownership, transactions, and pricing trends, then analyzed using AI-powered insights.

Property Counting Methodology:

Distinct Counts: All headline totals represent distinct properties. If 2+ landlords co-own the same property, it's counted only once. This provides accurate market representation.

Category Breakdowns: When analyzing by tier (01-09), owner type (Individual/Corporate), or occupancy status, properties with co-ownership across categories are counted once per category. This causes breakdowns to sum 2-4% higher than totals, and percentages may sum to 100-104%. This is expected and reflects co-ownership patterns.

Tier Properties Category
01-041-10Mom-and-Pop
05-0711-100Mid-Size
08101-1000Large
091000+Institutional
About BatchData

BatchData provides comprehensive real estate data and analytics, offering insights into property ownership, investor activity, and market trends across the United States.

The Investor Pulse dataset tracks single-family residential (SFR) investor behavior at national, state, county, and MSA levels.

For more information, visit batchdata.io or explore our API documentation.

Data Freshness
Report Generated October 28, 2026 at 11:12 PM
Data Period Q2 2026
Geography Level State
Geography Alaska
×
Chart Section2 Coverage
Alaska: SFR vs other property coverage, Q2 2026
×
Chart Section3 Ownership Donut
Alaska: SFR ownership share, company vs individual, Q2 2026
×
Chart Section3 Ownership Bar
Alaska: SFR properties by owner type, Q2 2026
×
Chart Section4 Distribution
Alaska: company vs individual landlords, Q2 2026
×
Chart Section5 Holdings
Alaska: landlord SFR holdings by type, Q2 2026
×
Chart Section6 Prices
Alaska: properties purchased by timeframe, Q2 2026
×
Chart Section6 Prices Alt
Alaska: average acquisition price by timeframe, Q2 2026
×
Chart Section6 Yoy Comparison
Alaska: average acquisition price year over year, Q2 2026
×
Chart Section6 Trends
Alaska: average acquisition price by buyer type, Q2 2026
×
Chart Section7 Purchases
Alaska: purchases by tier, Q2 2026
×
Chart Section7 Tiers
Alaska: purchased property share by tier, Q2 2026
×
Chart Section8 Distribution
Alaska: current ownership by purchase tier, Q2 2026
×
Chart Section8 Prices
Alaska: properties purchased by tier, all time, Q2 2026
×
Chart Section8 Prices Q4
Alaska: properties purchased by tier this quarter, Q2 2026
×
Chart Section8 Prices 2020
Alaska: properties purchased by tier, historical, Q2 2026
×
Chart Section8 Yoy Comparison
Alaska: properties purchased by tier year over year, Q2 2026
×
Chart Section9 Ownership
Alaska: ownership by tier and owner type, Q2 2026
×
Chart Section9 Growth
Alaska: company purchases by tier, all time, Q2 2026
×
Chart Section9 Growth Q4
Alaska: company purchases by tier this quarter, Q2 2026
×
Chart Section9 Yoy Comparison
Alaska: company purchases by tier year over year, Q2 2026
×
Chart Section10 Top Regions
Alaska: top 15 areas by landlord-owned properties, Q2 2026
×
Chart Section10 Top Pct
Alaska: top 15 areas by landlord ownership share, Q2 2026
×
Chart Section10 Map
Alaska: landlord ownership map, Q2 2026
×
Chart Section11 Buysell
Alaska: landlord buy and sell transactions, Q2 2026
×
Chart Section11 Buysell Price
Alaska: landlord average buy and sell prices, Q2 2026
×
Chart Section11 Yoy All Landlords
Alaska: landlord transactions year over year, Q2 2026
×
Chart Section11 Institutional
Alaska: 1000+ tier company transactions, Q2 2026
×
Chart Section11 Institutional Price
Alaska: 1000+ tier company average prices, Q2 2026
×
Chart Section11 Yoy Institutional
Alaska: 1000+ tier transactions year over year, Q2 2026
×
Chart Section12 Transactions
Alaska: landlord share of transactions, Q2 2026
×
Chart Section12 Prices
Alaska: transactions by tier this quarter, Q2 2026
×
Chart Section12 Prices Detail
Alaska: average purchase price by tier, Q2 2026

Licensing & Usage Rights

This report, data, and all visual analyses are the property of BatchData © 2026 BatchService, Inc. and are licensed under Creative Commons Attribution-NonCommercial-NoDerivatives 4.0 International (CC BY-NC-ND 4.0).

You MAY: Download, share, or excerpt this content for personal or non-commercial purposes, provided you give clear attribution to BatchData with a link back to this original page.

You MAY NOT: Use this data commercially, resell or redistribute it as your own, or publish modified versions.

For commercial licensing: batchdata.io/contact-sales

Creative Commons BY-NC-ND 4.0 - creativecommons.org/licenses/by-nc-nd/4.0/

How to cite this report

BatchData. (2026). Q2 2026 AK State Report. BatchService, Inc. Retrieved from https://reports.batchdata.io/investorpulse-reports/2026-q2-state-ak/. Licensed under CC BY-NC-ND 4.0.