Minnesota Investor Pulse Report (2025-Q4)

Real Estate comprehensive investment analysis of investor activity in the Minnesota single-family residential housing market. Discover ownership trends, transaction patterns, and market insights.

Market Overview

Total SFR Properties in Minnesota
1,701,713
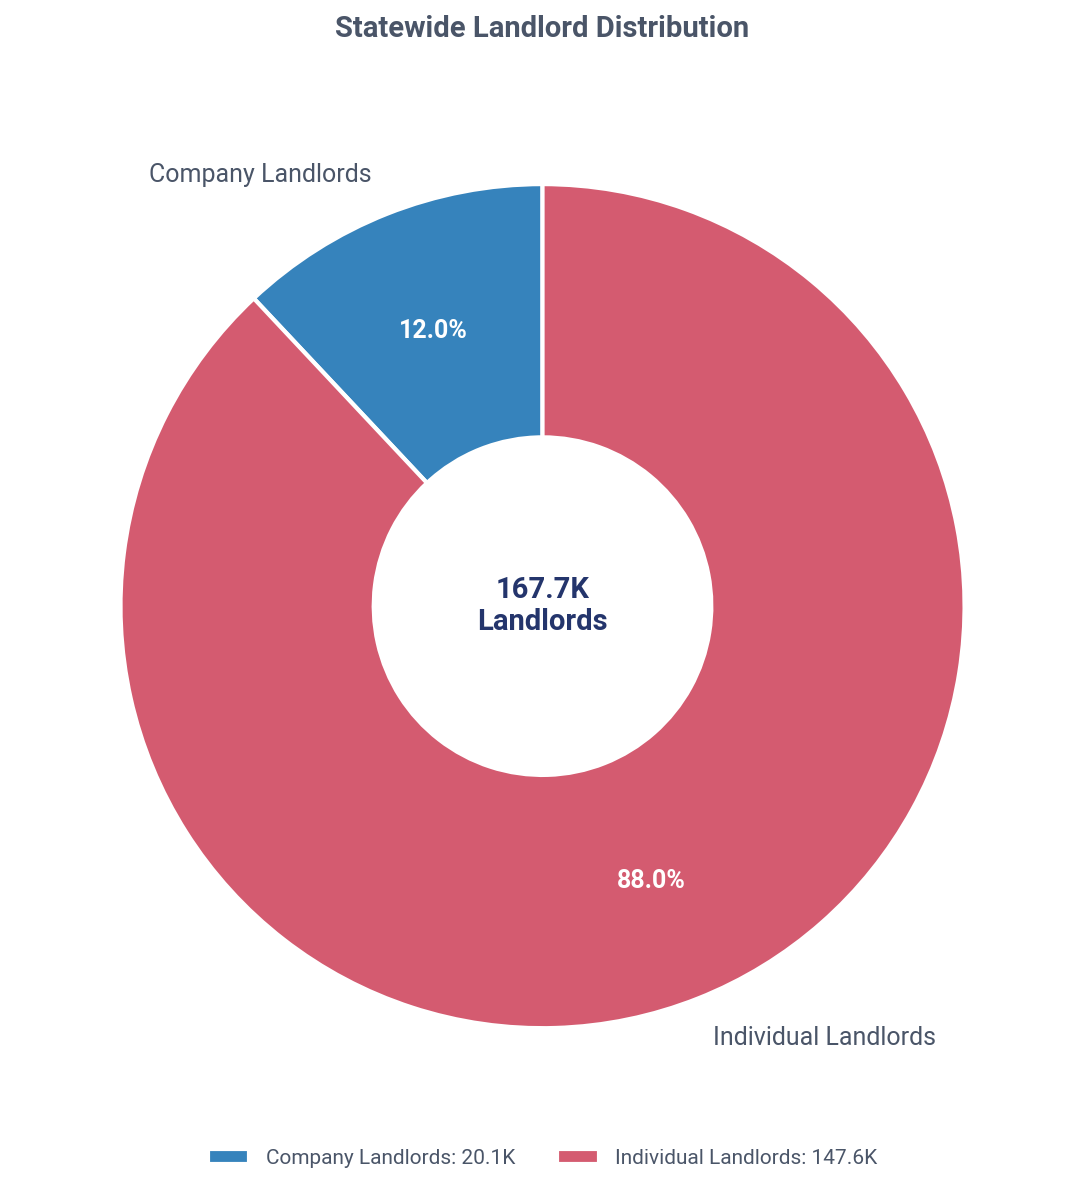
Total Investors in Minnesota
167,682
Investor Owned SFR in Minnesota
151,741(8.9%)
Individual Landlords
Landlords
147,572
SFR Owned
114,812
Corporate Landlords
Landlords
20,110
SFR Owned
39,000
Understanding Property Counts

Distinct Count Methodology: The total 151,741 represents distinct properties — if 2+ landlords co-own the same property, it's counted only once. This provides the most accurate representation of investor-owned SFR properties.

Why totals don't sum: When broken down by Individual vs Corporate ownership (or by tier), properties with co-ownership across categories are counted once per category. For example, if a property is co-owned by an individual AND a corporate landlord, it appears in both counts. This is why Individual + Corporate totals may exceed the distinct total by 2-4%, and percentages may sum to 100-104%.

Market Visualization

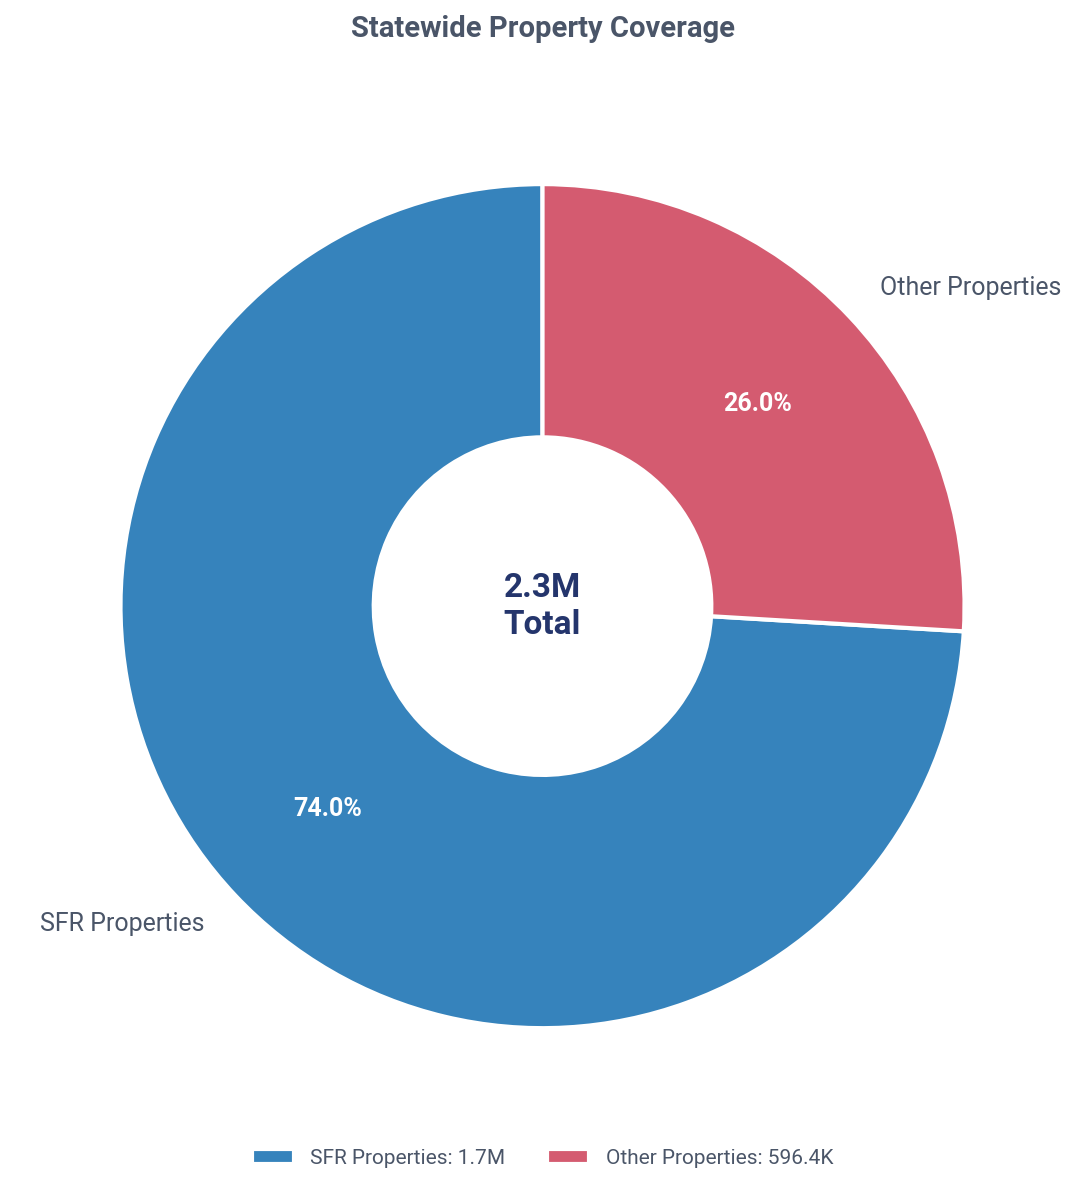
Minnesota: SFR vs other property coverage, Q4 2025
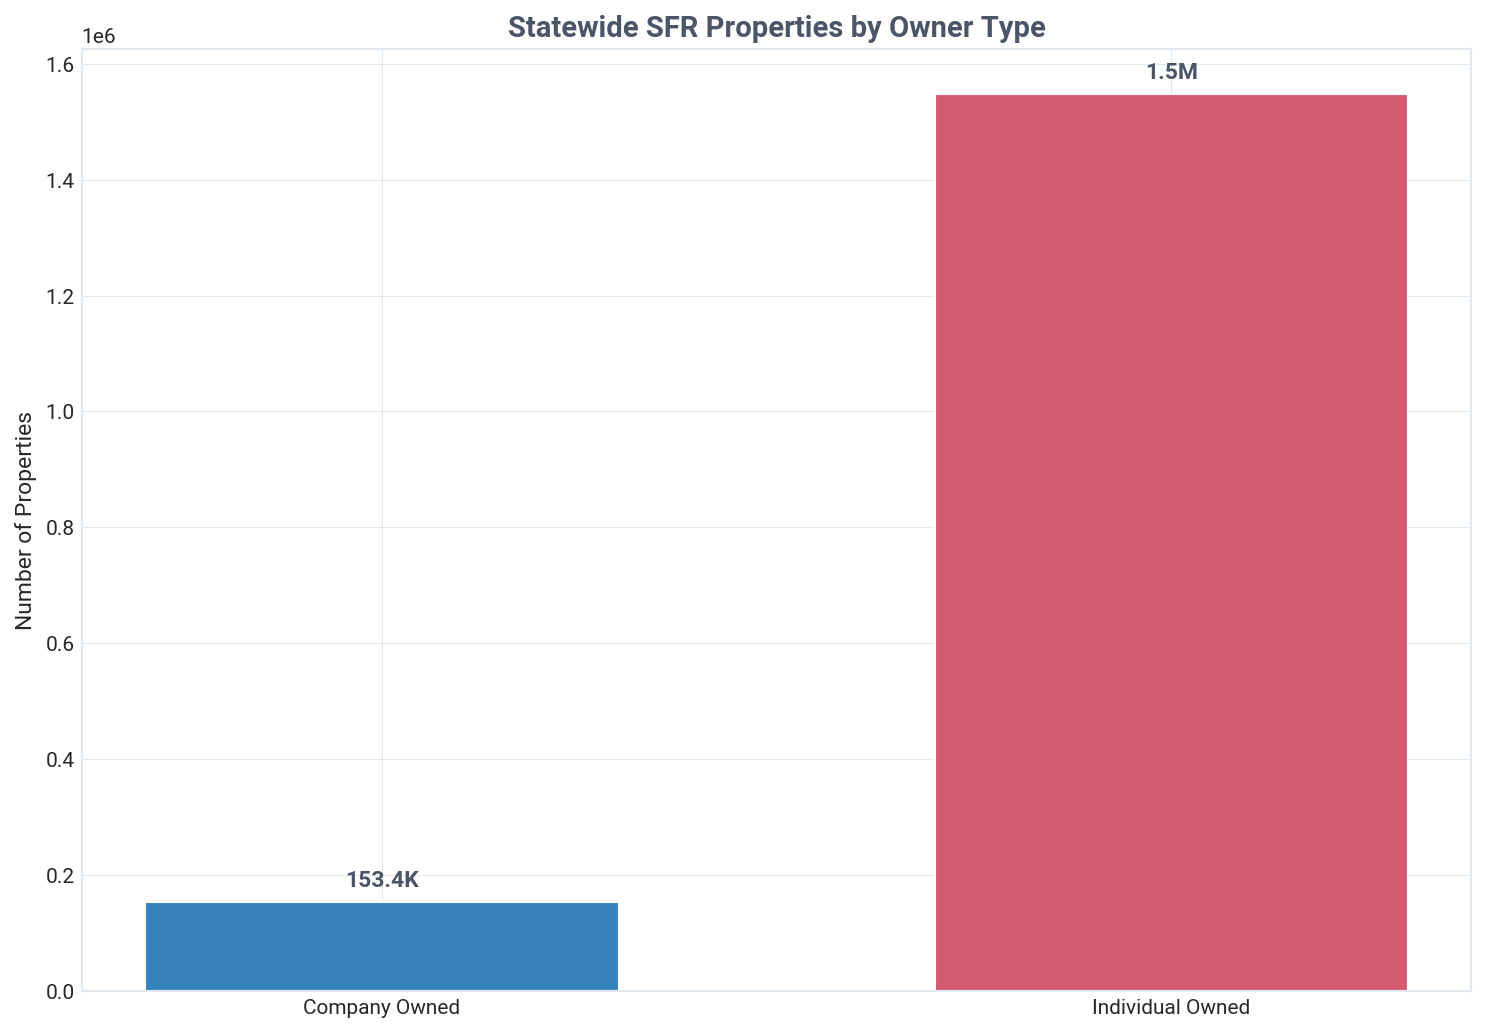
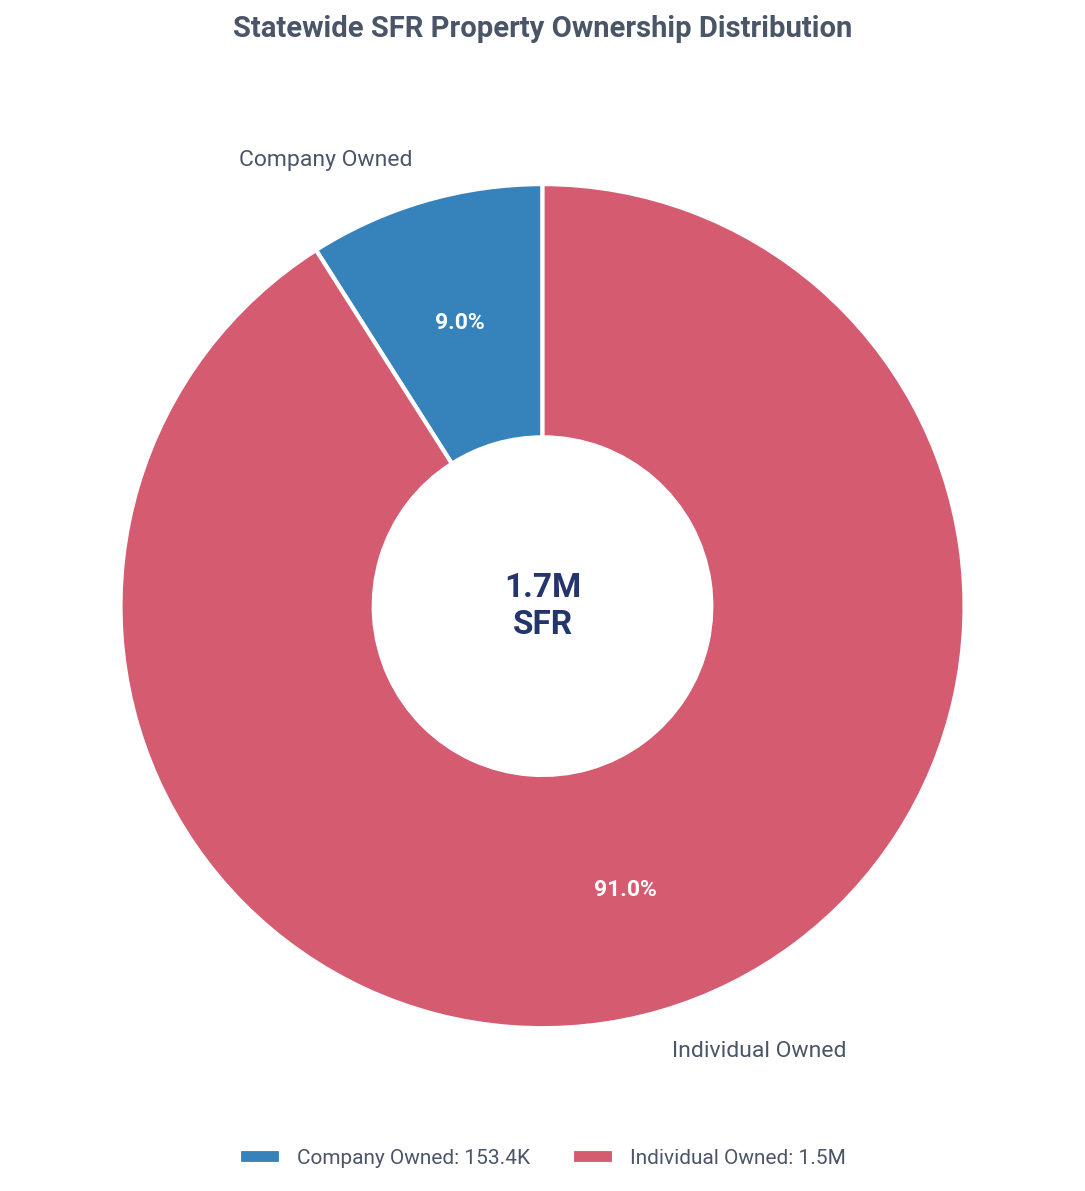
Minnesota: SFR ownership share, company vs individual, Q4 2025
Minnesota: company vs individual landlords, Q4 2025

Key Market Insights

Mom-and-Pop Investors Dominate Minnesota's SFR Market as Institutional Players Retreat
Investors own 8.9% of Minnesota's single-family homes, with mom-and-pop landlords controlling a commanding 90.5% of that portfolio versus a mere 1.0% for institutional firms. In Q4 2025, investors purchased 8.5% of homes sold at a 21.7% discount to homeowners, but strategies diverged sharply: small landlords remained strong net buyers while institutional investors were significant net sellers.
Landlord Owned Current Holdings
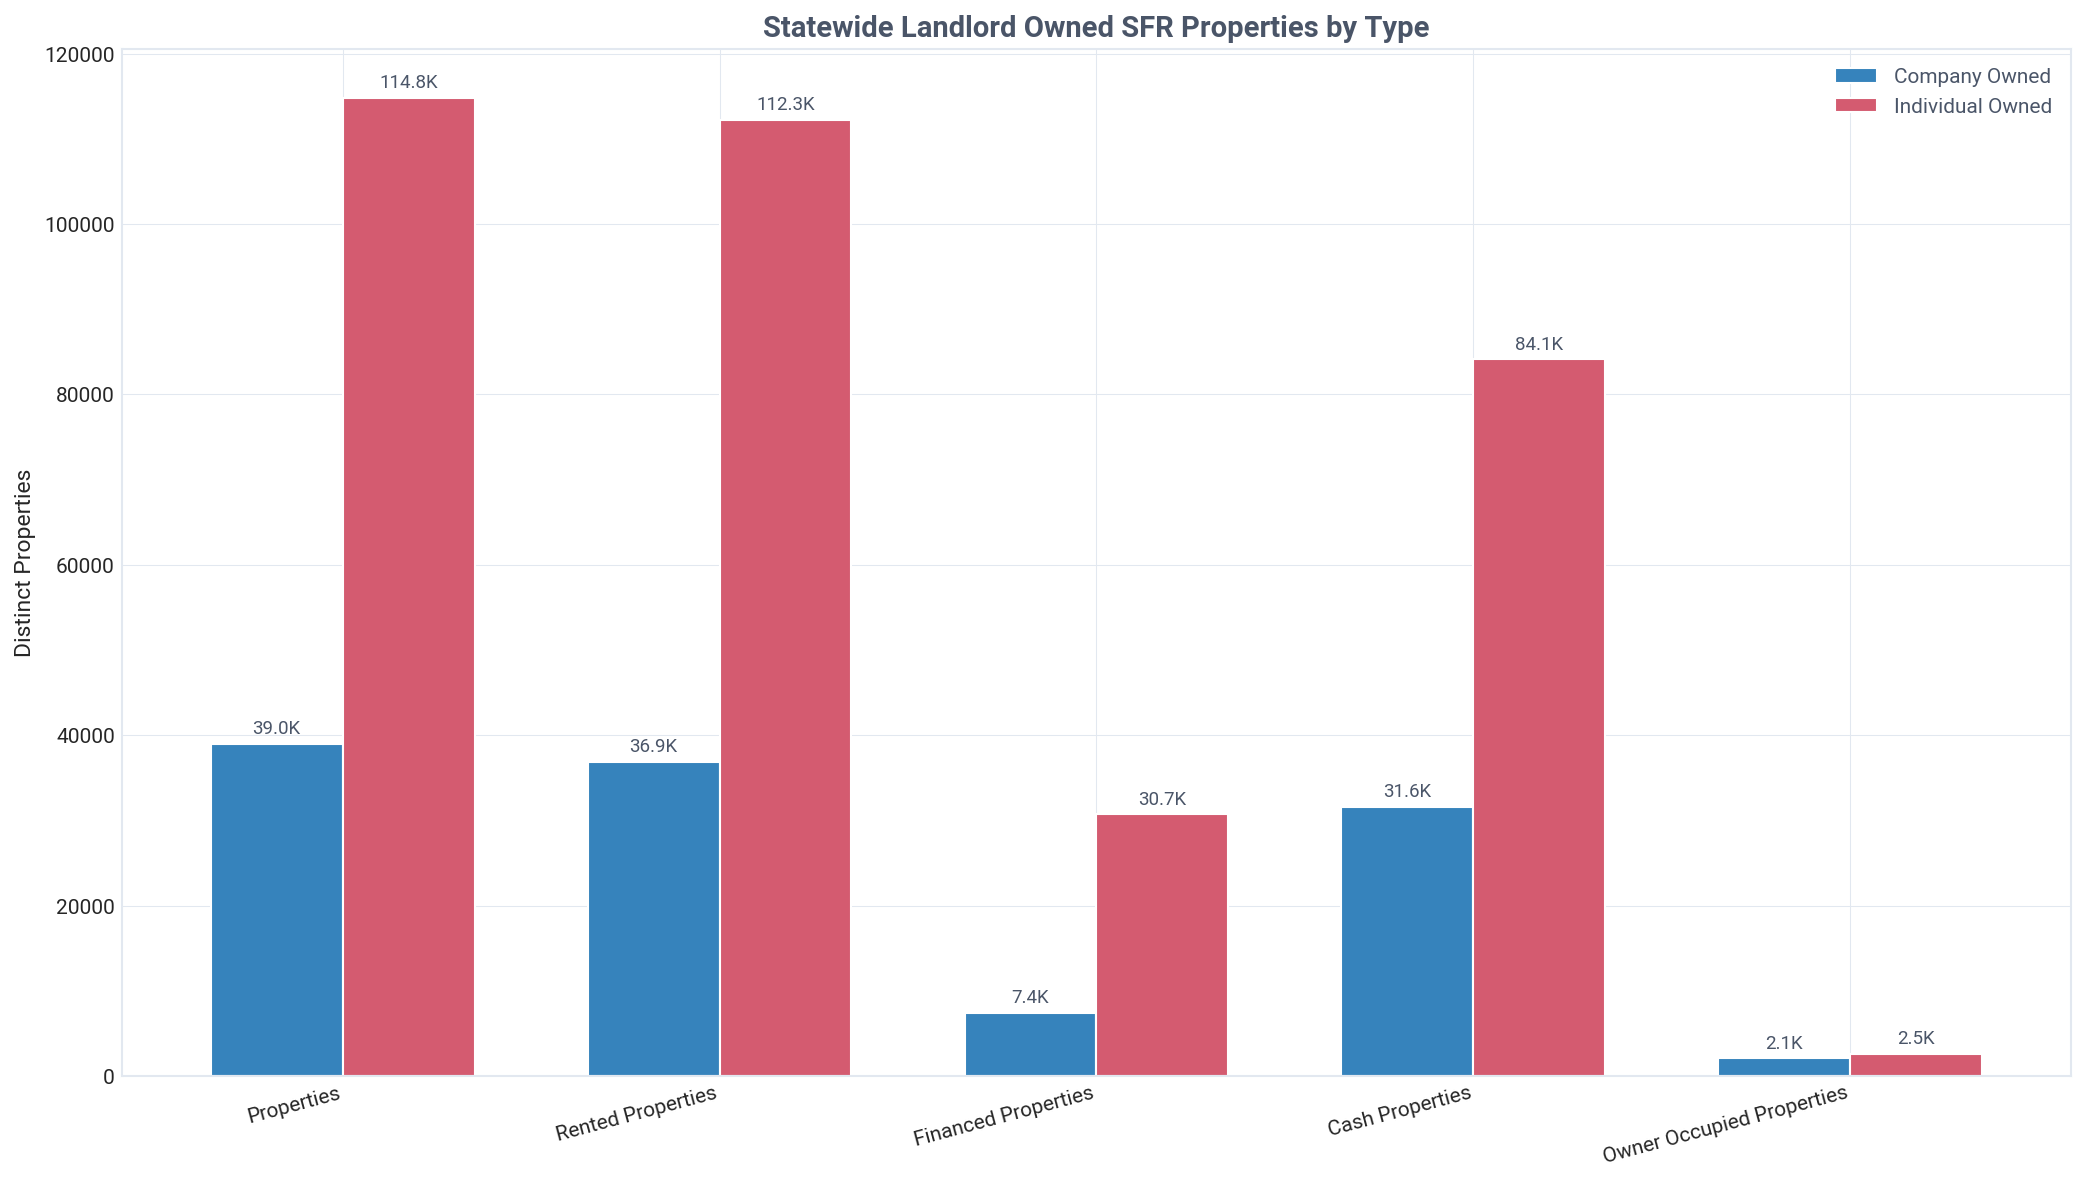
Landlords own 151,741 SFR properties in Minnesota, with individuals holding a dominant 75.7% share.
A vast majority of investor properties, 113,875, are owned outright with cash, nearly 3x the 37,866 that are financed. The portfolio is heavily rental-focused, with 147,136 properties rented out.
Landlord vs Traditional Homeowners
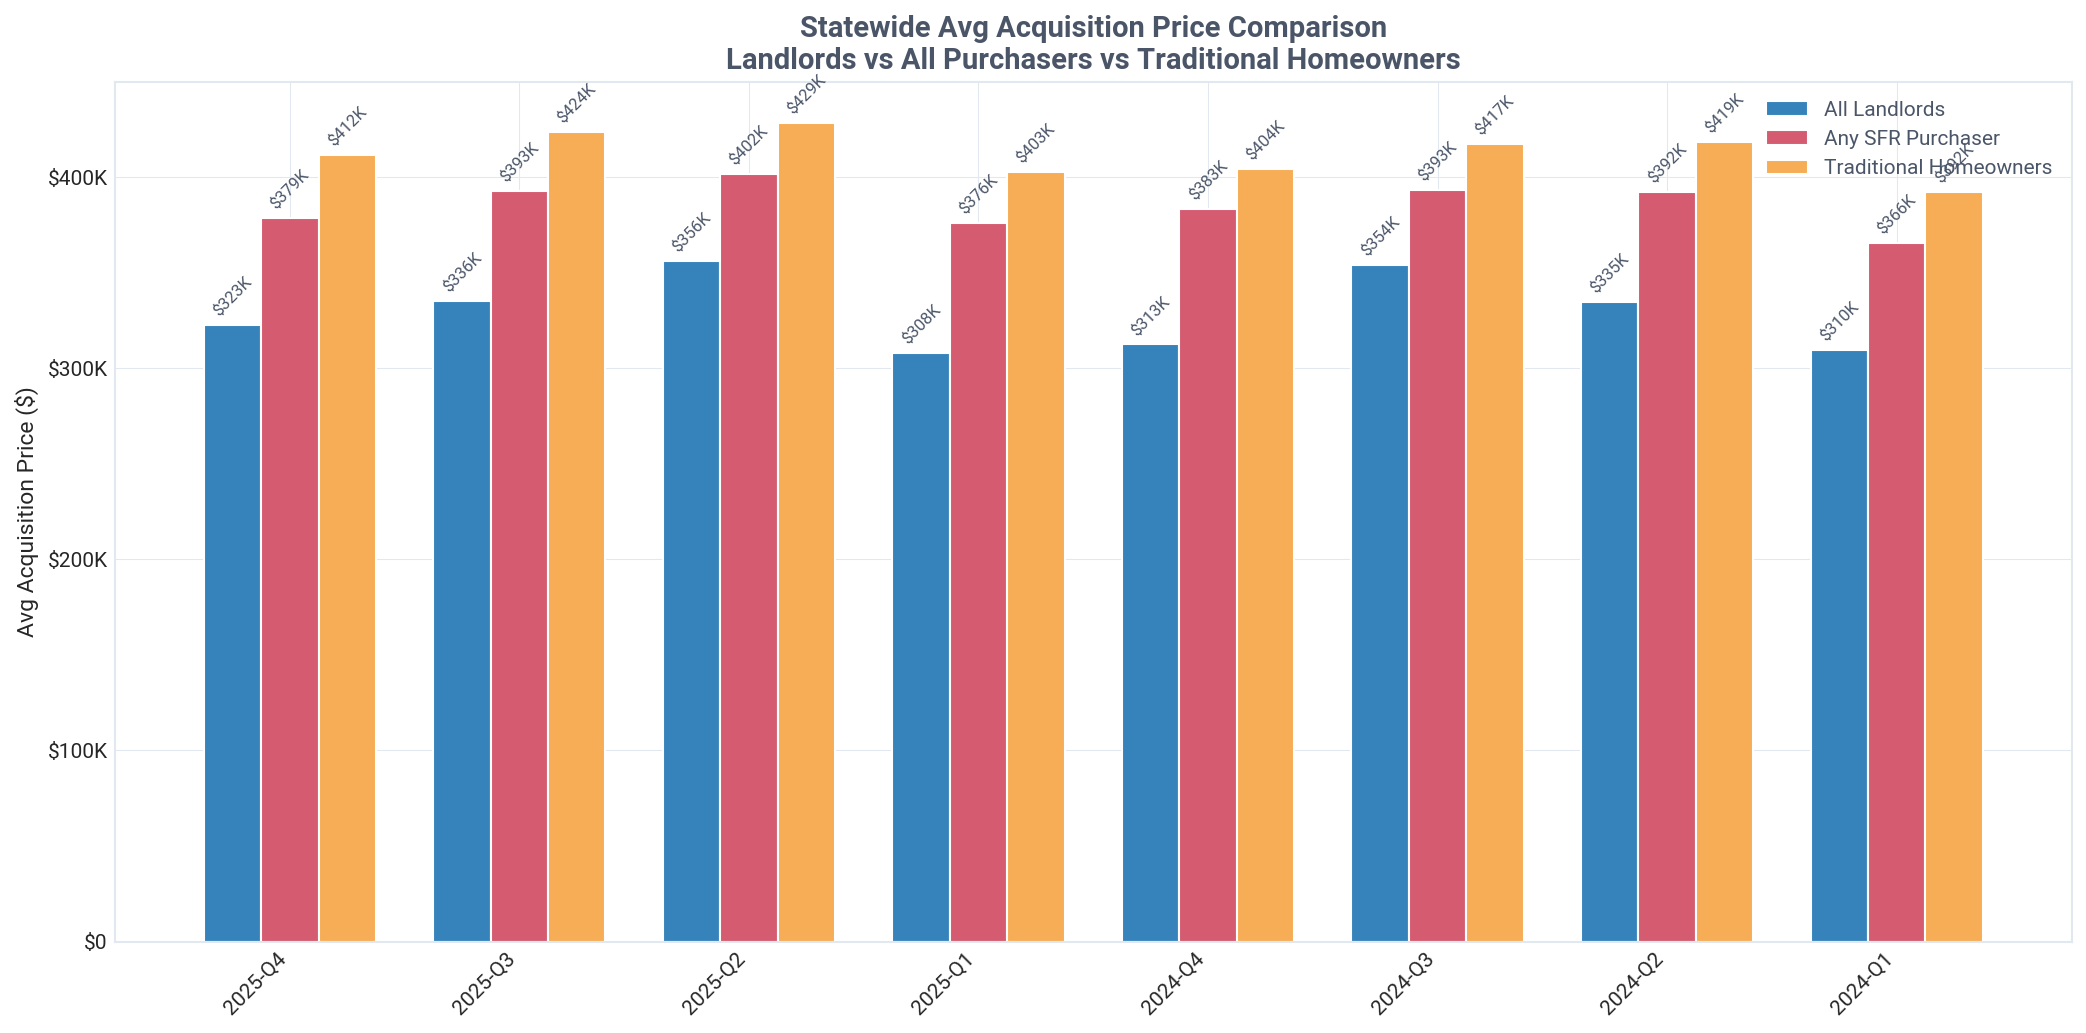
Minnesota landlords paid 21.7% less than homeowners in Q4, securing an average $89,169 discount per property.
The landlord discount widened in Q4 from 20.8% in Q3, reversing a trend of a narrowing gap seen earlier in the year. The data also reveals a significant price appreciation of 14.3% for landlords from the 2020-2023 average ($282,219) to the Q4 2025 price ($322,632).
Current Quarter Purchases
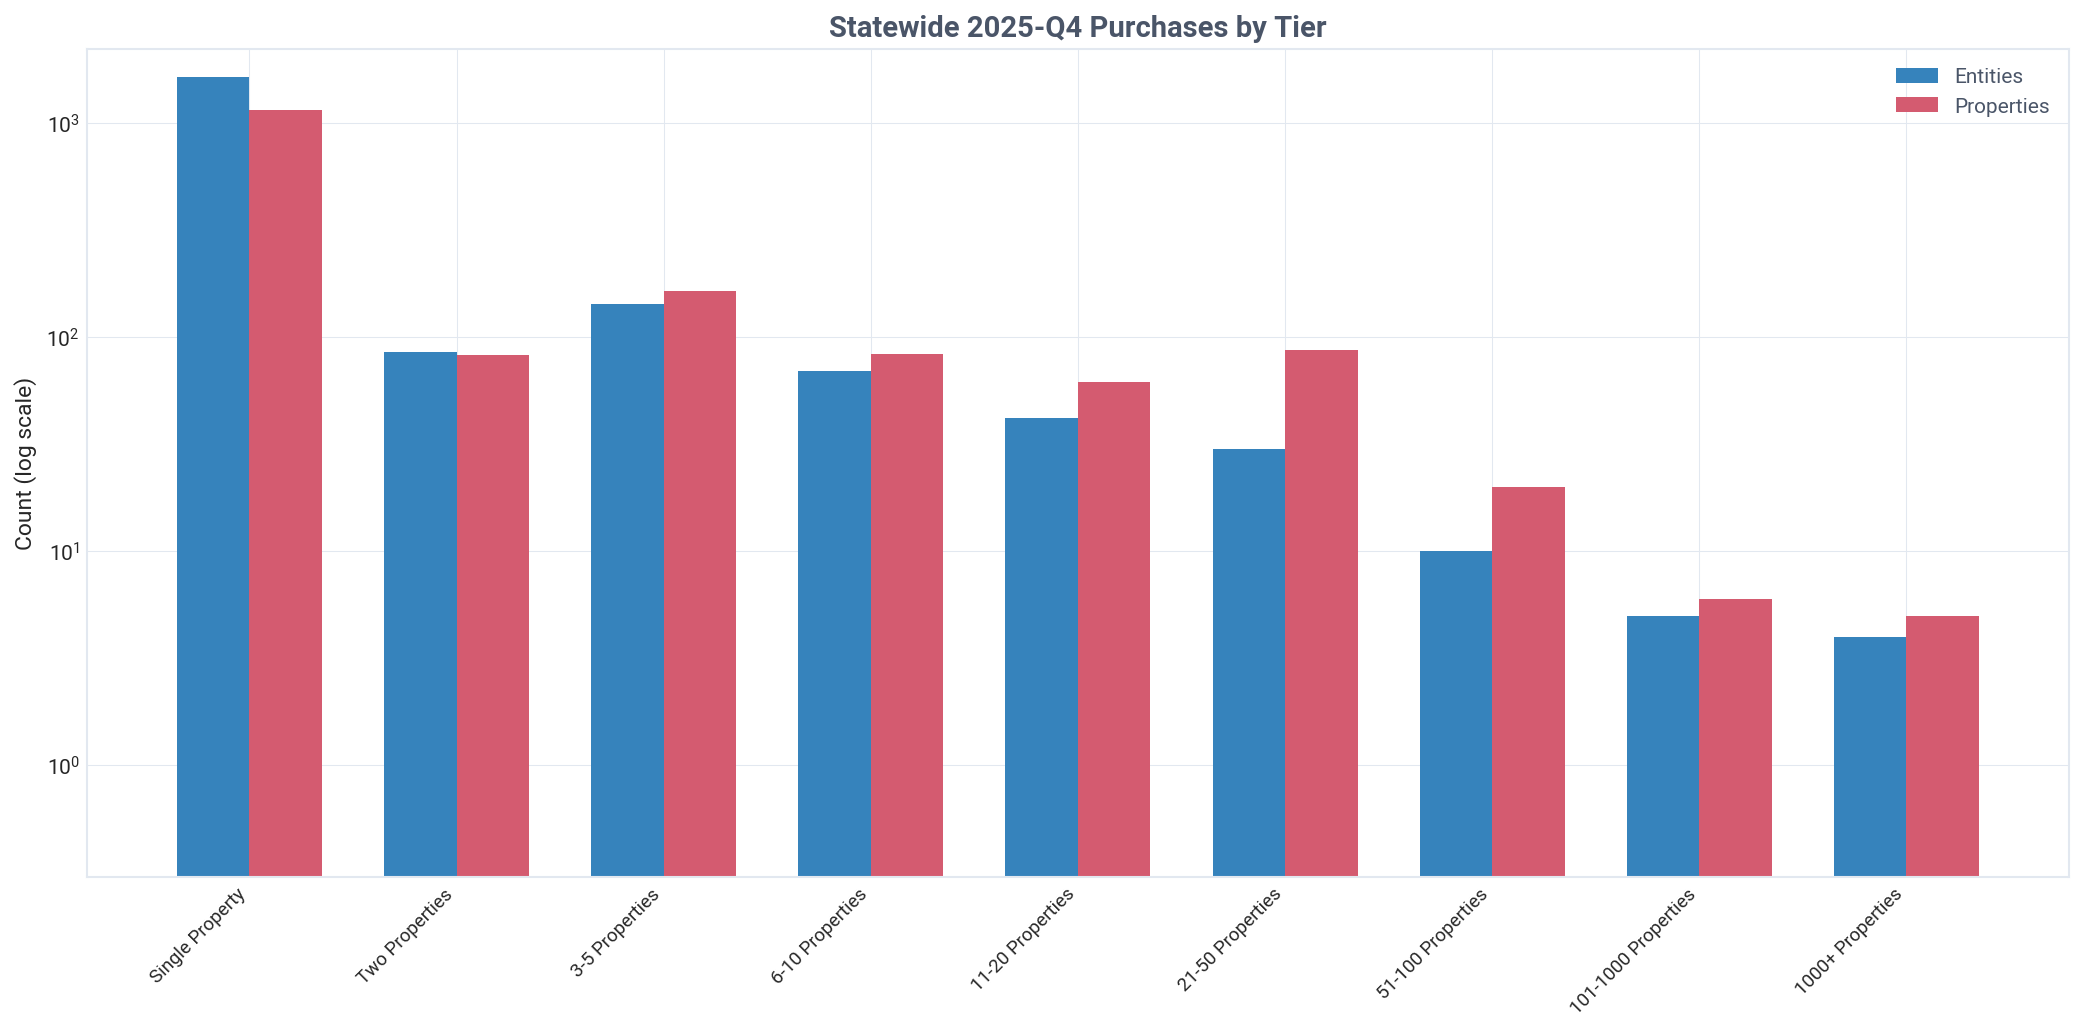
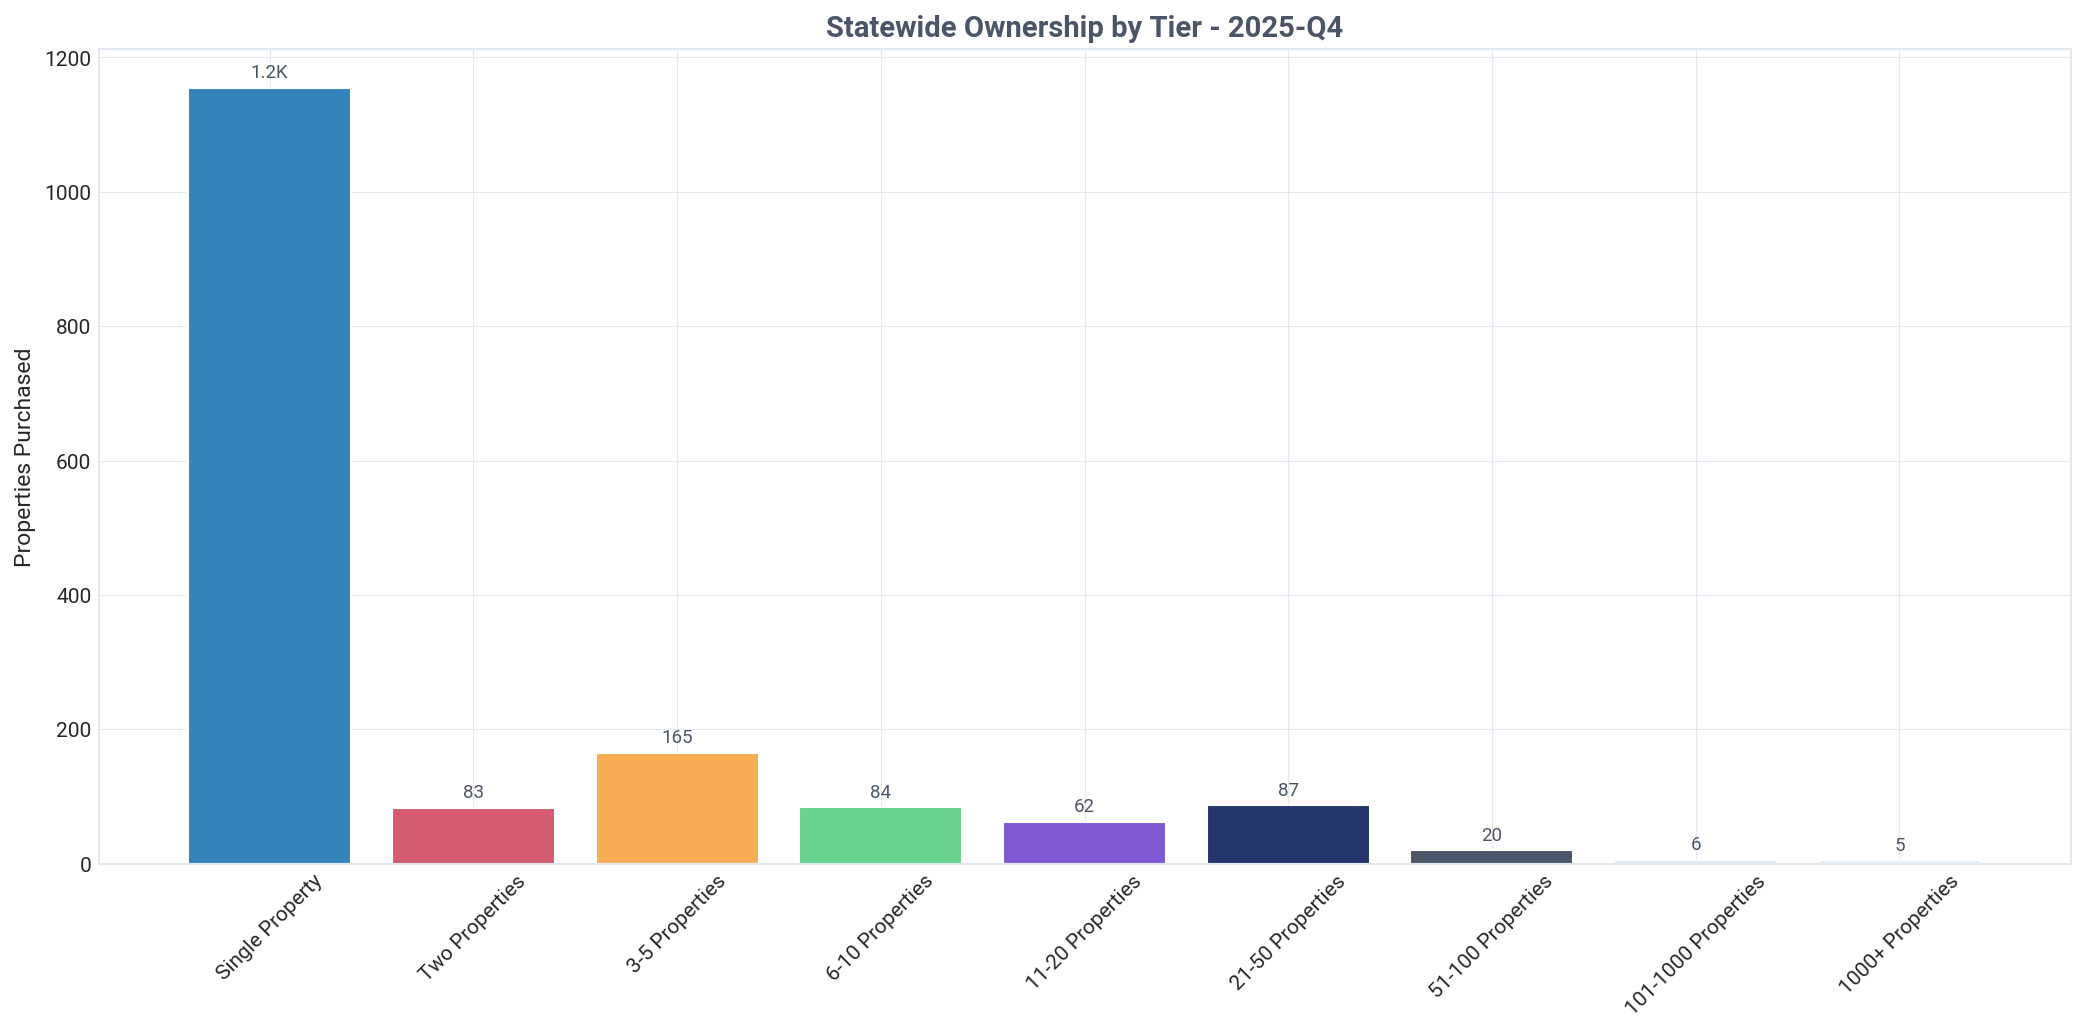
Landlords acquired 8.5% of all single-family homes sold in Minnesota during Q4, totaling 1,639 properties.
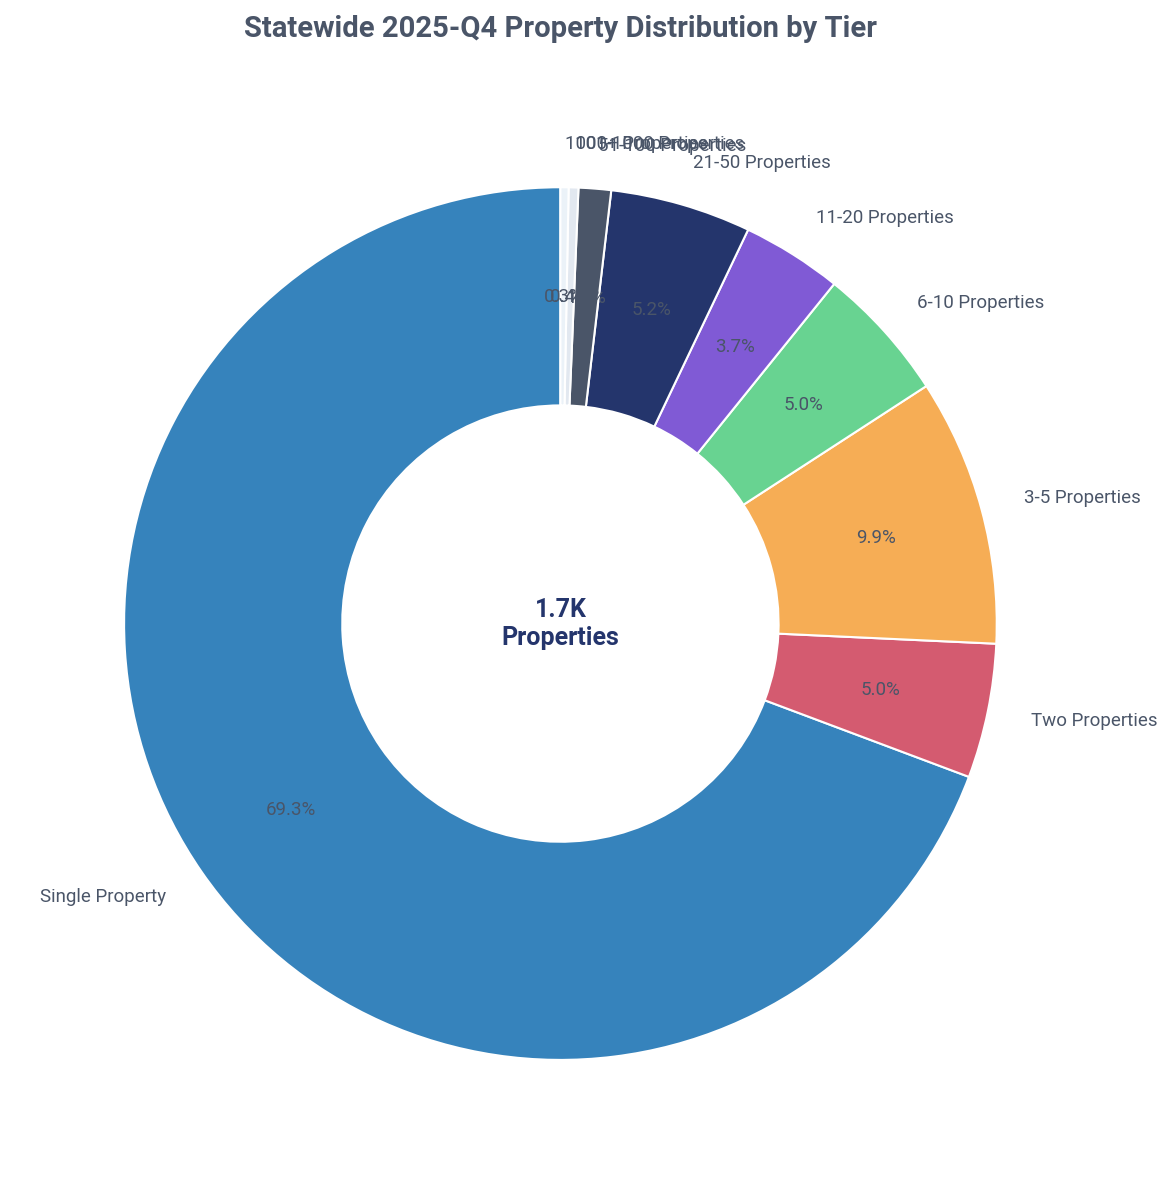
Mom-and-pop investors (1-10 properties) overwhelmingly drove Q4 activity, accounting for 90.7% of all landlord purchases. In stark contrast, institutional investors (1000+) acquired only 5 properties, representing just 0.3% of the total.
Ownership by Tier
Mom-and-pop investors (1-10 properties) control 90.5% of Minnesota's investor-owned single-family housing.
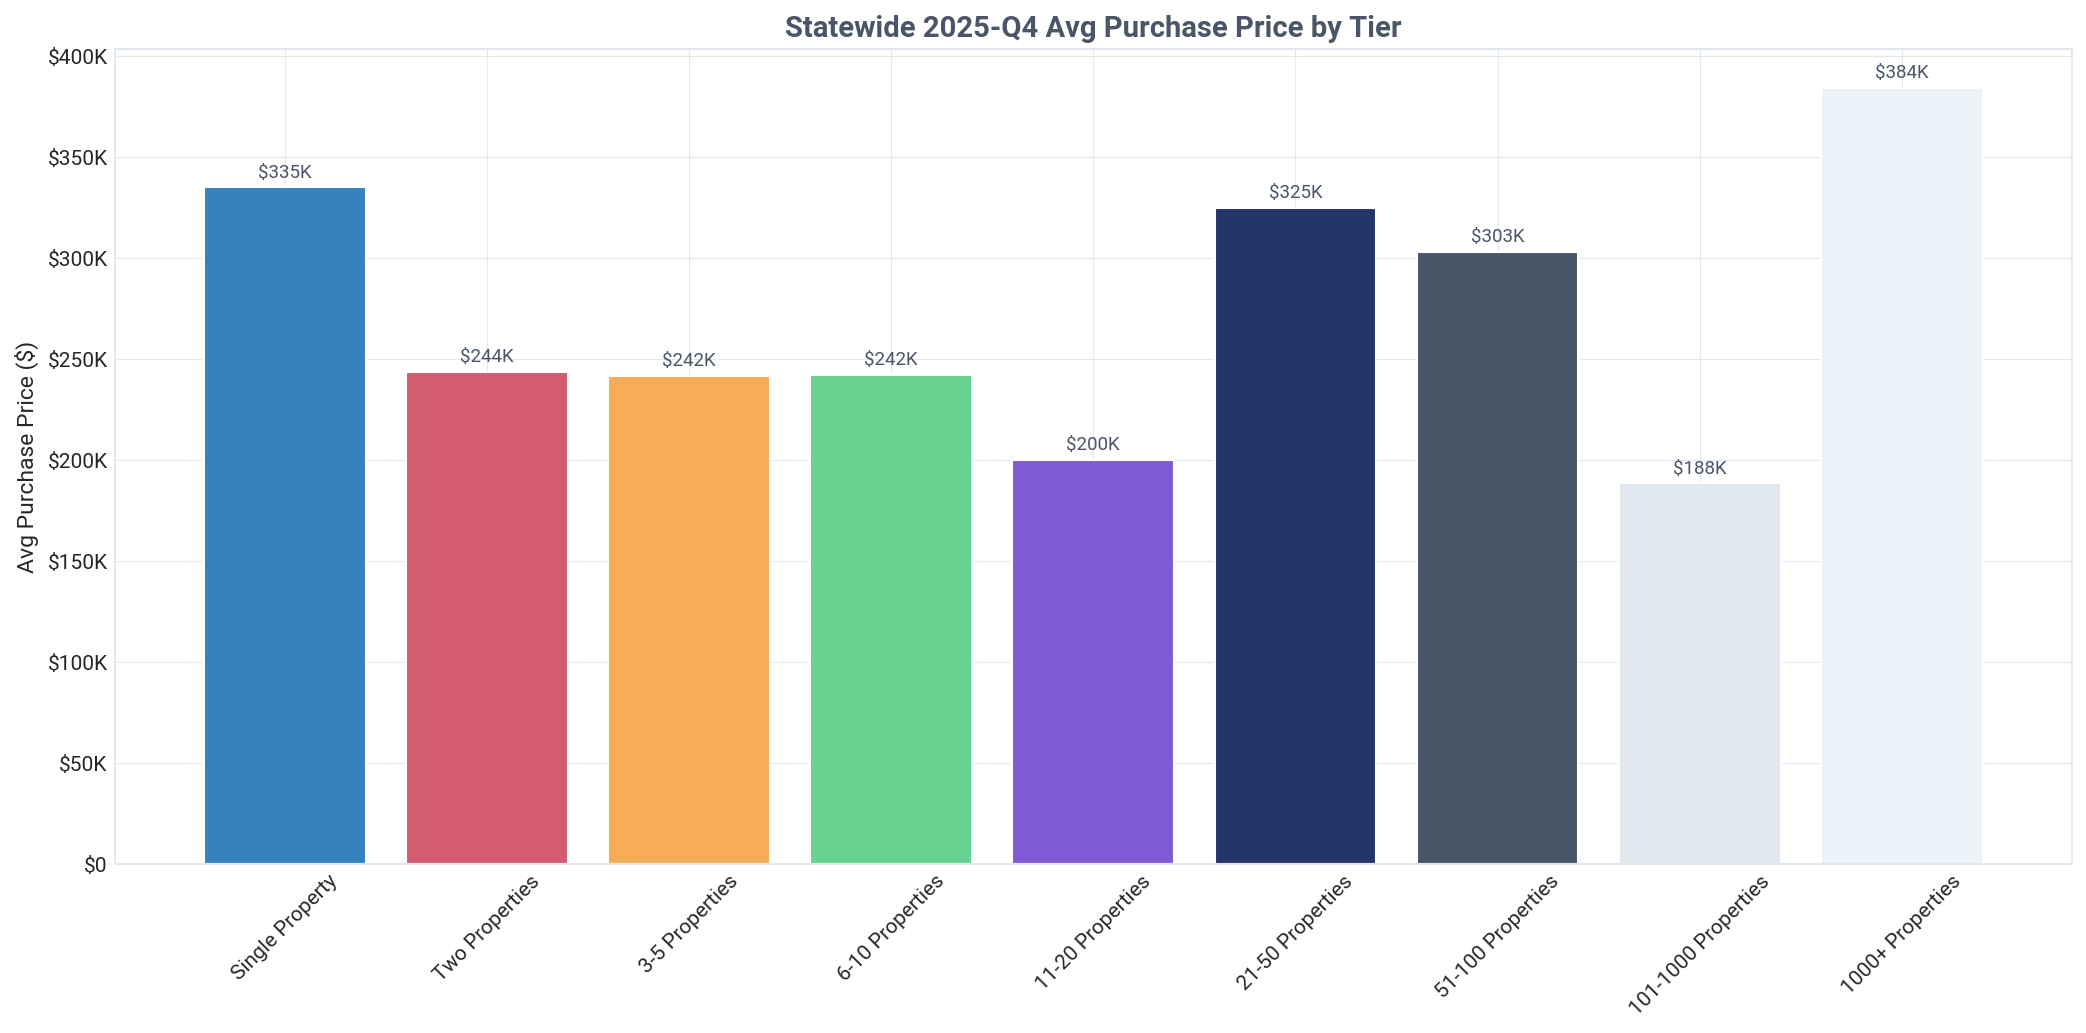
Institutional investors (1000+) hold a minimal 1.0% share of the market. Q4 transaction data shows institutional buyers paid an average of $384,410, significantly more than the $335,128 paid by new single-property landlords.
Ownership by Tier & Type
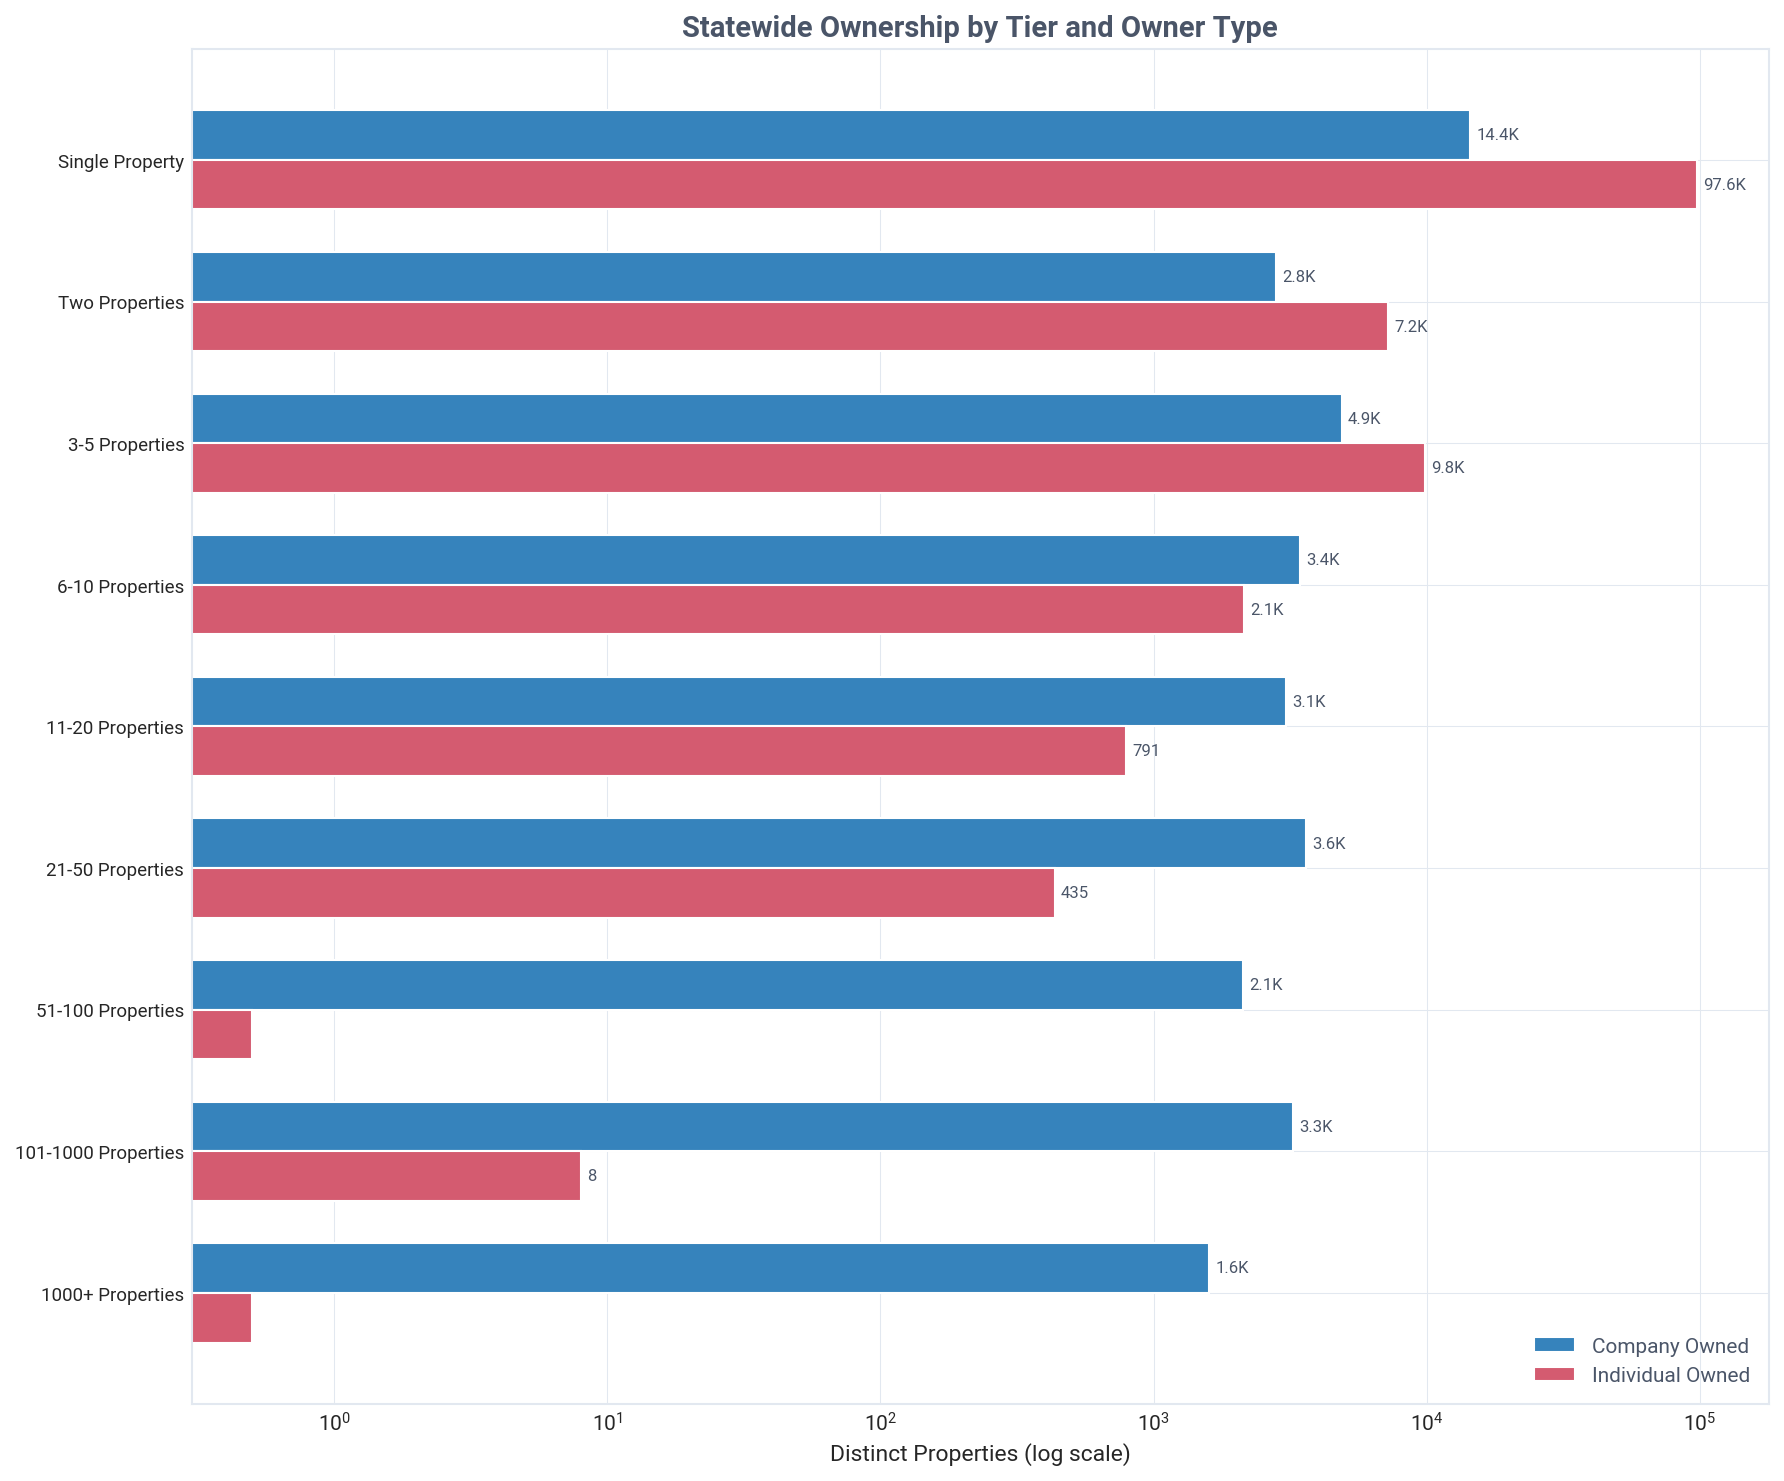
The crossover to majority-company ownership occurs at the 6-10 property tier, where companies own 61.7% of properties.
Individuals dominate smaller portfolios, owning 87.1% of single-property holdings. In contrast, companies own 99.8% of properties in the 101-1000 unit tier, showing a clear shift to corporate structures for larger portfolios.
Geographic Distribution
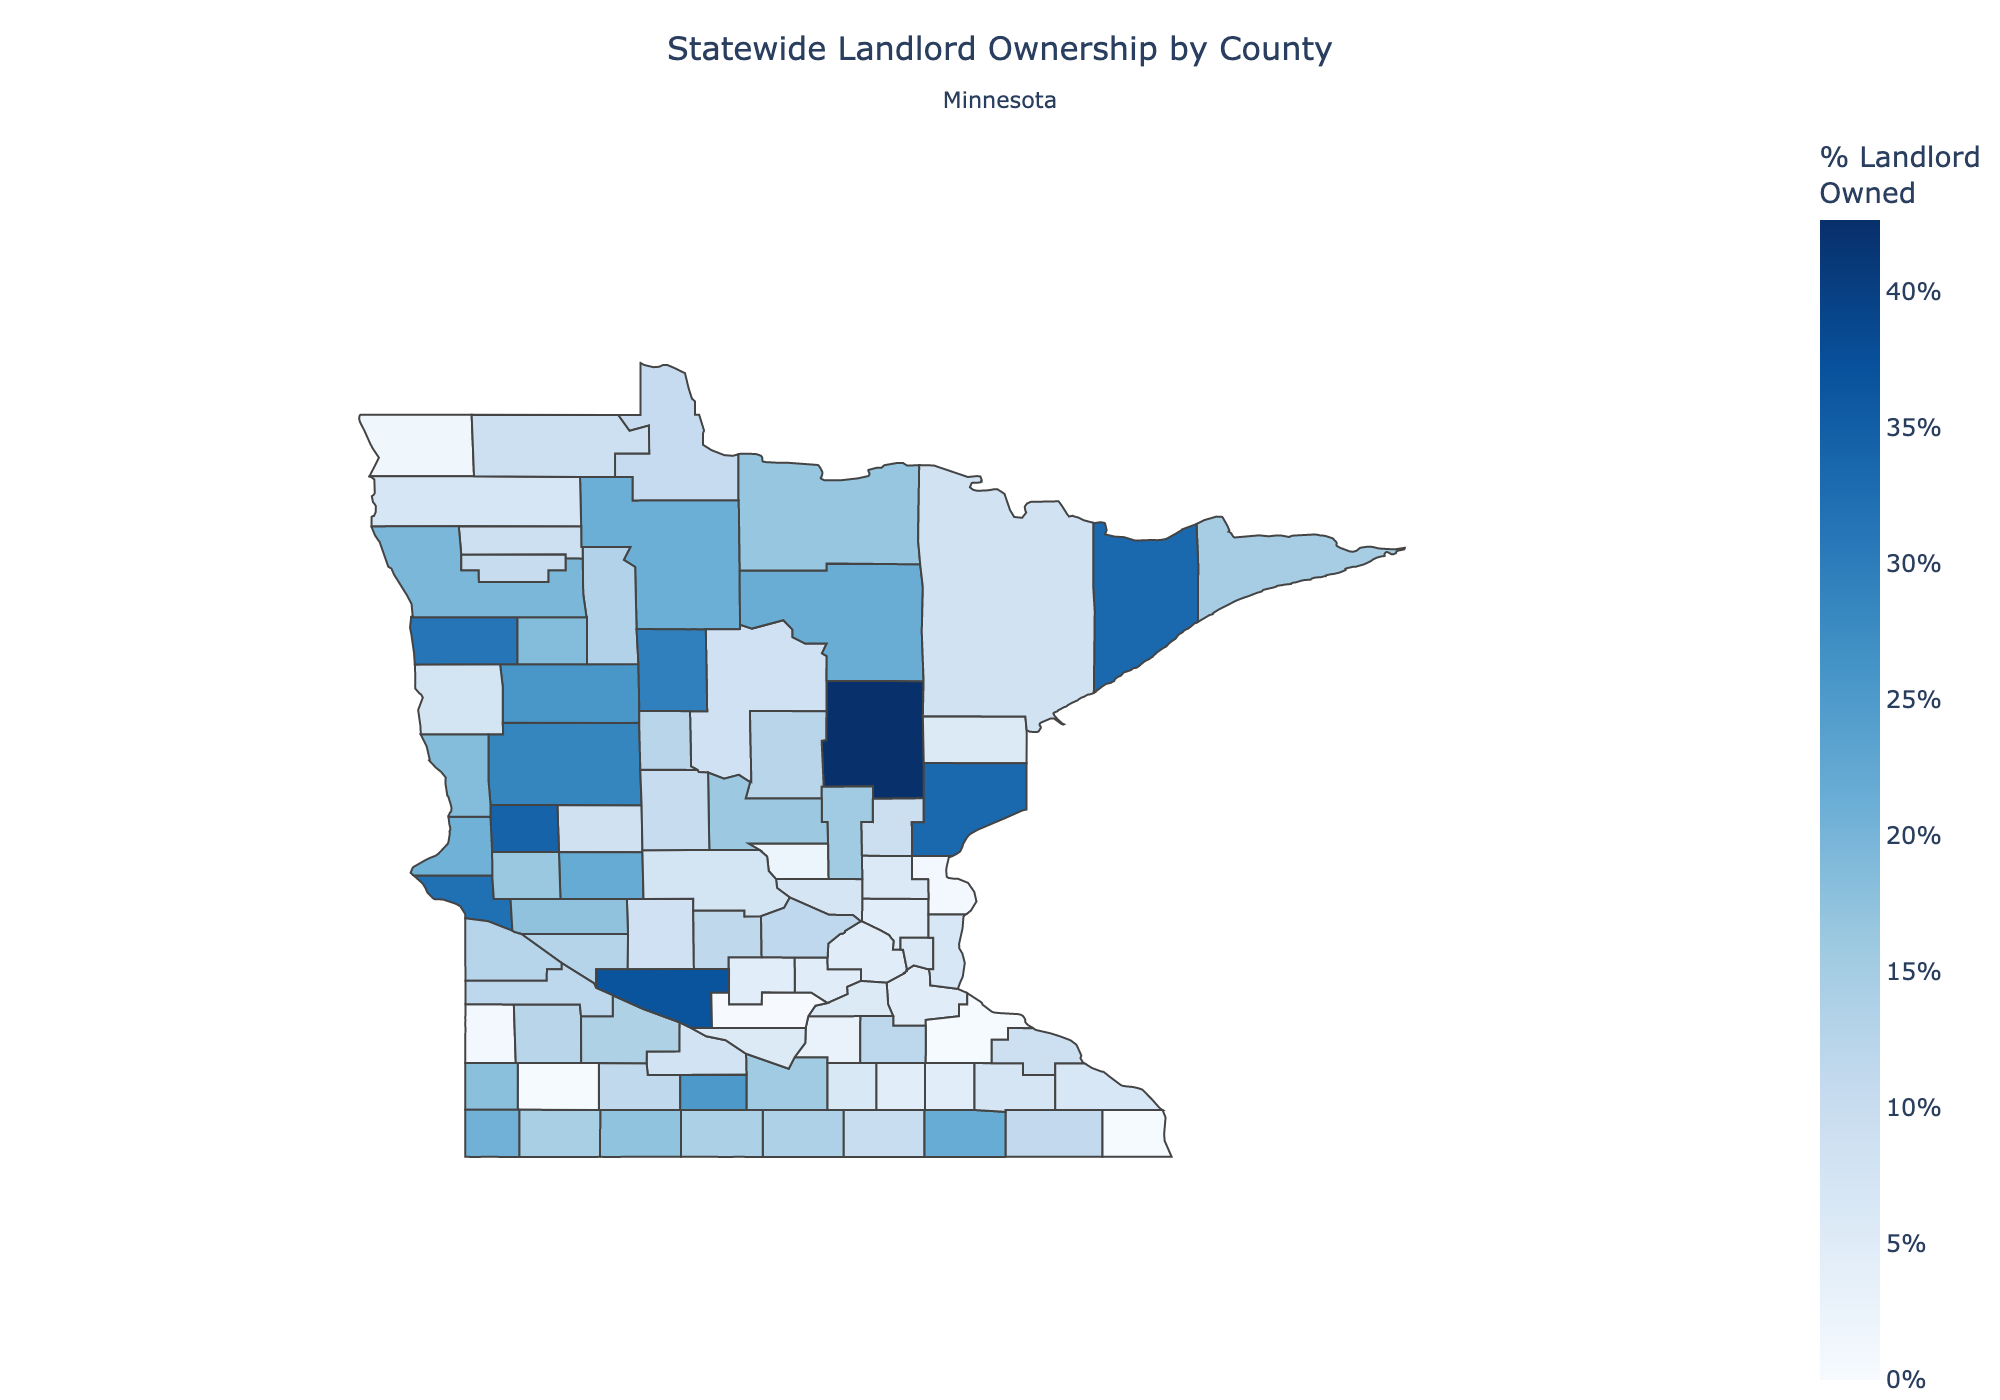
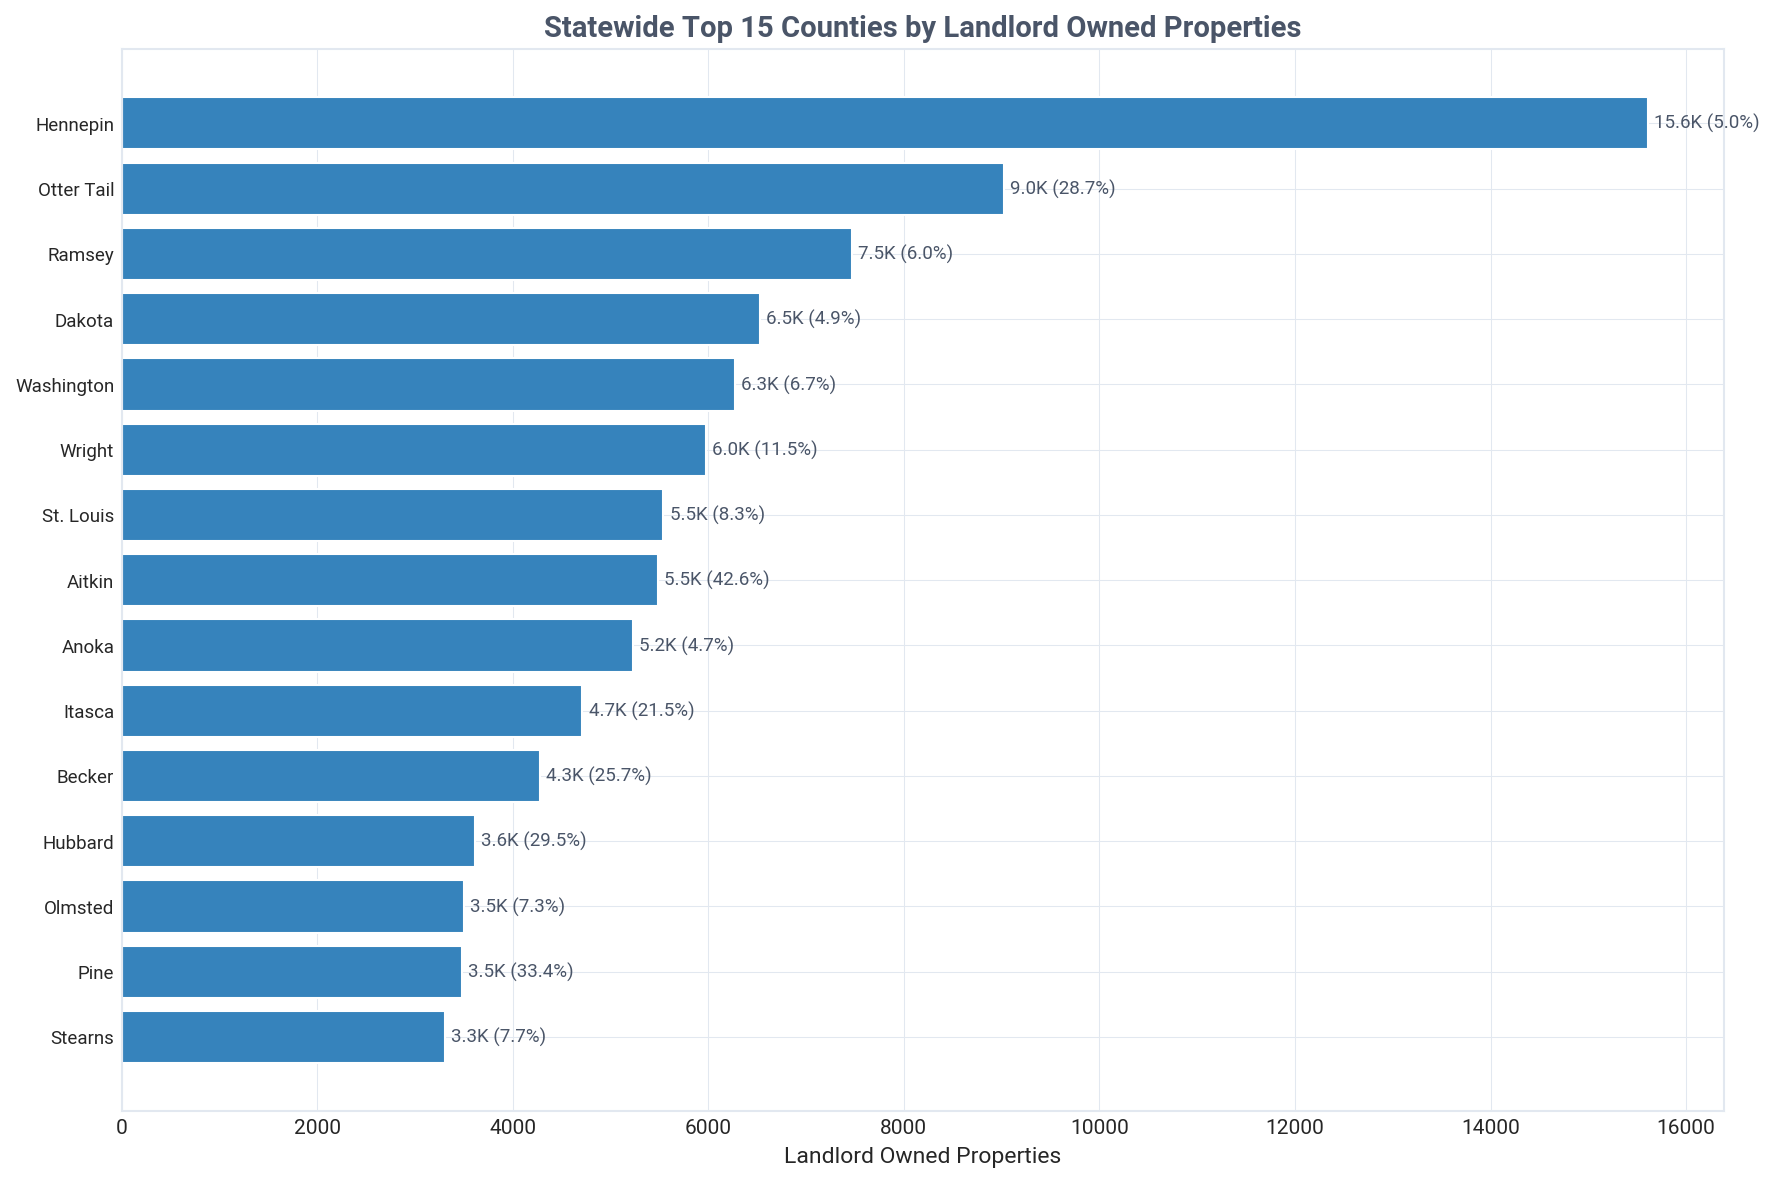
Hennepin County leads Minnesota with 15,610 investor-owned properties, followed by Otter Tail (9,021) and Ramsey (7,468).
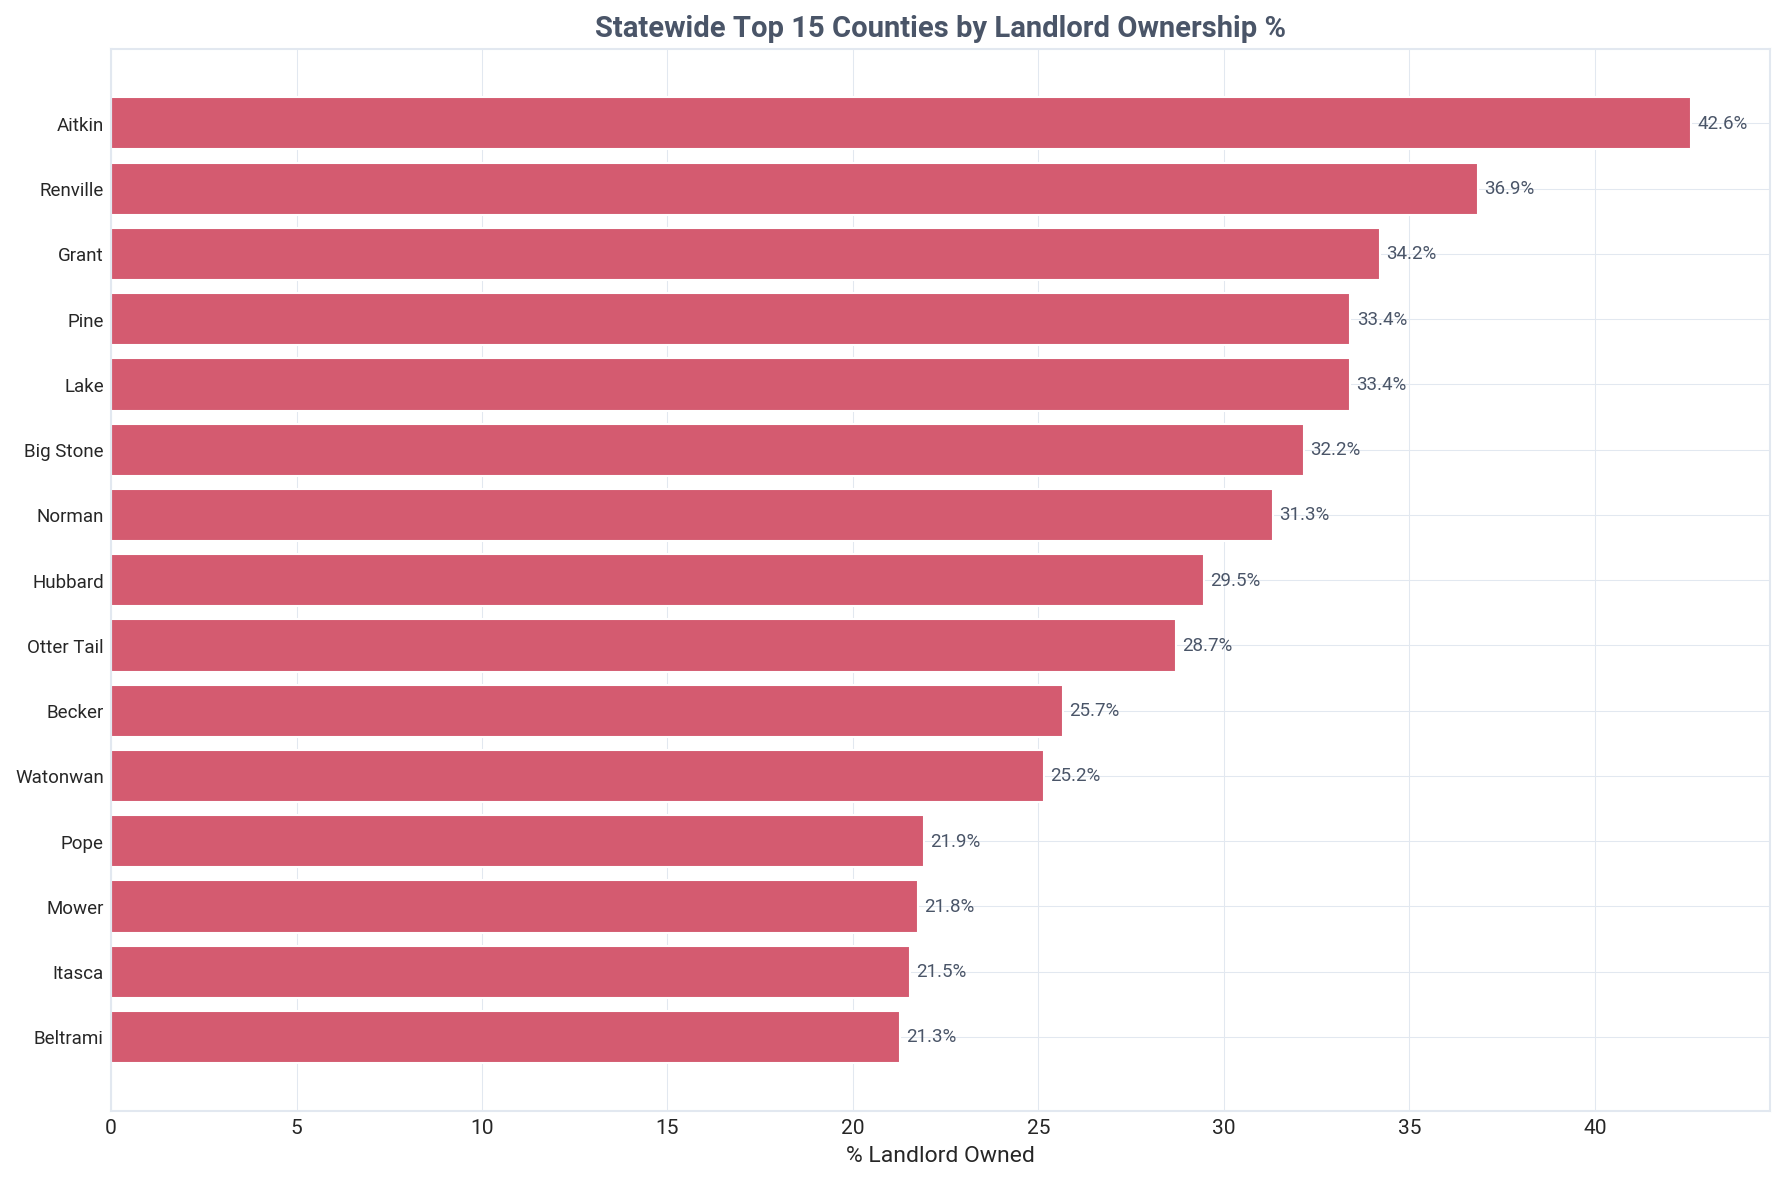
The areas with the highest investor concentration are largely rural, with Aitkin County at a 42.6% investor ownership rate. This contrasts sharply with high-volume urban areas like Hennepin, where the rate is only 5.0%.
Historical Transactions
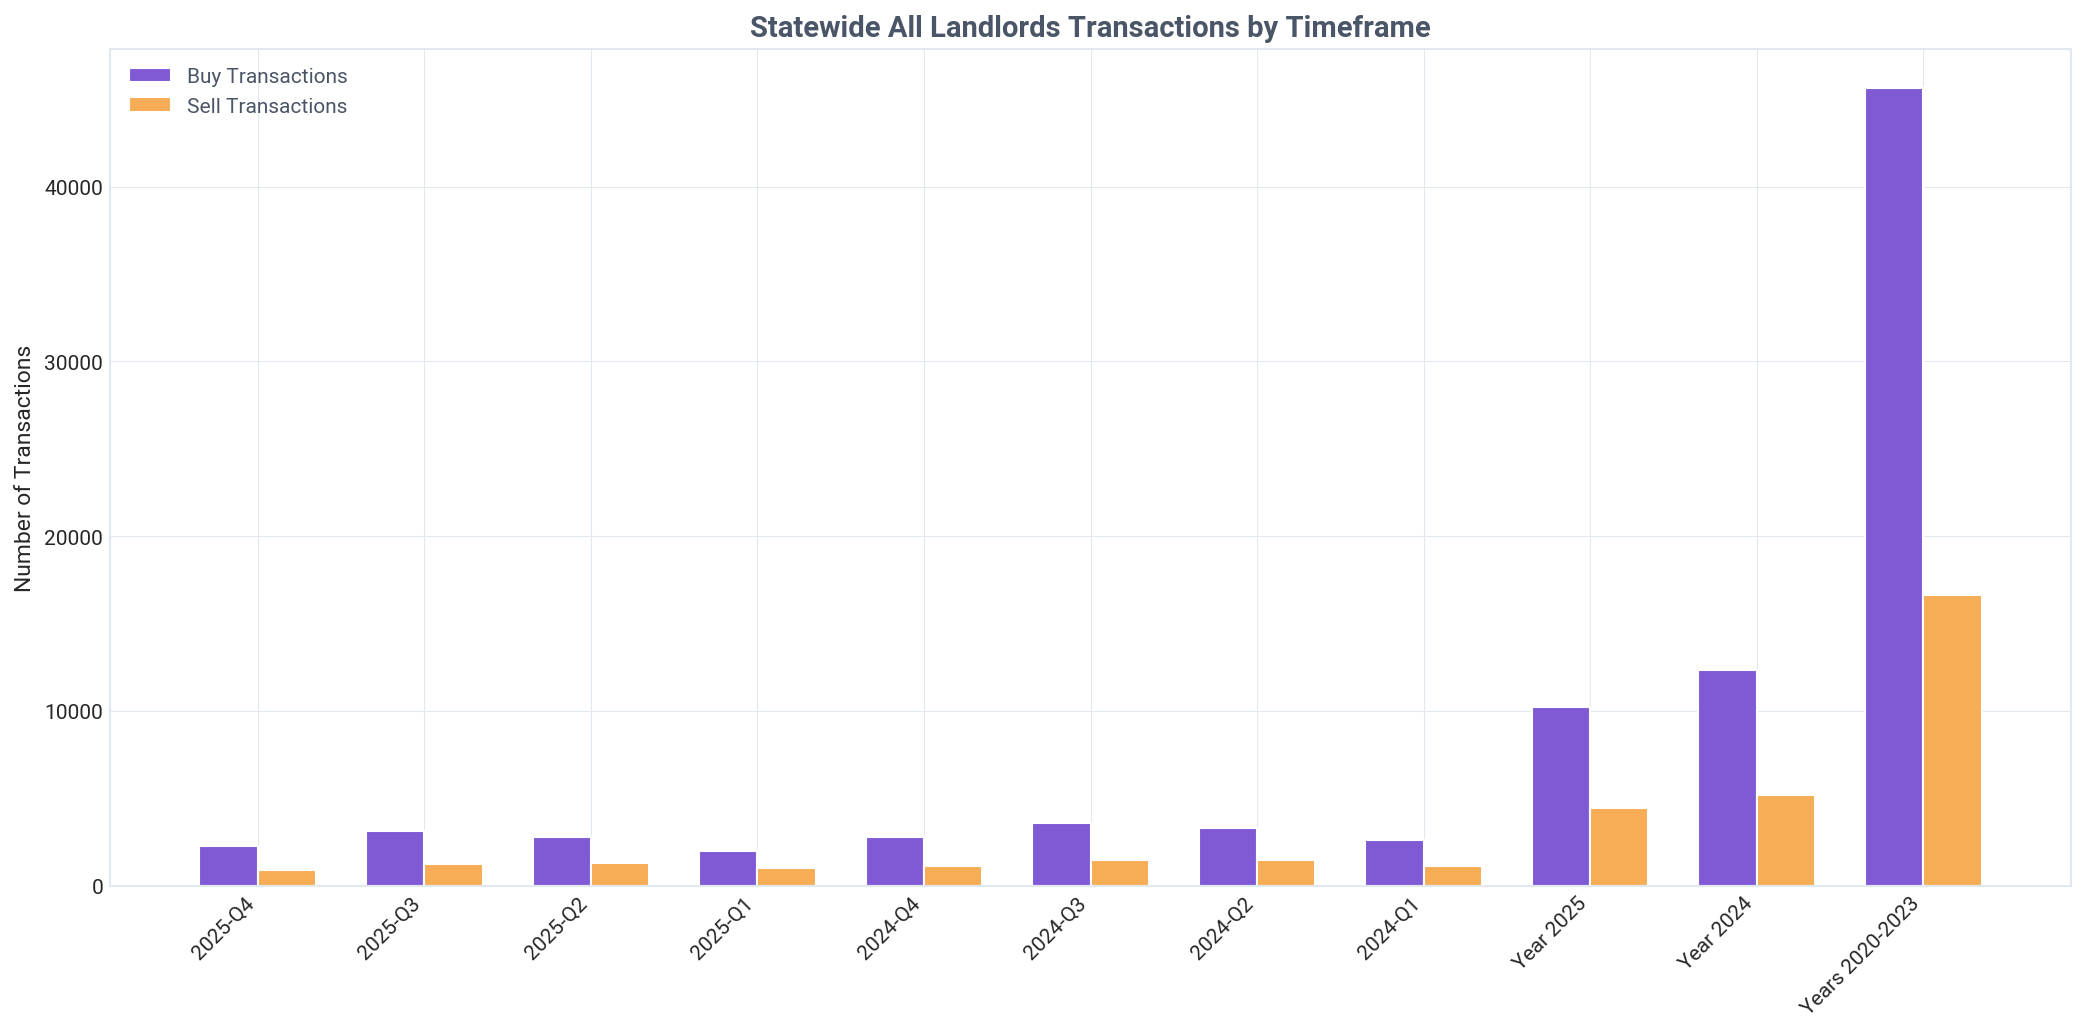
Minnesota landlords are strong net buyers with a 2.57x buy-to-sell ratio, but institutional investors are actively divesting.
In Q4, institutional investors (1000+) were heavy net sellers, selling more than 11 times as many properties (58) as they bought (5). This trend has persisted all year, with institutions being net sellers in every quarter of 2025.
Current Quarter Transactions
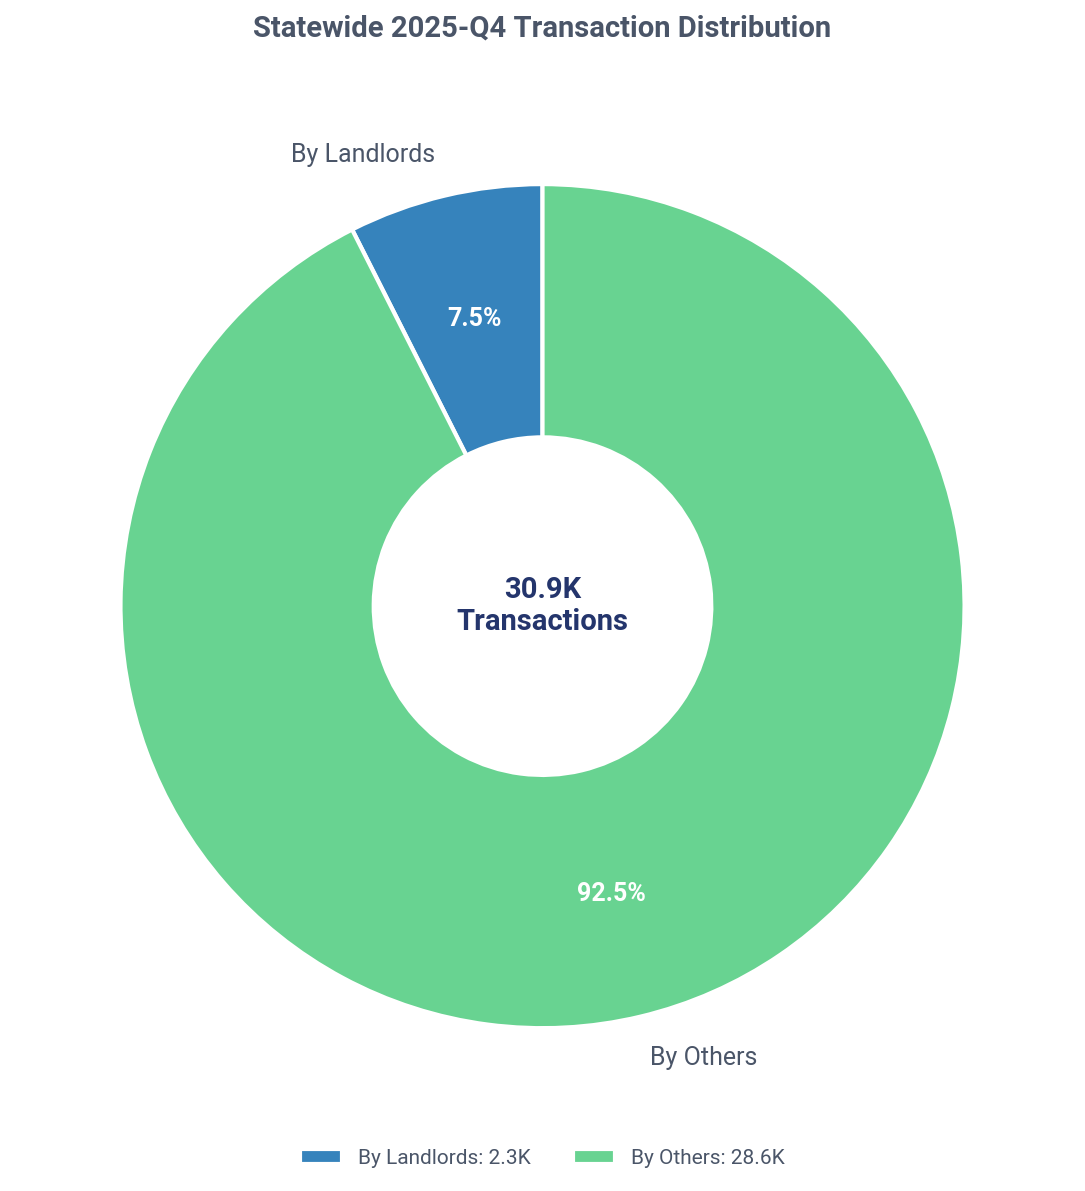
Landlords were involved in 7.5% of all single-family property transactions in Minnesota during Q4, totaling 2,306 purchases.
In Q4, institutional buyers paid 14.7% more per property ($384,410) than new single-property landlords ($335,128). Institutions were also far more likely to buy from other investors, sourcing 60.0% of their acquisitions from existing landlords.

Want deeper insights tailored to your investment strategy?

TALK TO AN EXPERT

Current Holdings Portfolio

Analysis of landlord property holdings by type, financing method, and owner category

Minnesota: landlord SFR holdings by type, Q4 2025
Key Insight
Landlords own 151,741 SFR properties in Minnesota, with individuals holding a dominant 75.7% share.
Detailed Findings

Investors hold 151,741 single-family residential properties in Minnesota, representing 8.9% of the state's total SFR market.

Individual 'mom-and-pop' investors are the cornerstone of Minnesota's rental market, owning 114,812 properties, which accounts for 75.7% of all investor-owned SFRs. Companies hold the remaining 39,000 properties (25.7%).

This individual dominance extends to landlord entities, where 147,572 out of 167,682 total landlords are individuals, a ratio of more than 7 to 1 over company investors.

Cash is the preferred method of ownership, with 113,875 properties held free and clear, significantly outnumbering the 37,866 properties that are financed. This suggests a market with low leverage and high equity.

The portfolio is overwhelmingly geared towards rentals, with 147,136 properties identified as rented, confirming the primary business focus of these owners.
Acquisition Timing & Pricing

Comparison of acquisition prices between landlords and traditional homeowners

Key Insight
Minnesota landlords paid 21.7% less than homeowners in Q4, securing an average $89,169 discount per property.
Detailed Findings

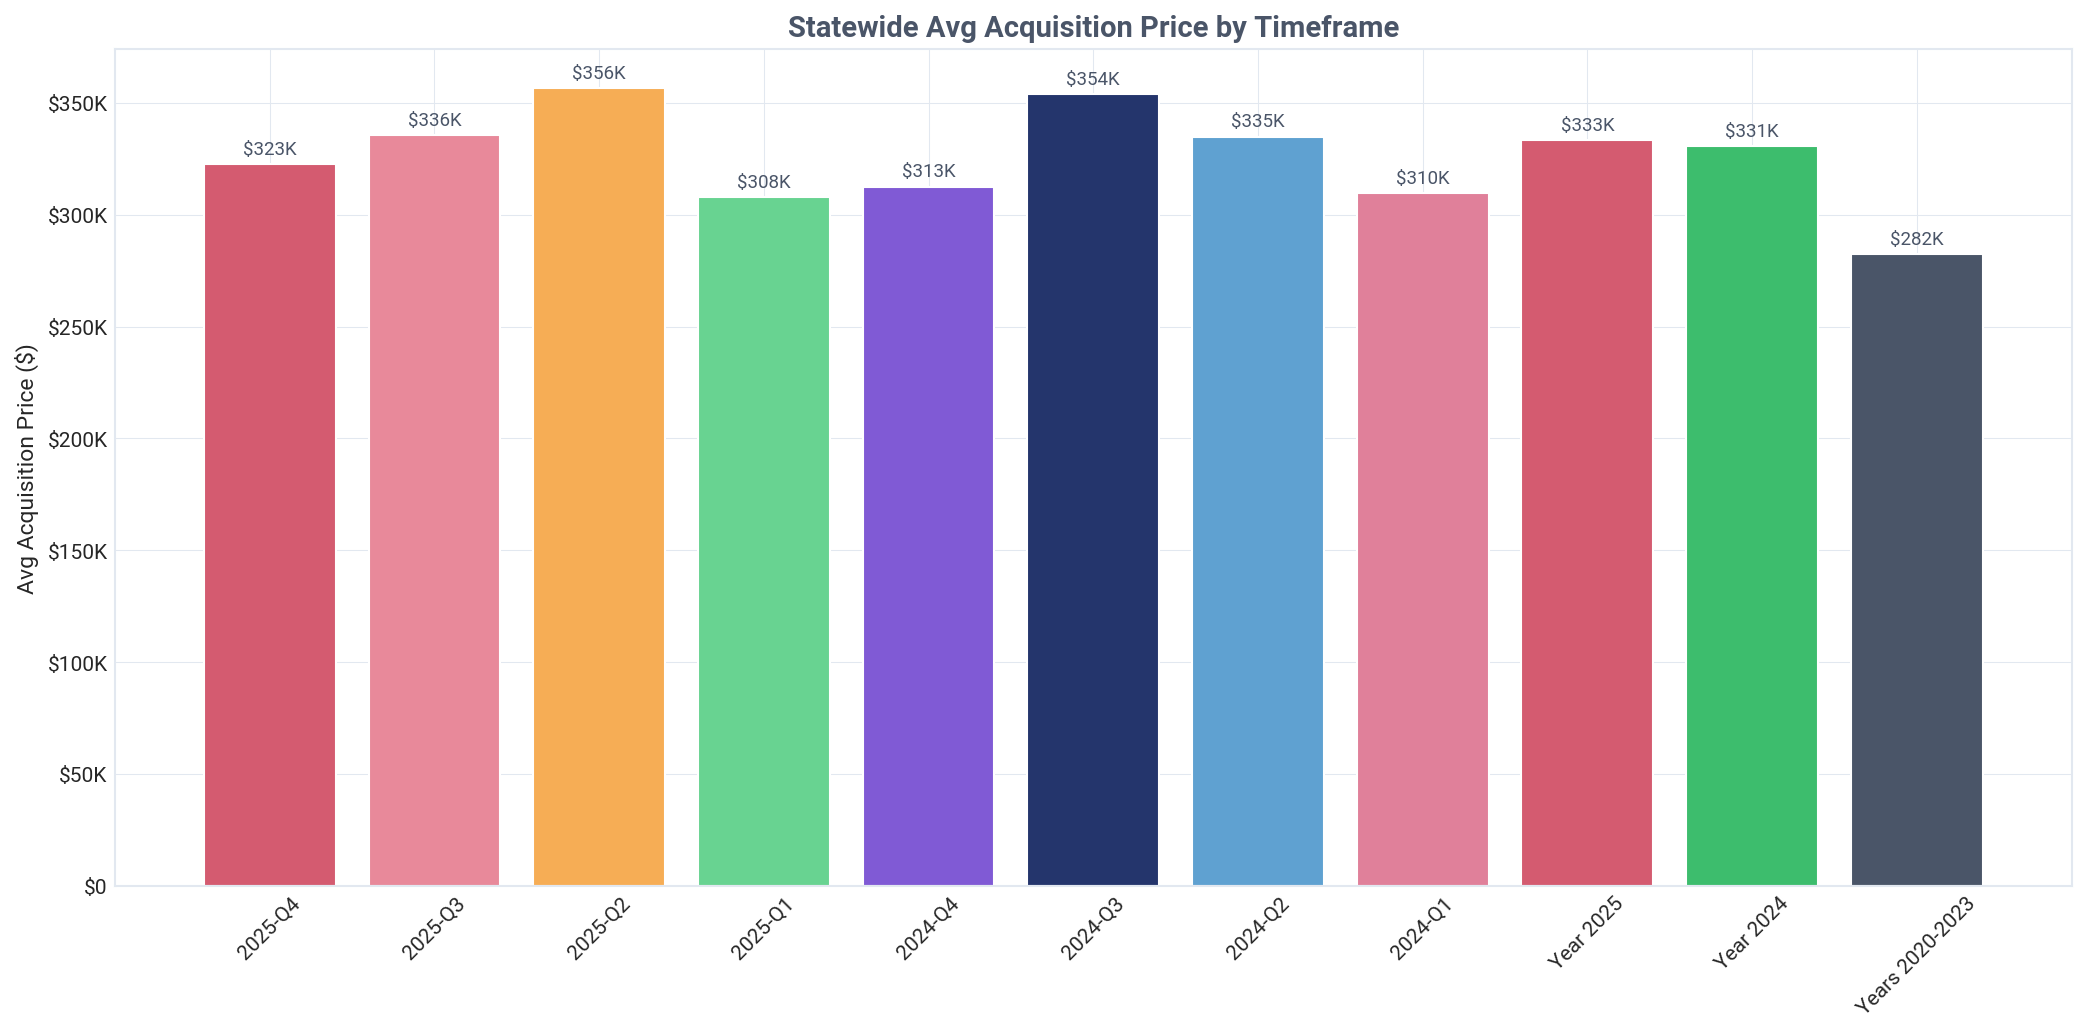
In Q4 2025, investors in Minnesota demonstrated significant purchasing power, acquiring properties for an average of $322,632. This represents a substantial 21.7% discount compared to the $411,801 paid by traditional homeowners, saving them an average of $89,169 per property.

The price gap between landlords and homeowners has fluctuated throughout 2025, but the Q4 discount of 21.7% is one of the highest of the year, widening from 16.8% in Q2 and 20.8% in Q3. This suggests investors are finding greater value as the year closes.

A clear trend of price appreciation is evident in the market. The average landlord acquisition price in Q4 2025 ($322,632) is 14.3% higher than the average price paid during the 2020-2023 period ($282,219), signaling strong market growth.

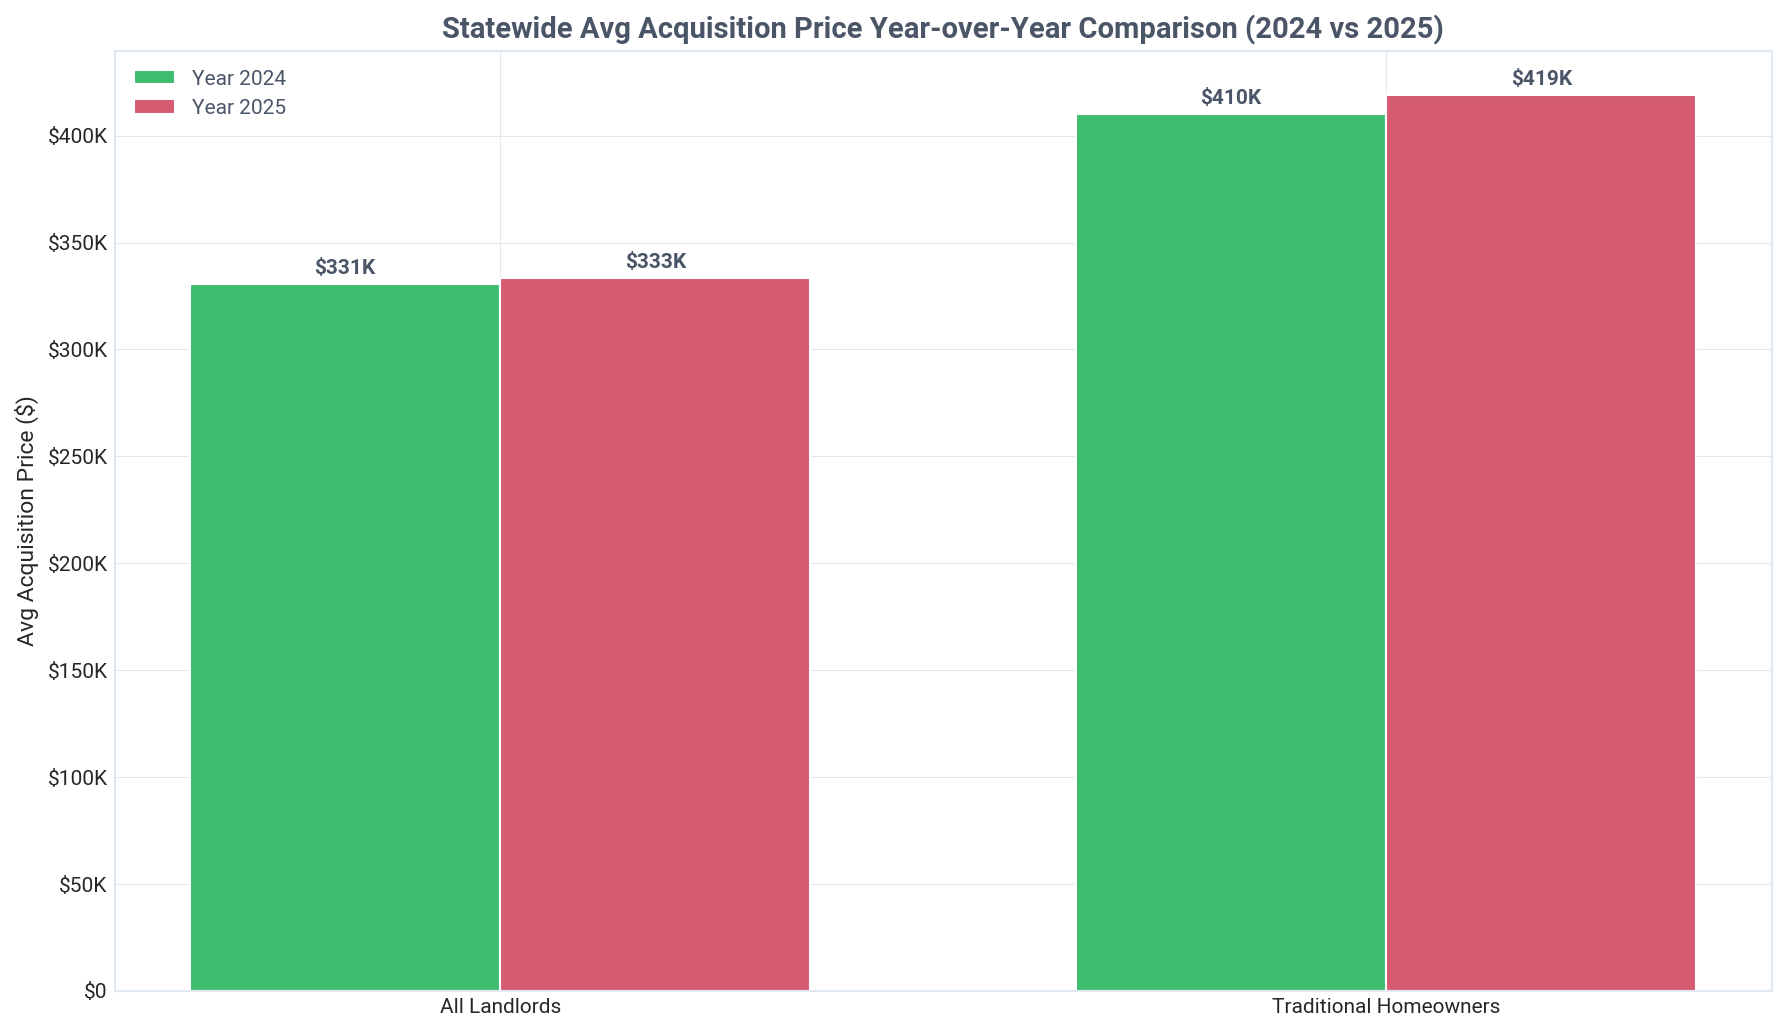
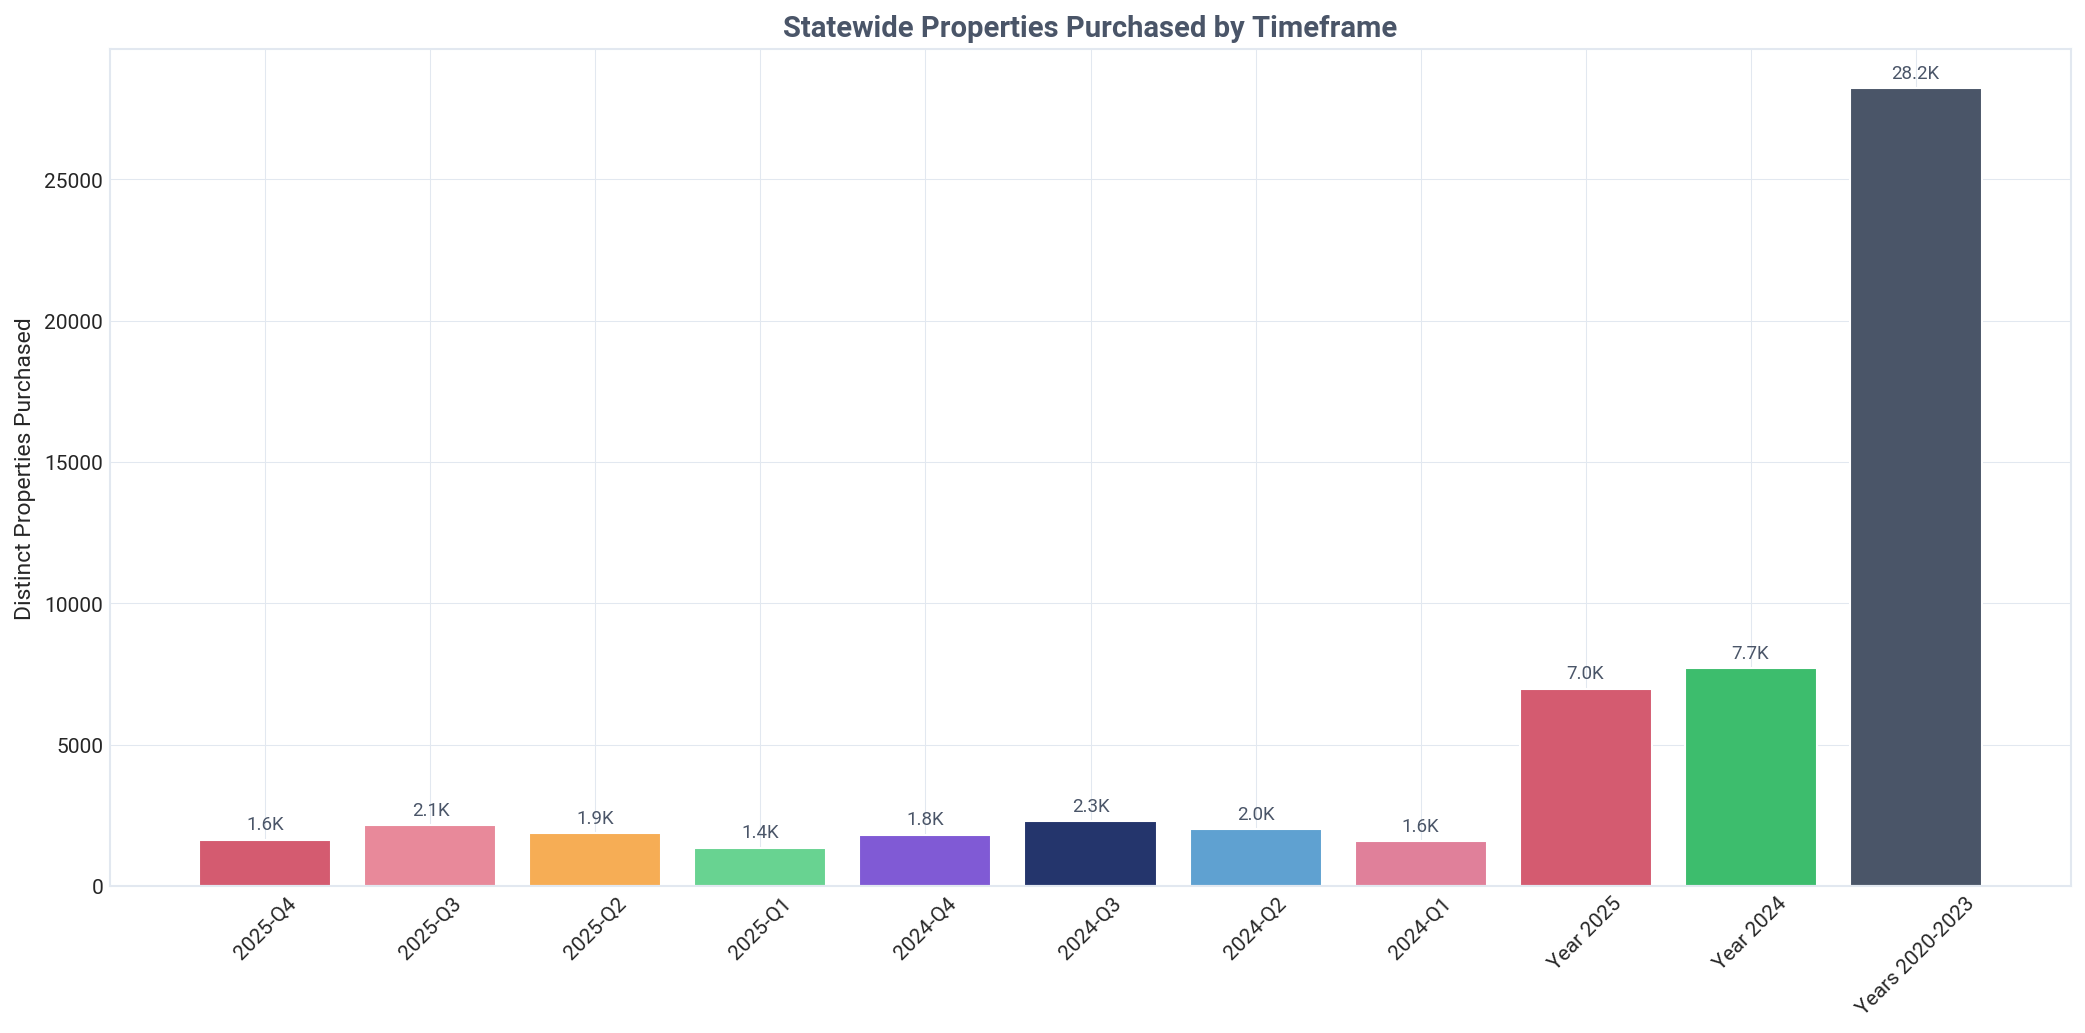
The average landlord acquisition price for the full year 2025 ($333,251) shows a slight increase over the 2024 average ($330,649), indicating stable but continued price growth in the investor market year-over-year.

This consistent ability to purchase below the homeowner market rate is a key strategic advantage for investors, allowing for better potential returns on investment whether through rental income or future appreciation.

Minnesota: properties purchased by timeframe, Q4 2025
Minnesota: average acquisition price by timeframe, Q4 2025
Minnesota: average acquisition price by buyer type, Q4 2025
Minnesota: average acquisition price year over year, Q4 2025

Current Quarter Purchase Summary

Analysis of Q4 2025 purchase activity by investor tier and type

Minnesota: purchases by tier, Q4 2025
Minnesota: purchased property share by tier, Q4 2025
Key Insight
Landlords acquired 8.5% of all single-family homes sold in Minnesota during Q4, totaling 1,639 properties.
Detailed Findings

Investor activity accounted for 8.5% of the total SFR market in Minnesota during Q4 2025, with landlords purchasing 1,639 of the 19,373 homes sold.

The market saw a significant influx of new and small-scale investors, as single-property landlords were responsible for 1,155 purchases, or 70.5% of all investor acquisitions this quarter. This activity was driven by 1,651 distinct entities, signaling a robust entry of first-time investors.

Mom-and-pop landlords (portfolios of 1-10 properties) were the dominant force, collectively purchasing 1,487 properties. This constitutes a staggering 90.7% of all landlord buying activity in Q4, cementing their role as the primary driver of the investor market.

In sharp contrast, institutional investors with portfolios of over 1,000 properties had a negligible presence, acquiring just 5 properties. Their 0.3% share of purchases underscores a near-total absence from the acquisition market this quarter.

Mid-size landlords (11-1000 properties) also played a minor role, purchasing a combined 148 properties, which highlights how heavily concentrated Q4 purchasing activity was at the smallest end of the investor spectrum.

Ownership by Purchase Tier

Distribution of investor-owned properties across portfolio size tiers

Key Insight
Mom-and-pop investors (1-10 properties) control 90.5% of Minnesota's investor-owned single-family housing.
Detailed Findings

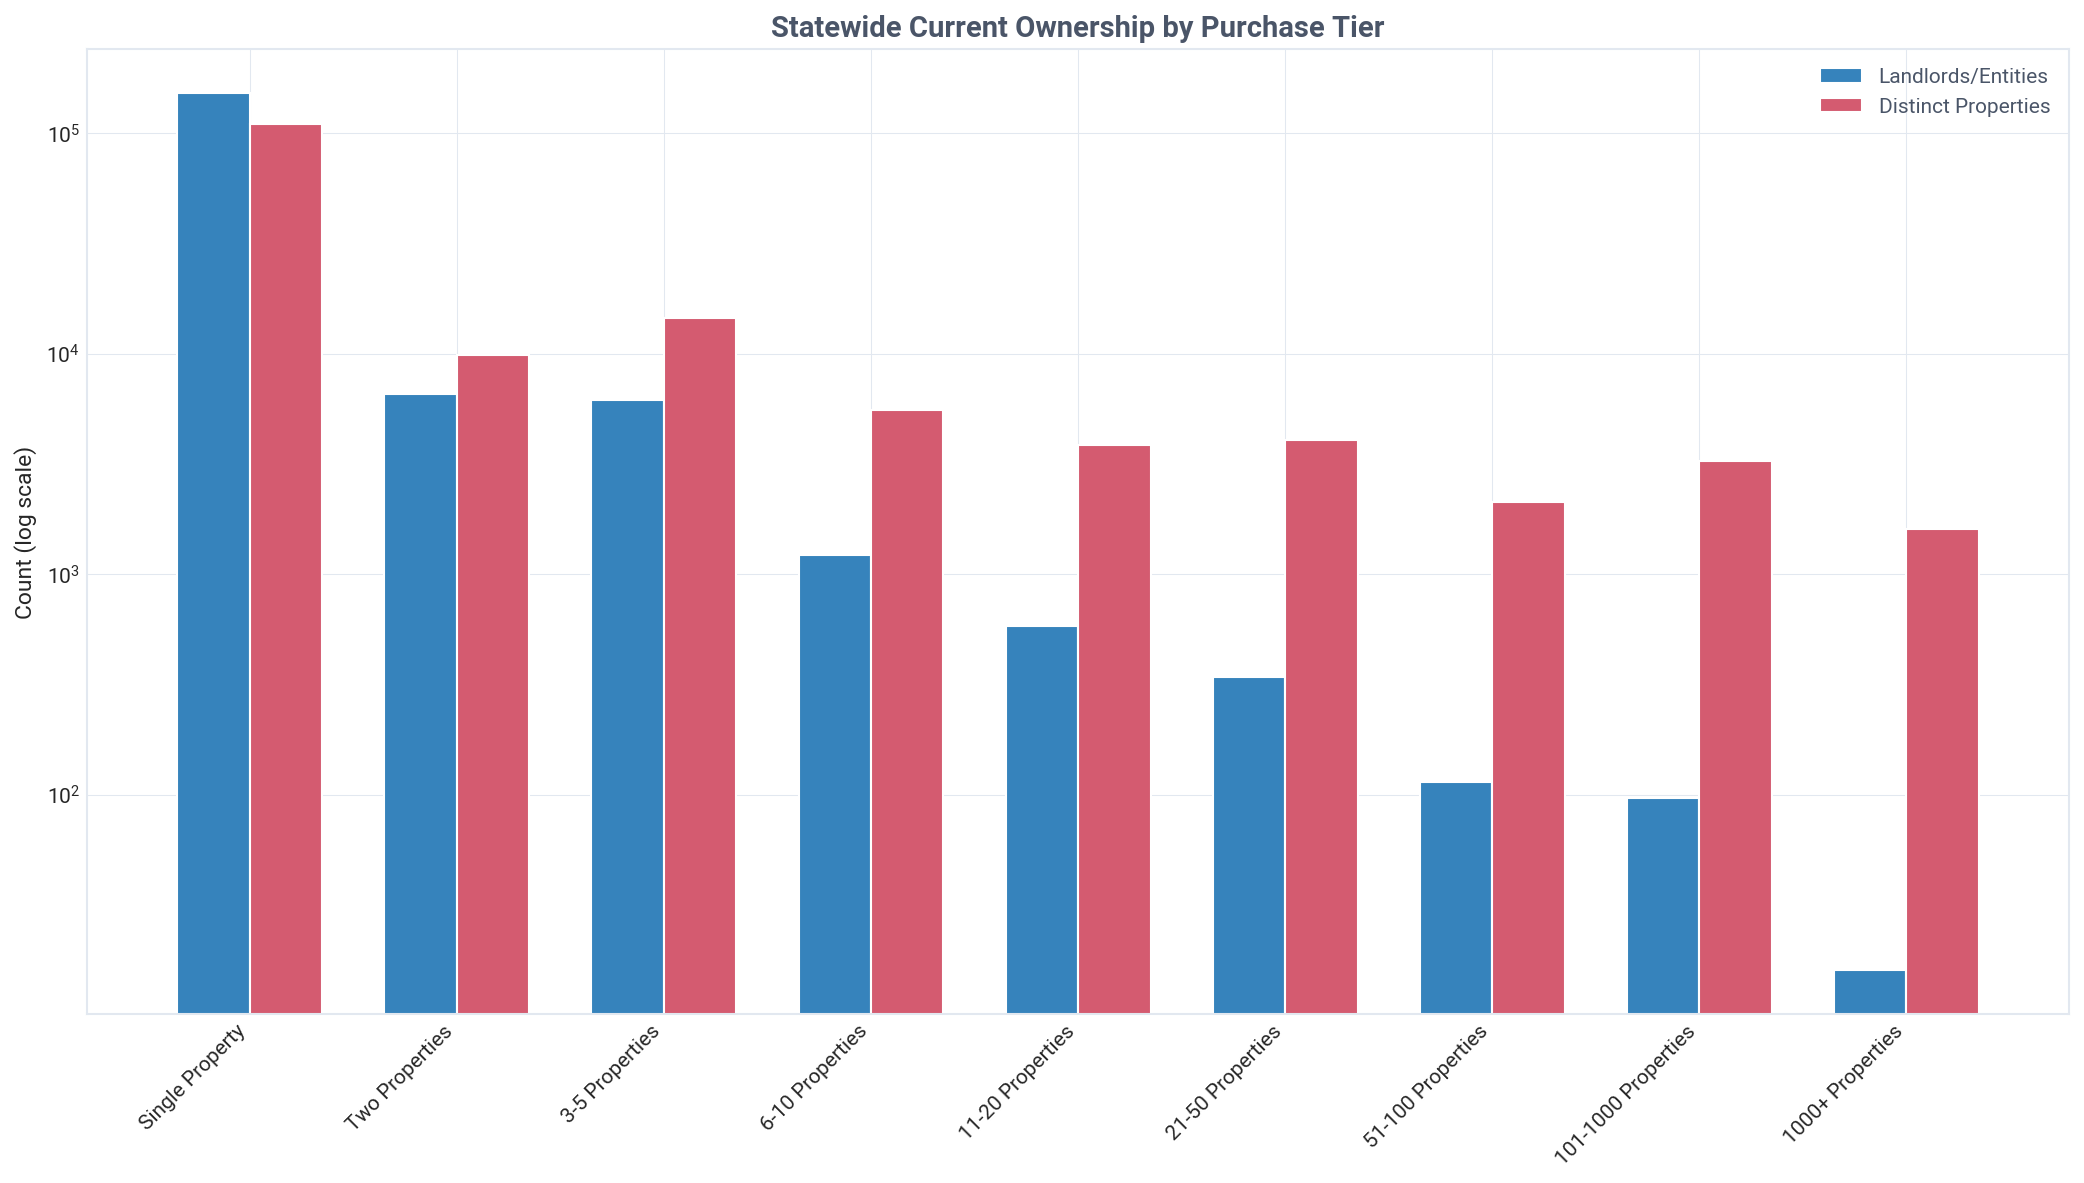
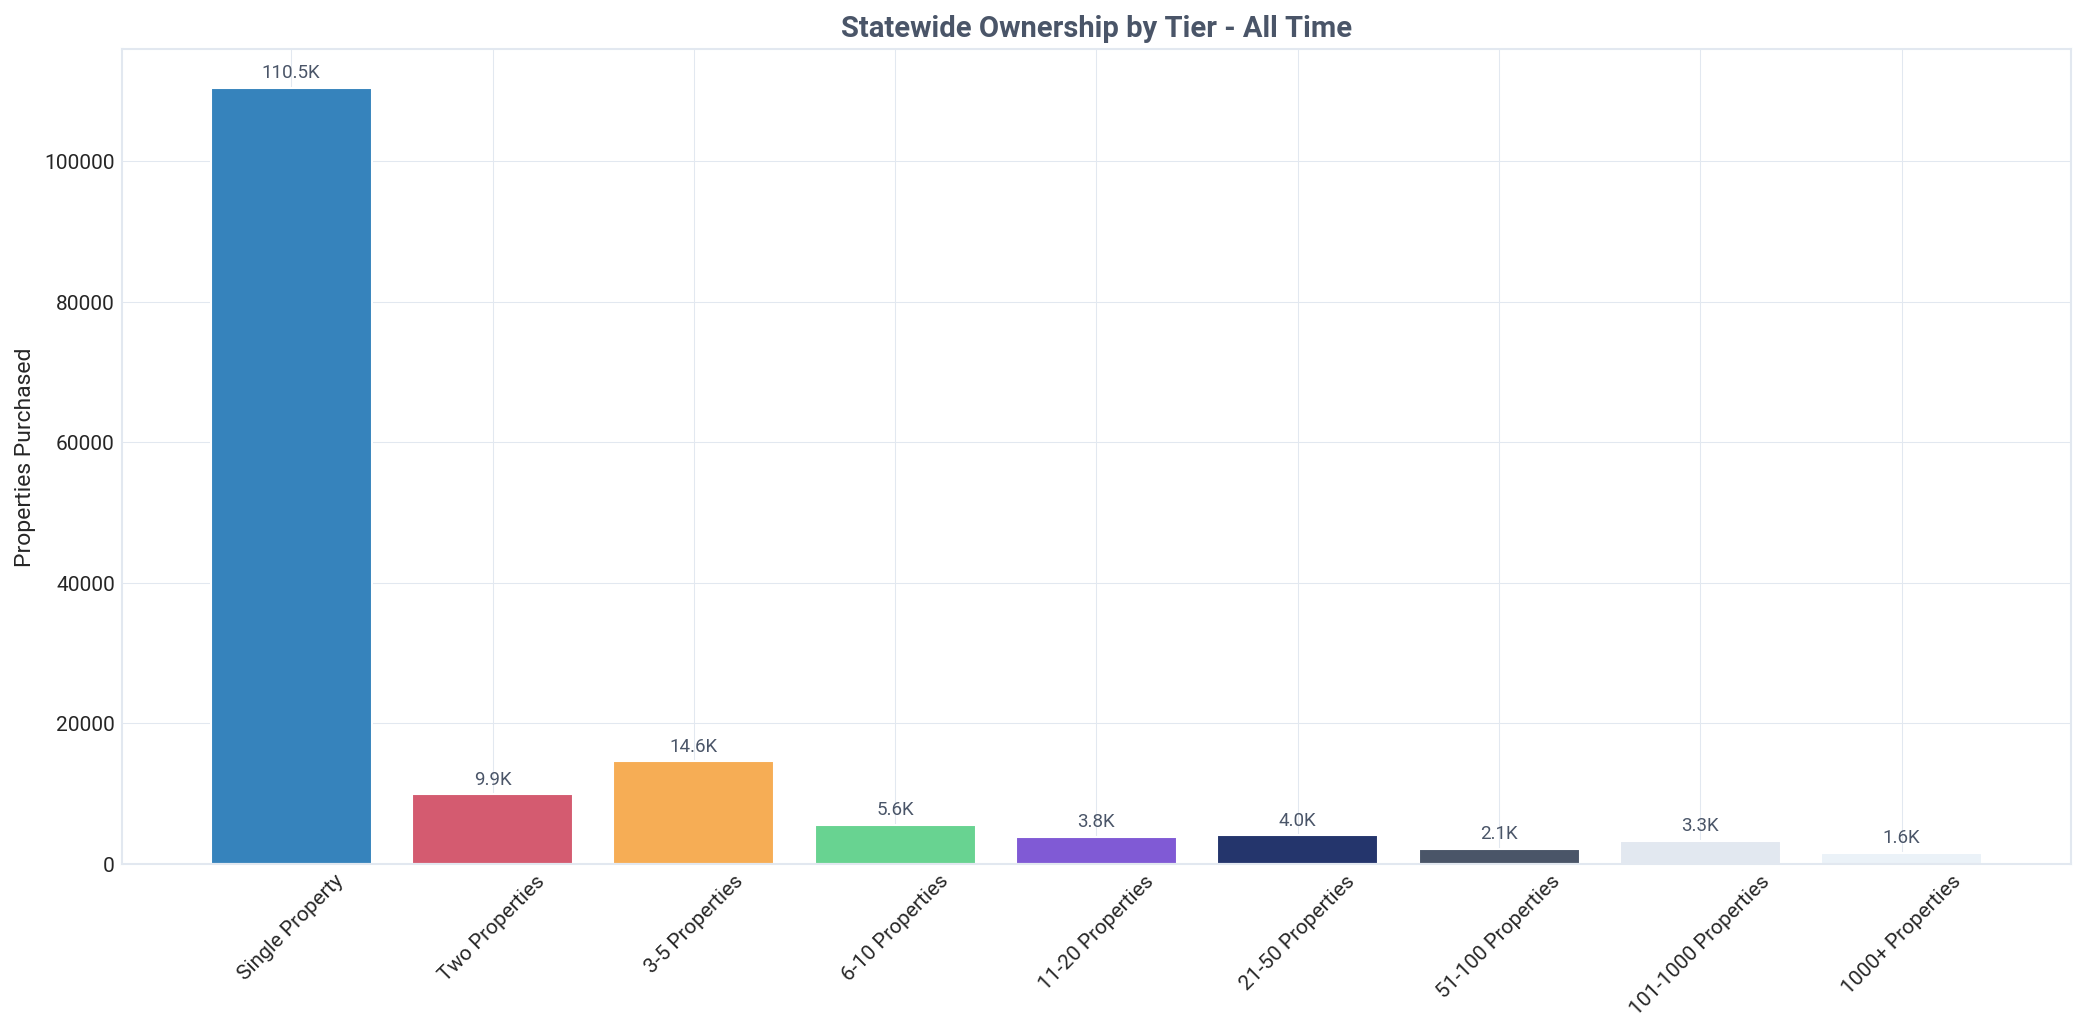
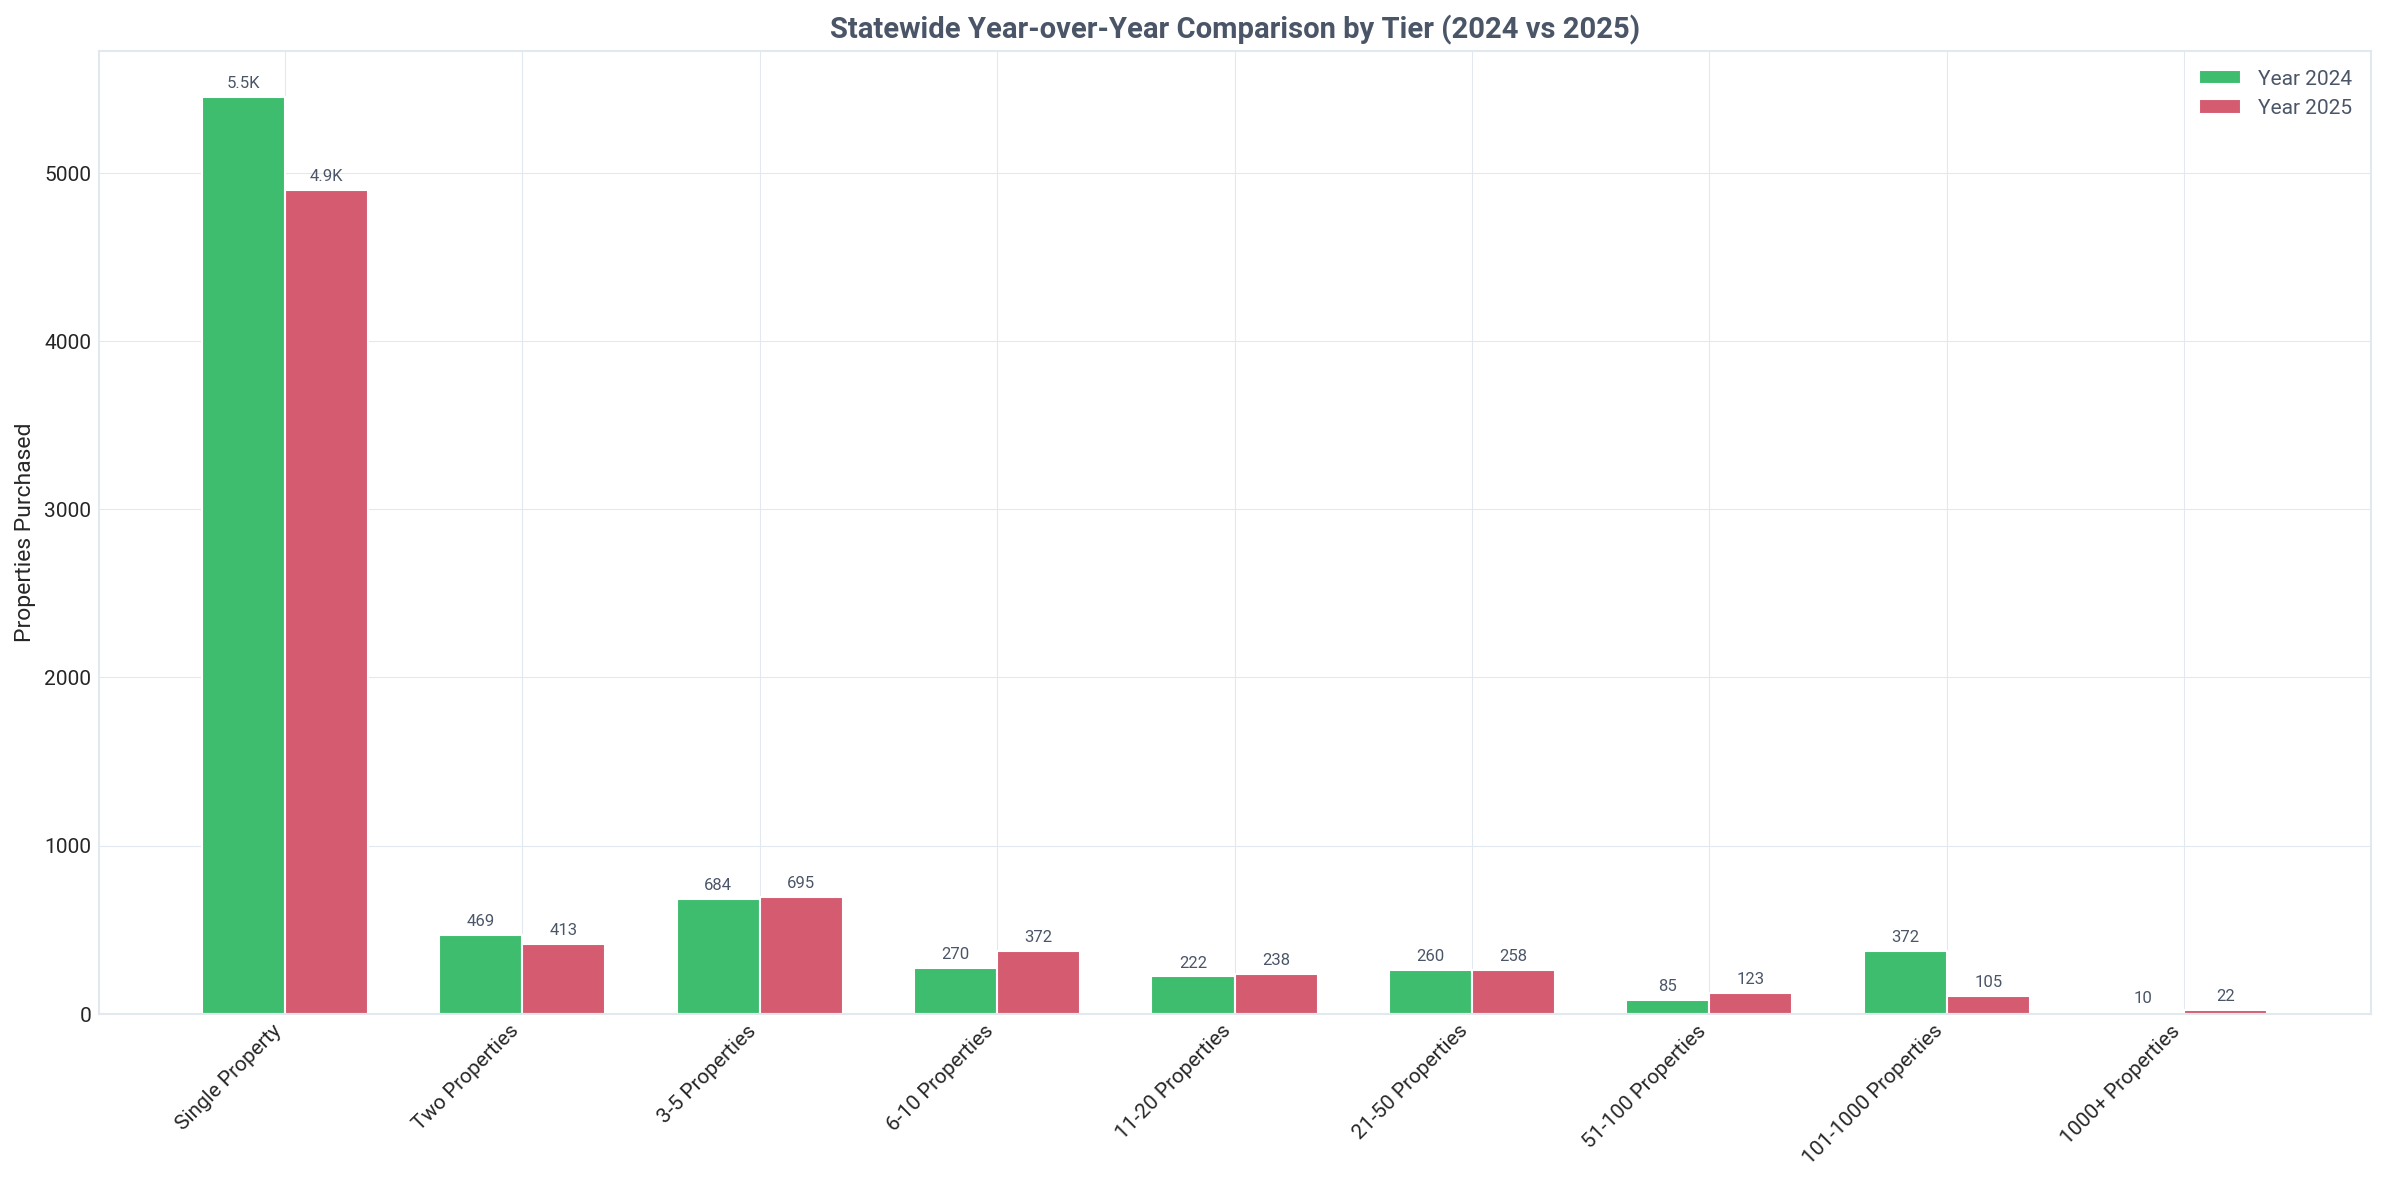
The investor landscape in Minnesota is overwhelmingly dominated by small-scale operators. Mom-and-pop landlords, who own between 1 and 10 properties, collectively control 90.5% of all investor-owned SFRs in the state.

Single-property landlords (Tier 01) alone make up the largest segment, owning 110,476 properties, which is 71.1% of the entire investor portfolio. This highlights the decentralized nature of the rental market.

Despite significant media attention, institutional investors (Tier 09) have a very small footprint in Minnesota, owning just 1,597 properties. This accounts for only 1.0% of the investor-owned housing stock, challenging the narrative of a corporate takeover.

The mid-size and large investor tiers (11-1000 properties) represent a combined 8.6% of the market, indicating that scale beyond the 10-property mark remains relatively uncommon.

This distribution reveals a highly fragmented market structure, where the decisions of thousands of small landlords, rather than a few large corporations, shape Minnesota's single-family rental supply.

Minnesota: current ownership by purchase tier, Q4 2025
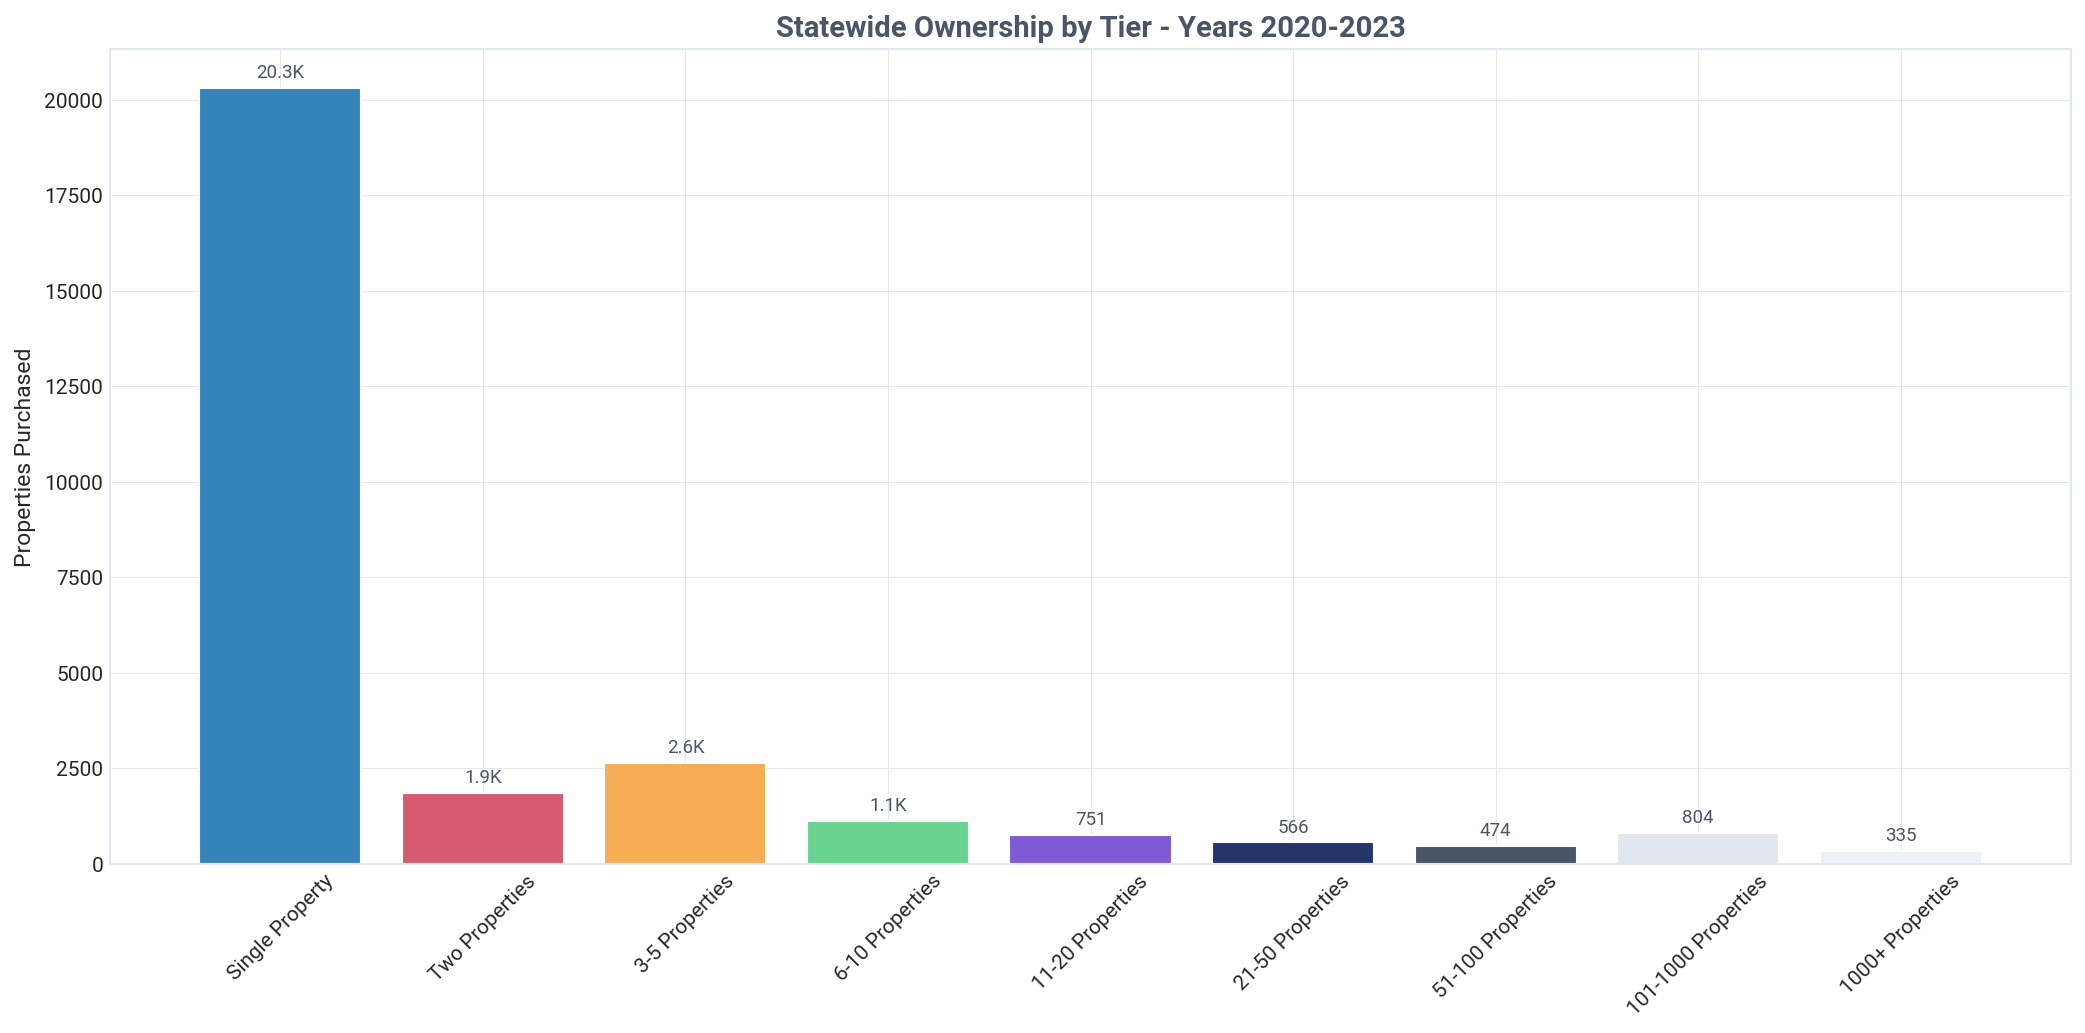
Minnesota: properties purchased by tier, all time, Q4 2025
Minnesota: properties purchased by tier this quarter, Q4 2025
Minnesota: properties purchased by tier year over year, Q4 2025

Need custom portfolio analysis based on these tier insights?

TALK TO AN EXPERT

Ownership by Tier & Owner Type

Breakdown of individual vs corporate ownership across portfolio tiers

Minnesota: ownership by tier and owner type, Q4 2025
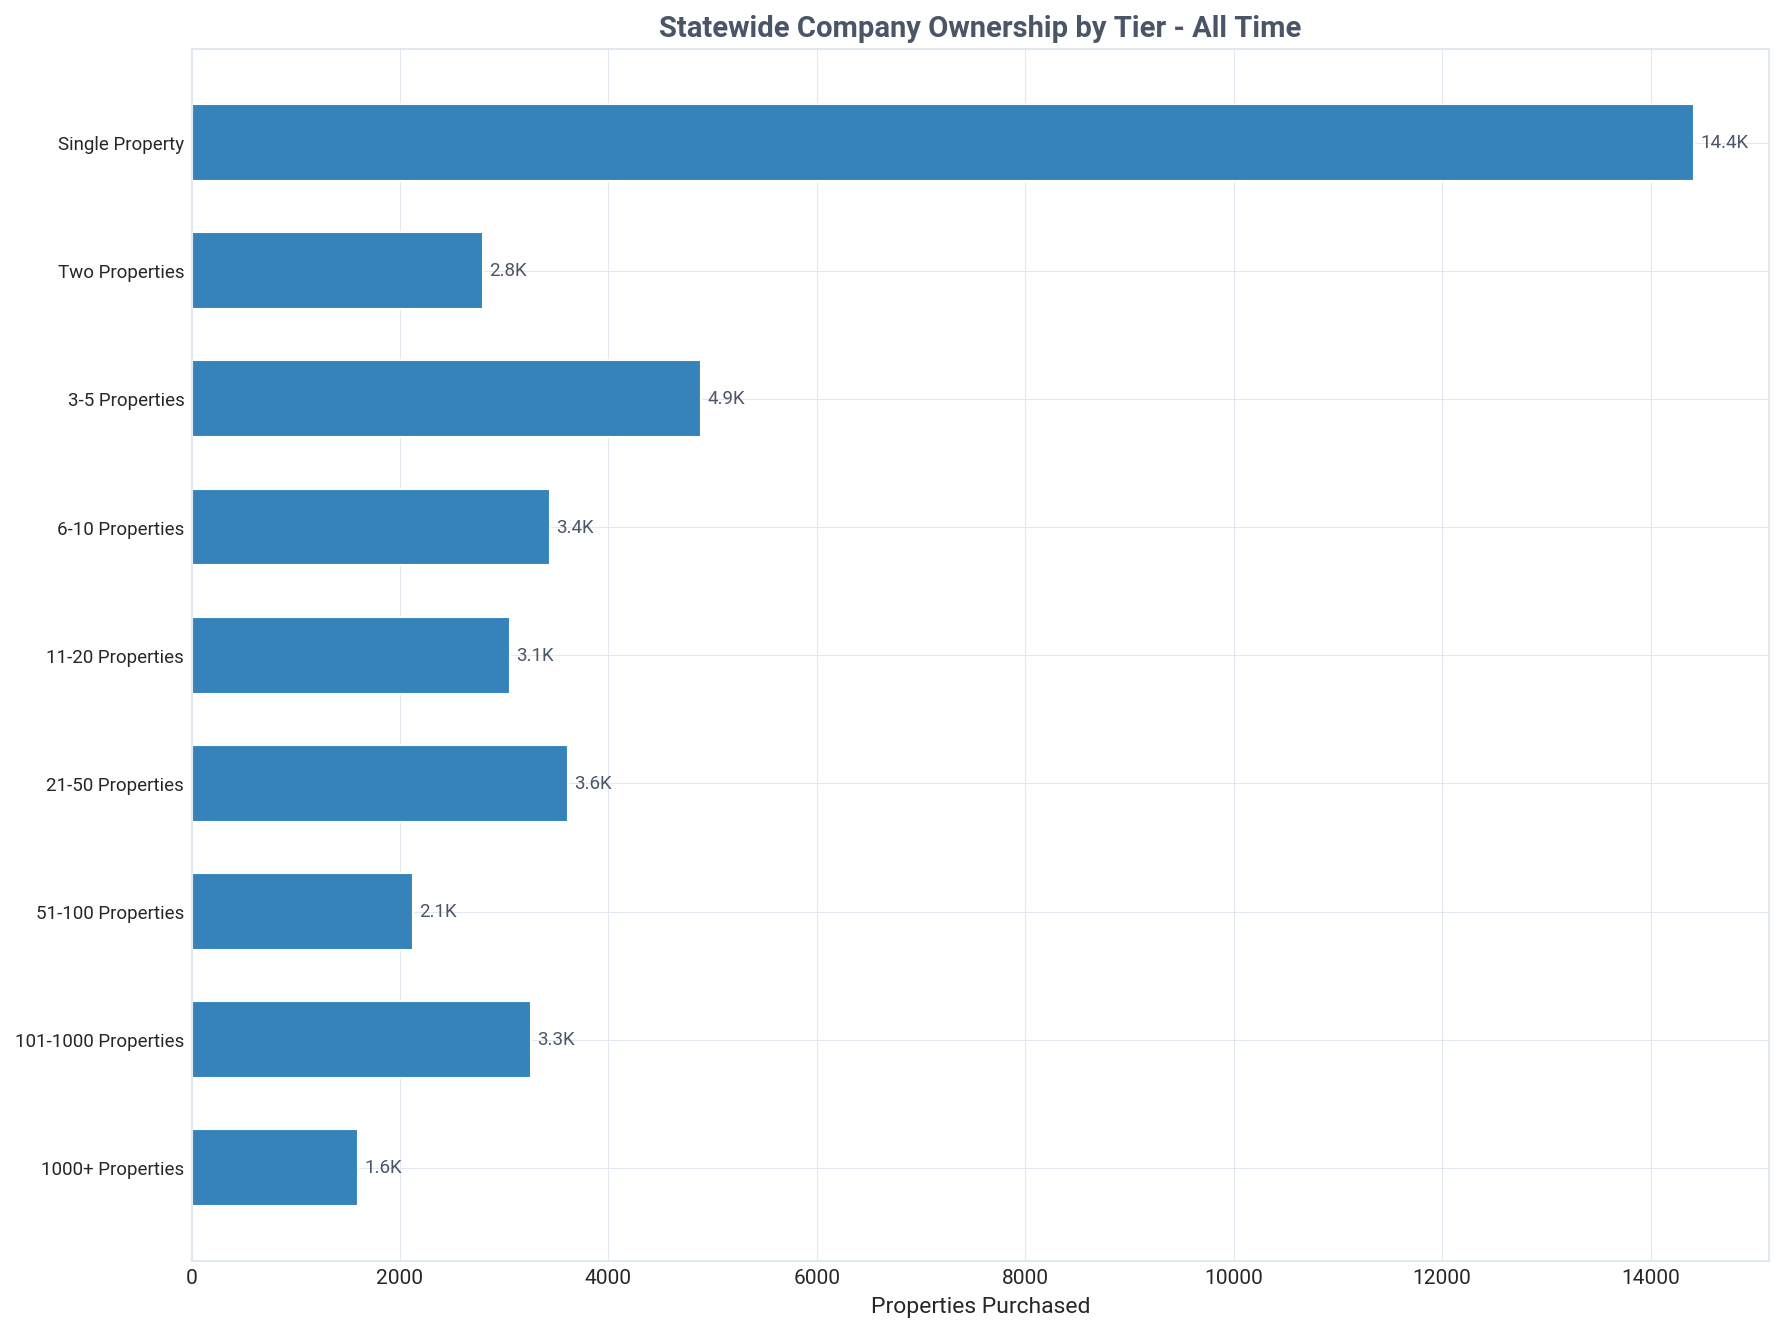
Minnesota: company purchases by tier, all time, Q4 2025
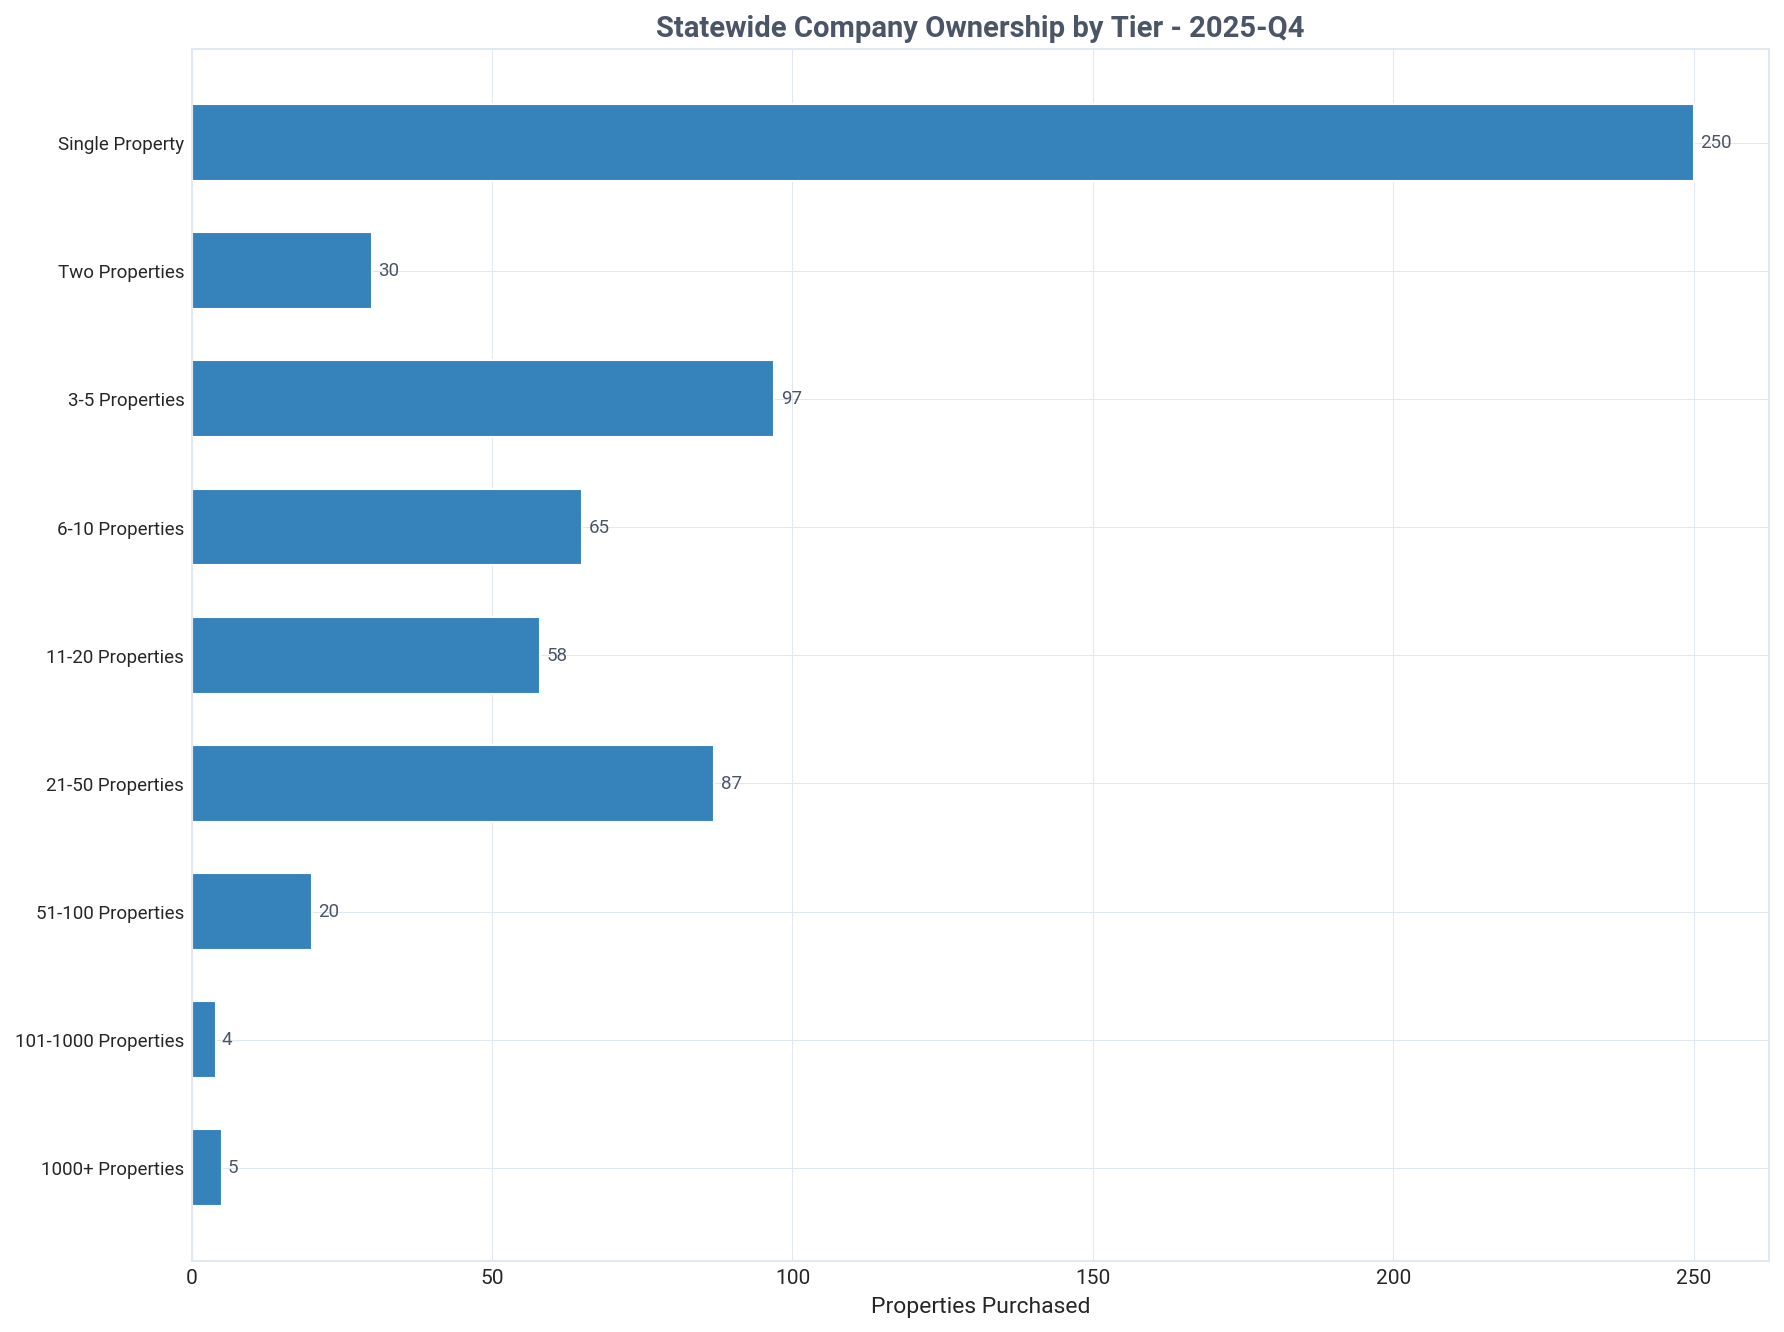
Minnesota: company purchases by tier this quarter, Q4 2025
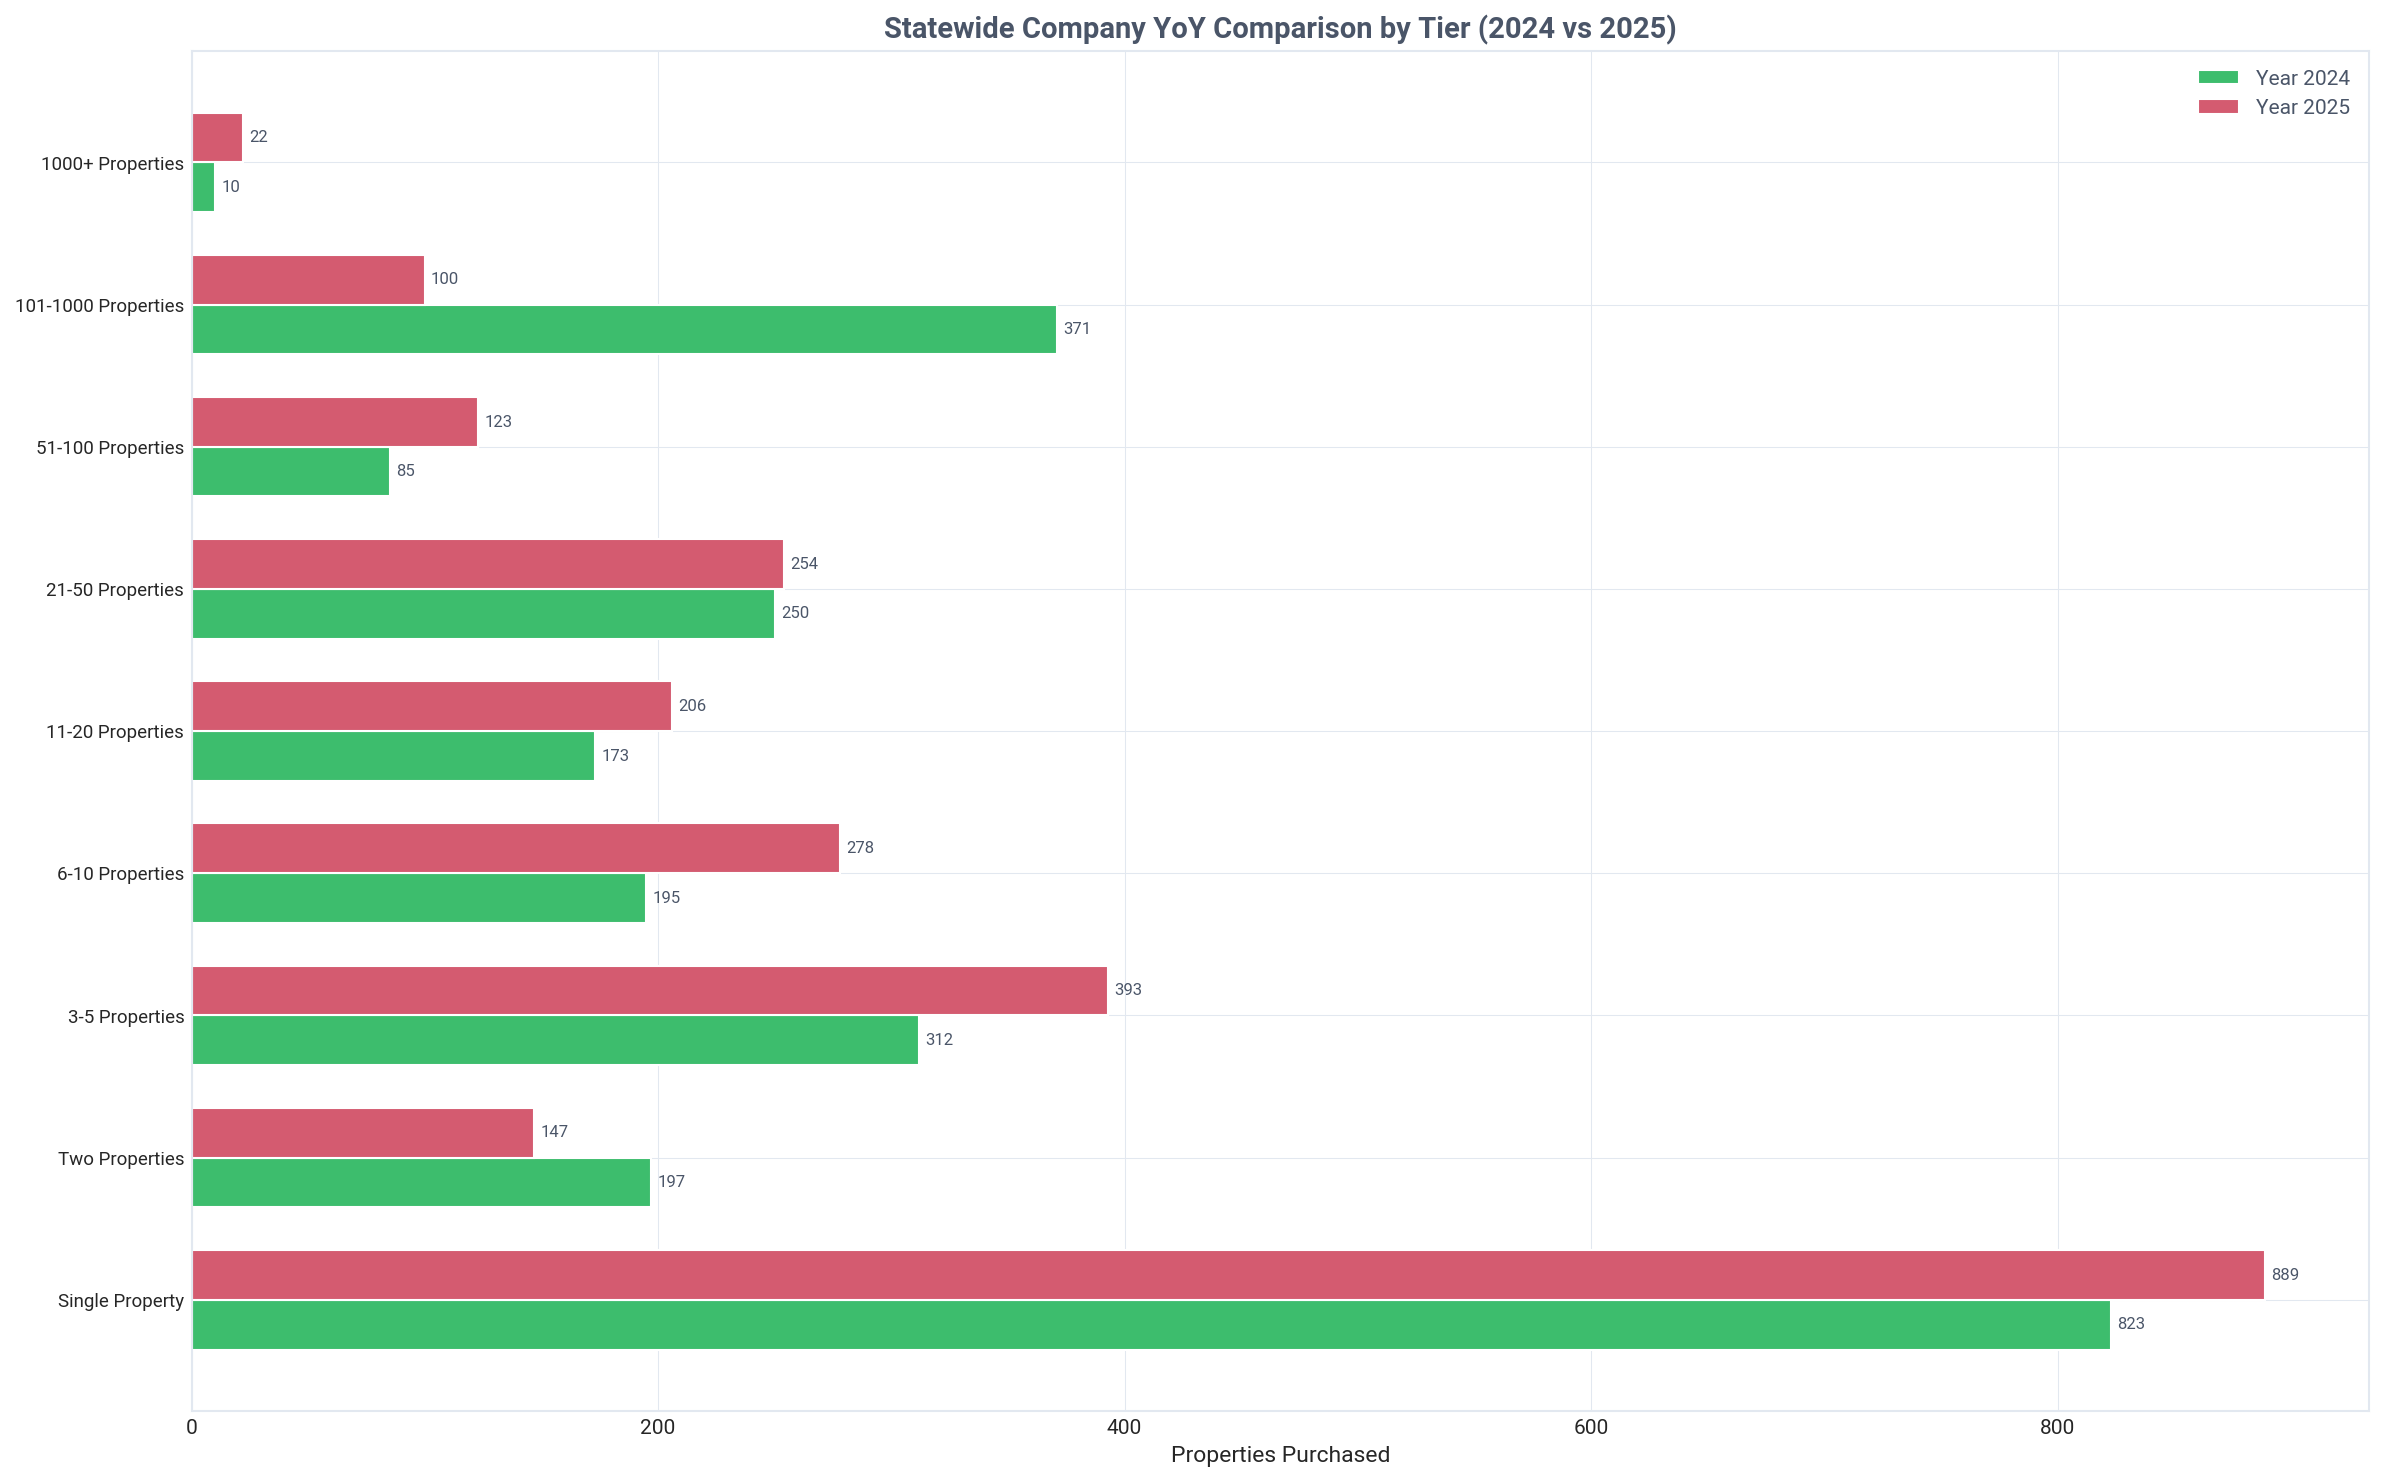
Minnesota: company purchases by tier year over year, Q4 2025
Key Insight
The crossover to majority-company ownership occurs at the 6-10 property tier, where companies own 61.7% of properties.
Detailed Findings

Individual investors form the bedrock of Minnesota's smaller-scale landlord market, owning 87.1% of single-property portfolios and 72.1% of two-property portfolios.

A distinct strategic shift occurs as portfolios grow. The 6-10 property tier marks the crossover point where companies become the majority owners, holding 61.7% of the properties in that segment. This trend accelerates dramatically in larger tiers.

Company ownership becomes nearly absolute in larger portfolios. In the 21-50 property tier, companies own 89.3% of the homes, and this figure rises to 99.8% for landlords holding 101-1000 properties.

While individuals dominate the sheer number of properties at the low end (97,577 in Tier 1), companies control the majority of properties from the 6-10 tier upwards, signaling a clear divide in operational structure based on portfolio size.

This data illustrates a natural progression in the investor lifecycle: individuals start the journey, but scaling into a mid-size or large portfolio typically involves transitioning to a corporate entity for legal and financial reasons.

Geographic Distribution

Regional breakdown of investor activity and ownership patterns

Key Insight
Hennepin County leads Minnesota with 15,610 investor-owned properties, followed by Otter Tail (9,021) and Ramsey (7,468).
Detailed Findings

Investor ownership in Minnesota is heavily concentrated in its most populous counties by volume. Hennepin County is the epicenter with 15,610 investor-owned properties, followed by Otter Tail County (9,021) and Ramsey County (7,468).

A striking contrast exists between where investors own the most properties and where their market share is highest. While Hennepin County has the highest count, its investor ownership rate is a modest 5.0%.

The highest rates of investor penetration are found in less populous, often recreational or rural counties. Aitkin County leads the state with a 42.6% investor ownership rate, followed by Renville (36.9%) and Grant (34.2%) counties.

Otter Tail County is a notable exception, appearing in the top 5 for both total count (2nd, with 9,021 properties) and ownership rate (28.7%), indicating it's a significant market for investors in both volume and density.

This geographic split reveals two distinct investor strategies: a high-volume approach in dense urban centers like Hennepin and Ramsey, and a high-penetration approach targeting what are likely vacation or rural rental markets.

Minnesota: landlord ownership map, Q4 2025
Minnesota: top 15 areas by landlord-owned properties, Q4 2025
Minnesota: top 15 areas by landlord ownership share, Q4 2025

Historical Transactions

Buy/sell transaction trends over time for all landlords and institutional investors

Minnesota: landlord buy and sell transactions, Q4 2025
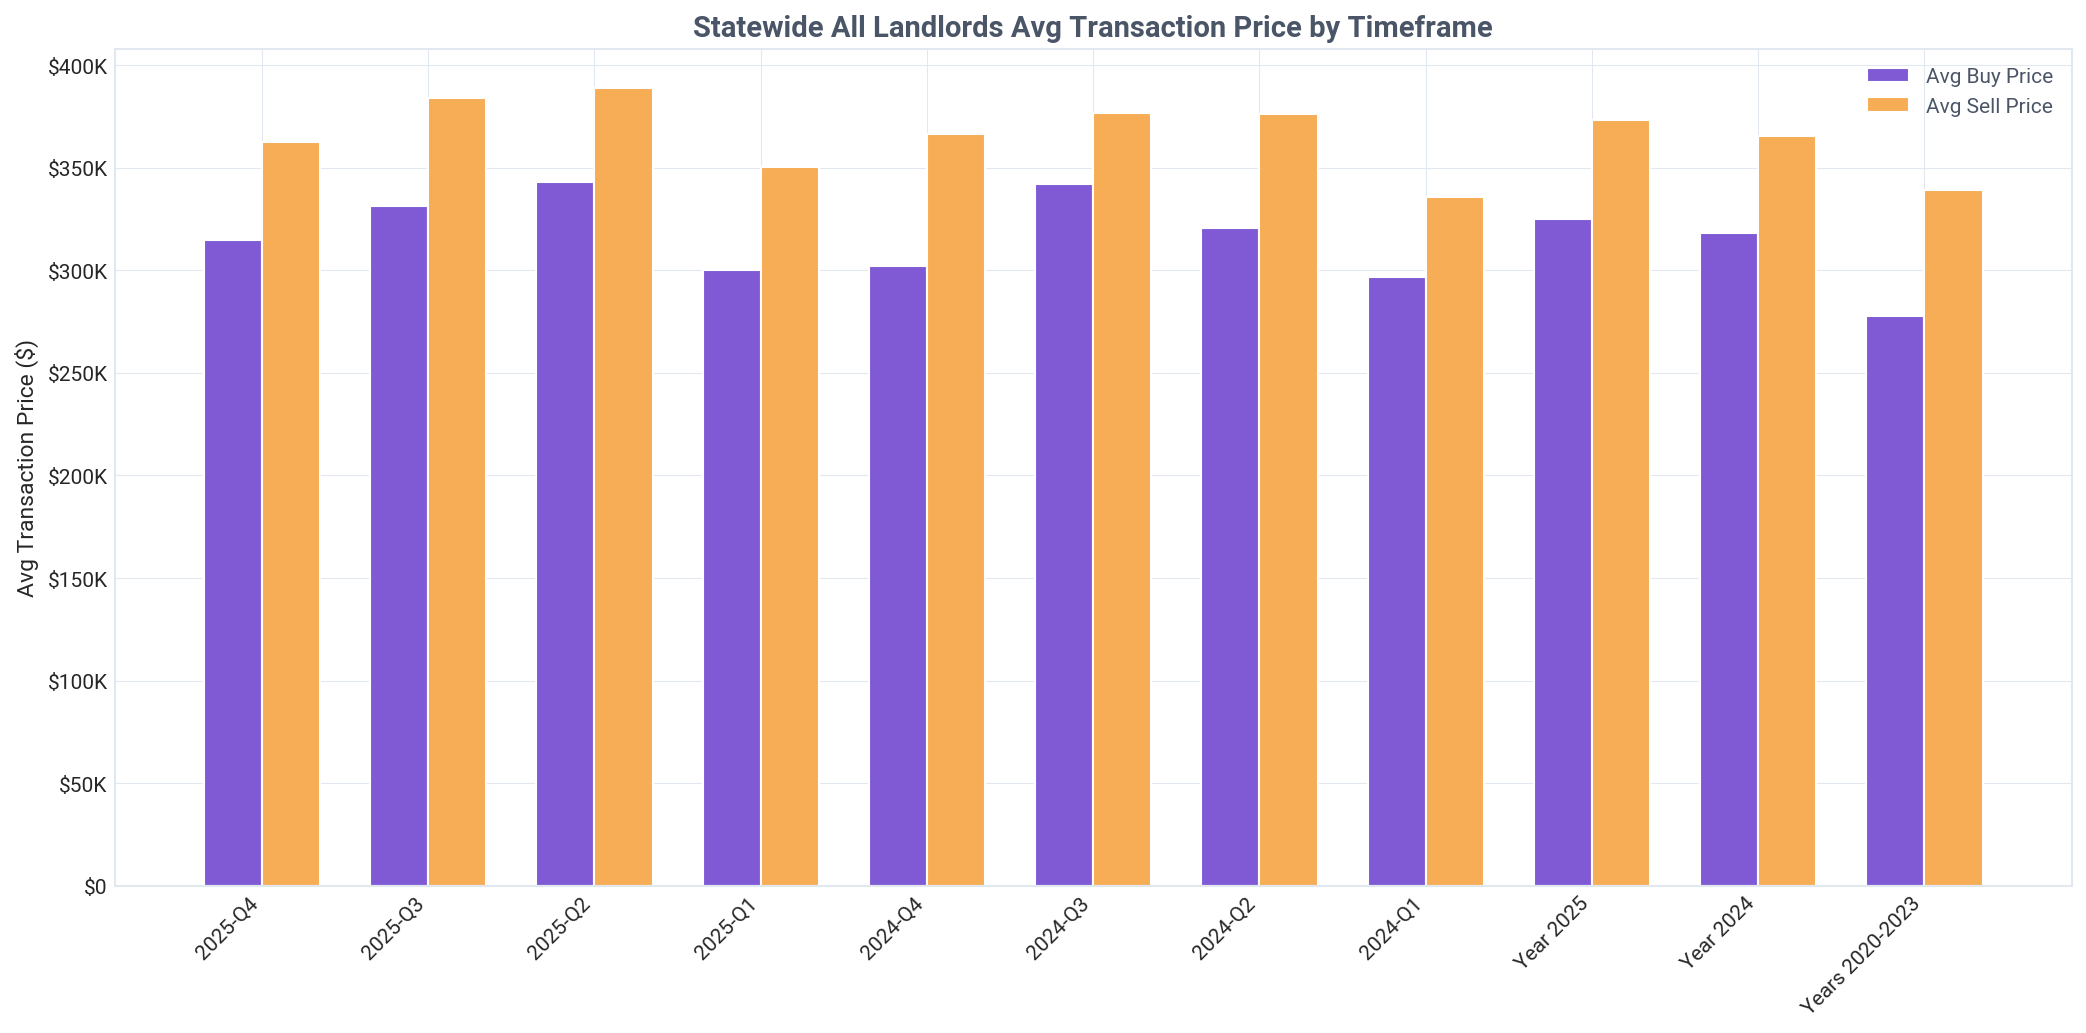
Minnesota: landlord average buy and sell prices, Q4 2025
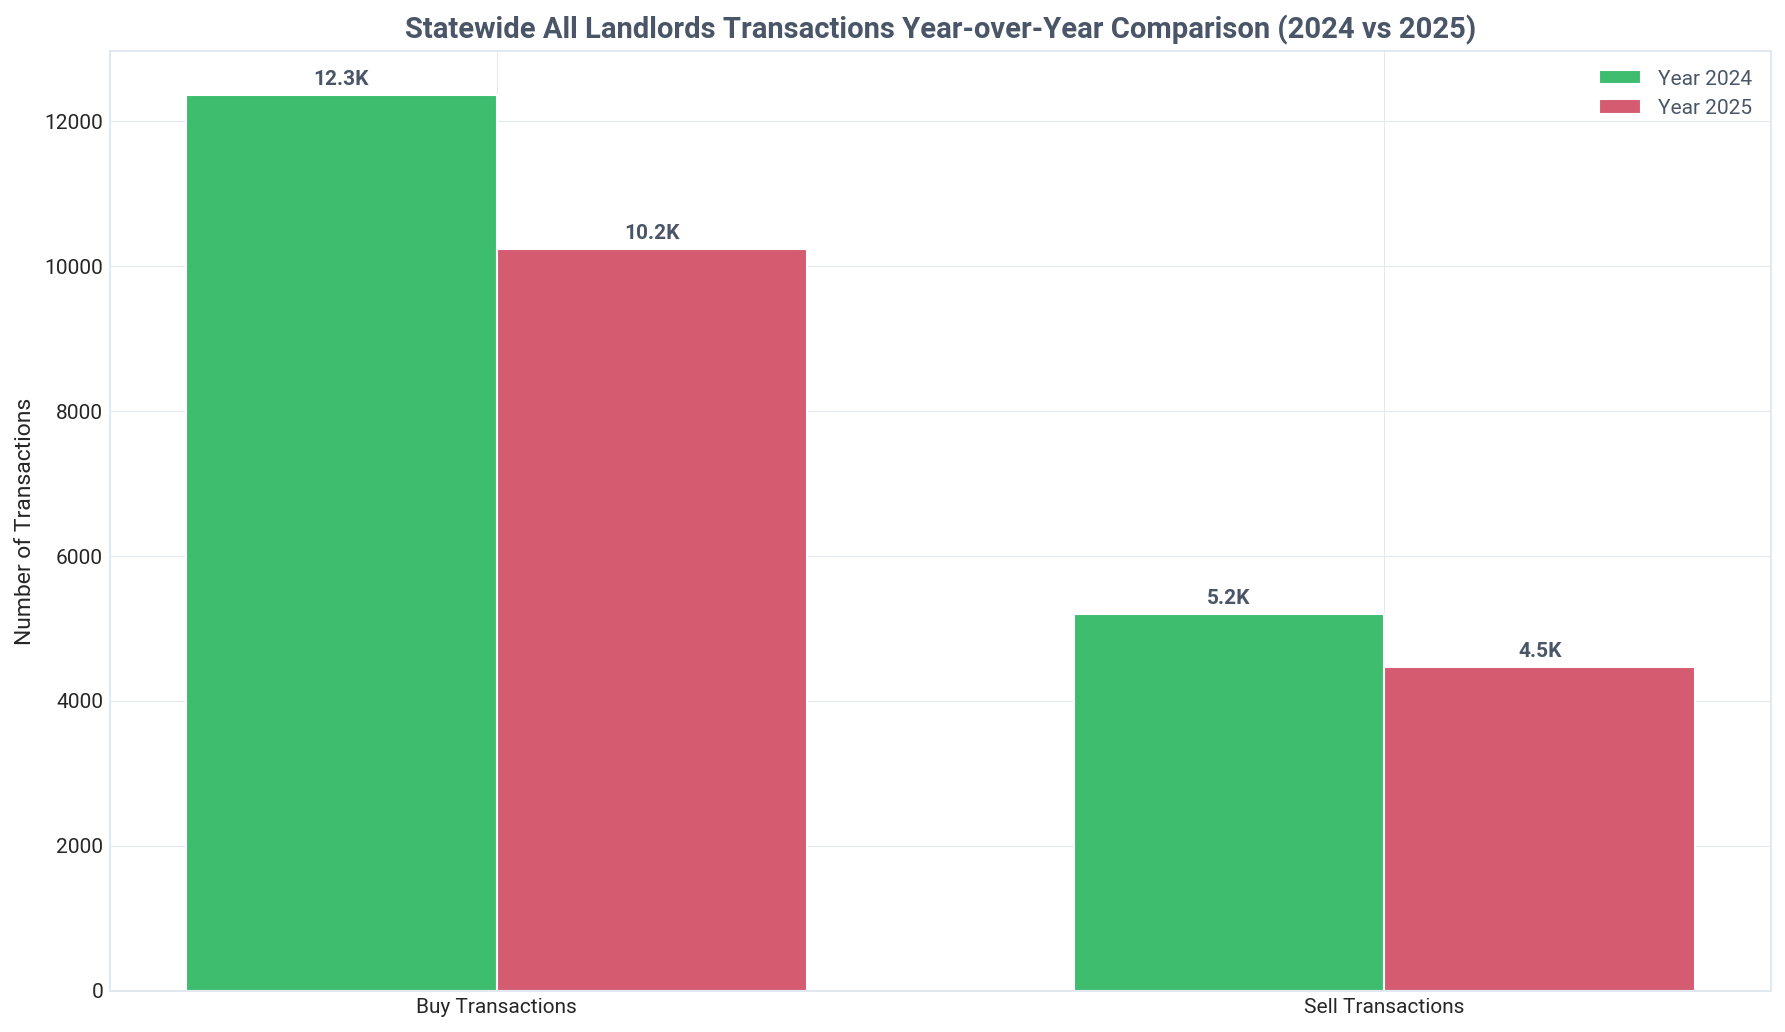
Minnesota: landlord transactions year over year, Q4 2025
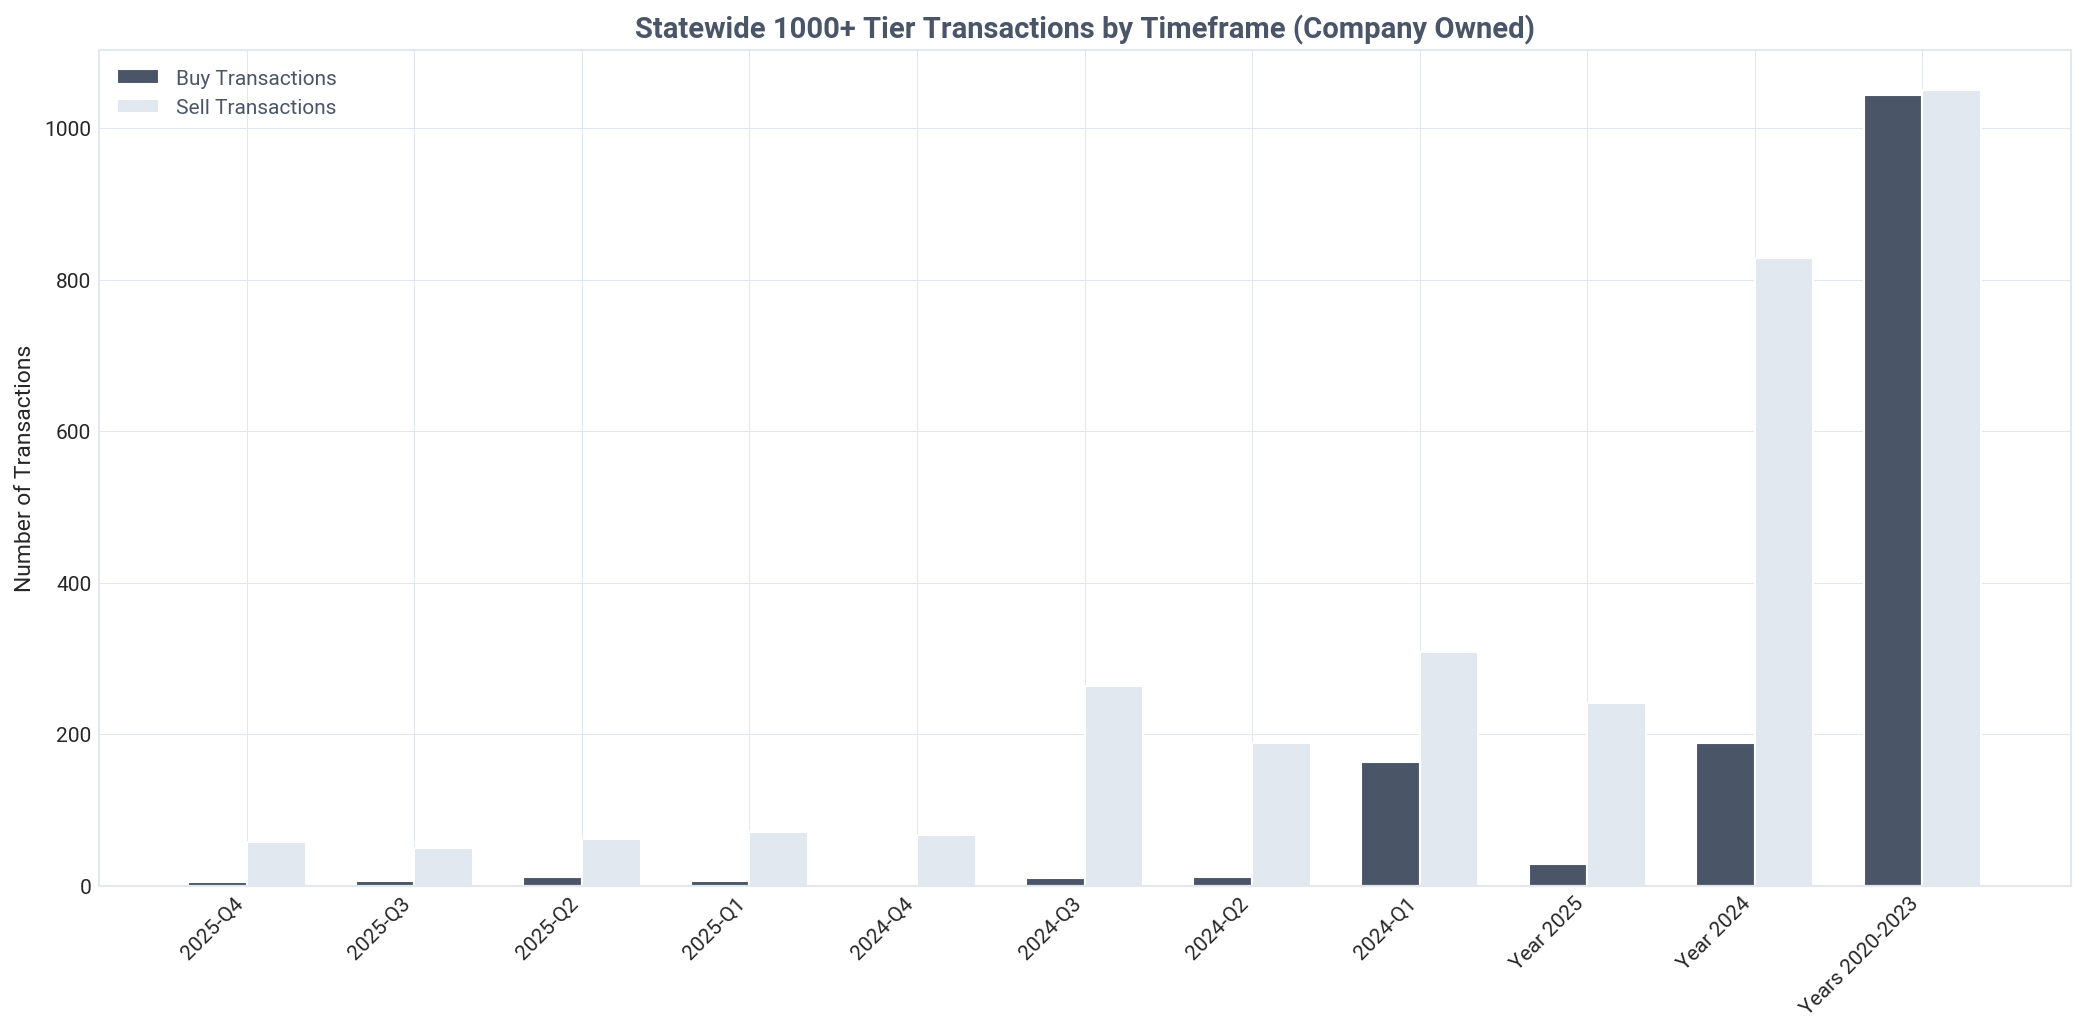
Minnesota: 1000+ tier company transactions, Q4 2025
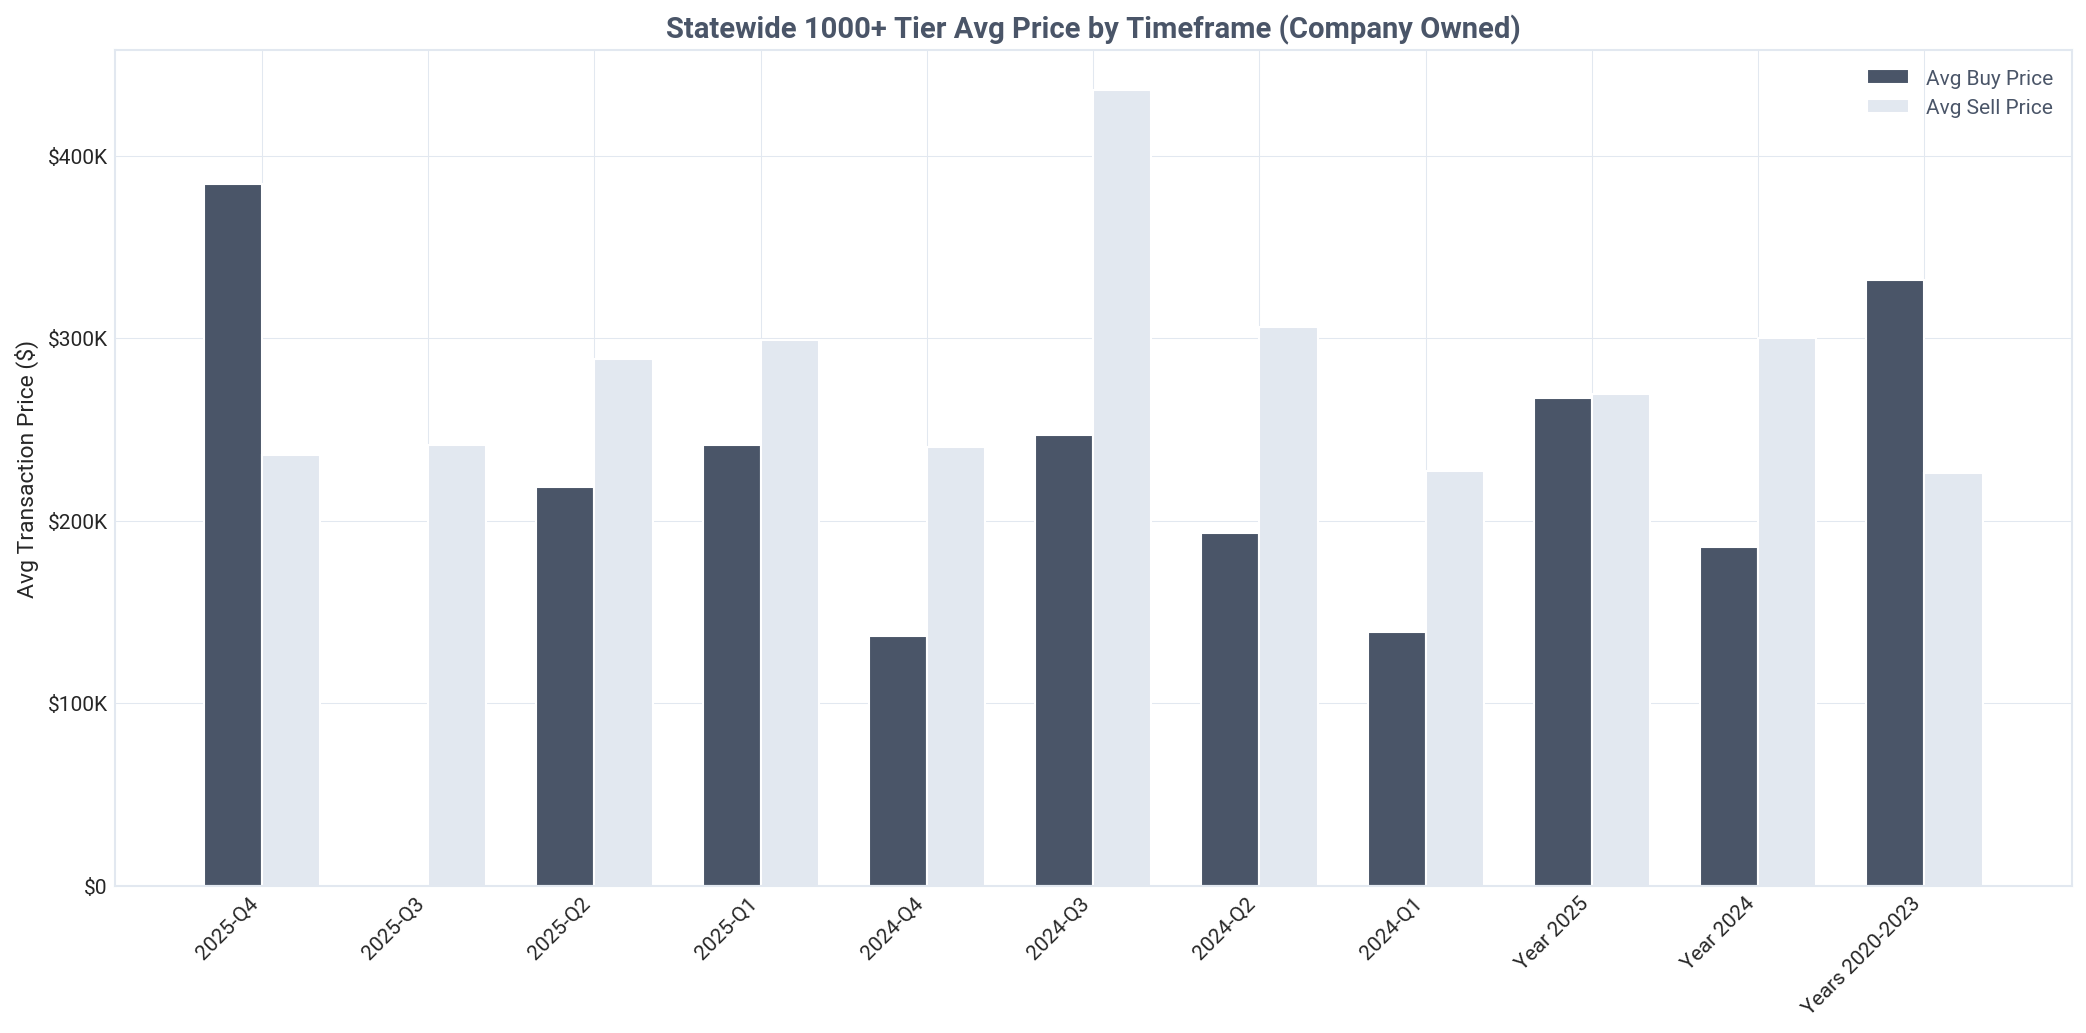
Minnesota: 1000+ tier company average prices, Q4 2025
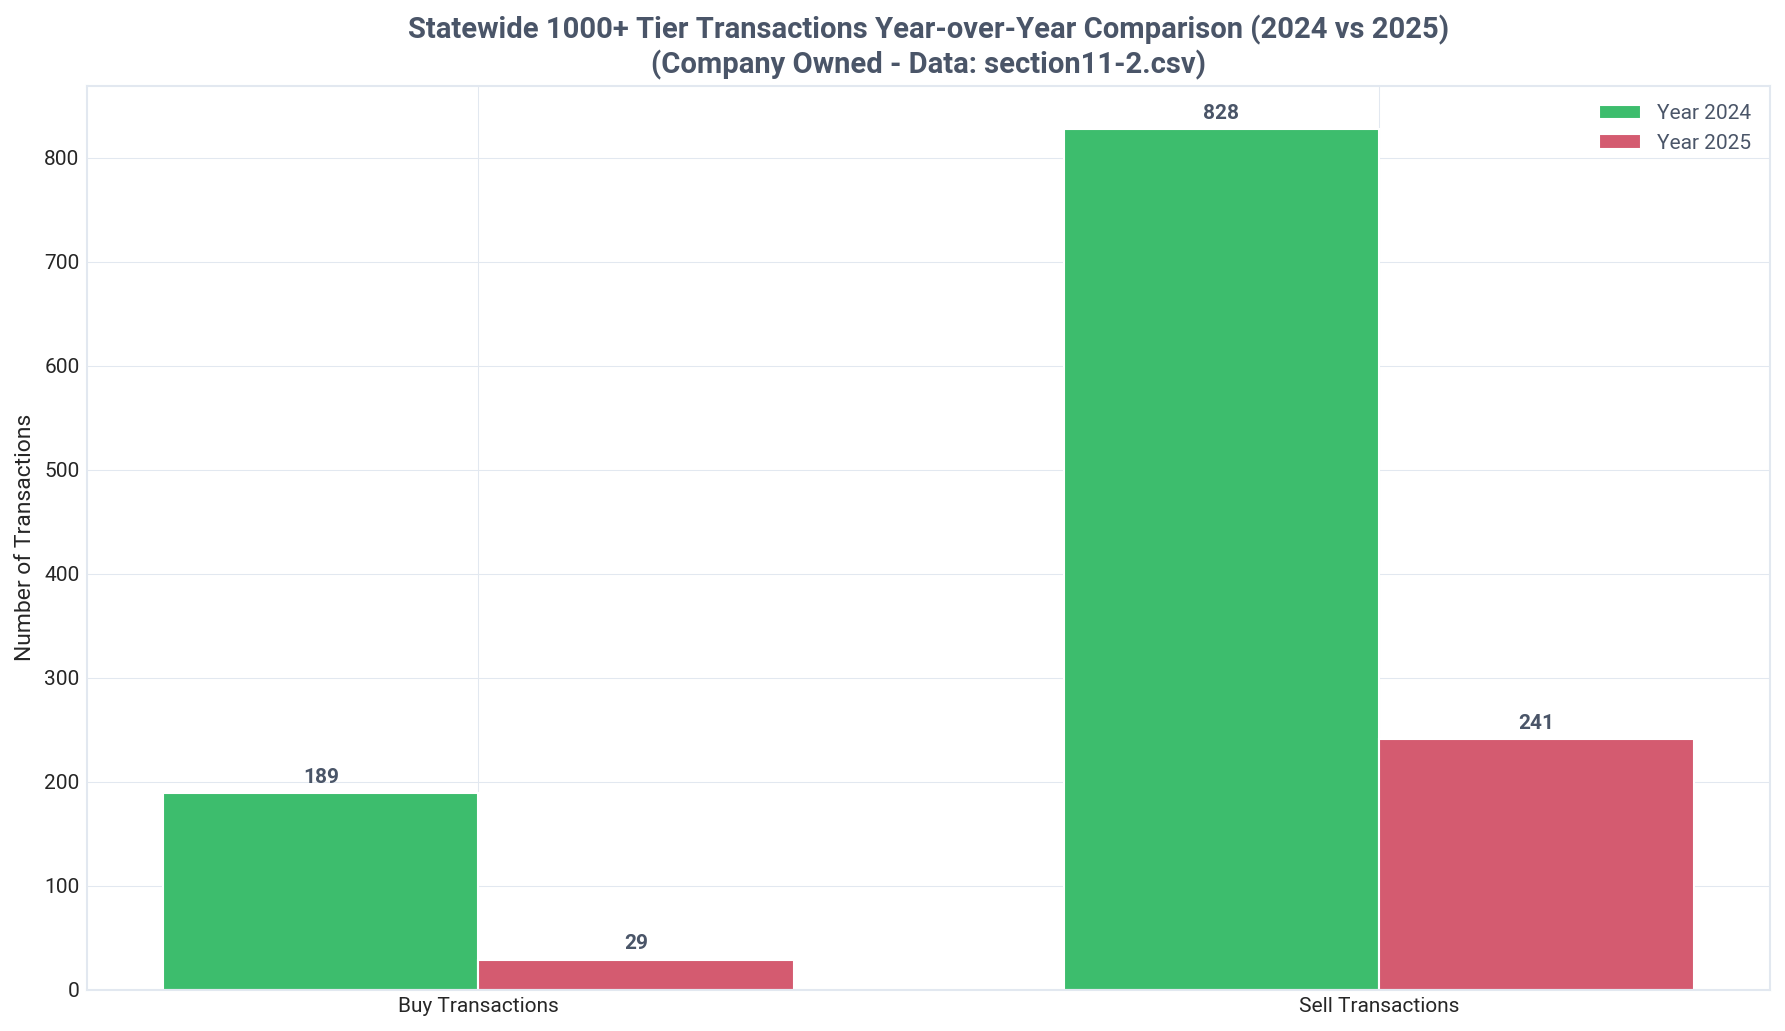
Minnesota: 1000+ tier transactions year over year, Q4 2025
Key Insight
Minnesota landlords are strong net buyers with a 2.57x buy-to-sell ratio, but institutional investors are actively divesting.
Detailed Findings

The overall investor market in Minnesota remains in a strong accumulation phase. In Q4 2025, landlords were net buyers, acquiring 2,306 properties while selling only 897, resulting in a net gain of 1,409 properties and a buy-to-sell ratio of 2.57 to 1.

This net-buyer trend has been consistent throughout the year, with landlords adding a total of 5,767 properties to their portfolios in 2025. However, transaction volume has decreased from 2024, when landlords were net buyers of 7,158 properties.

A dramatic divergence in strategy is visible between the overall market and its largest players. Institutional investors (1000+ tier) are actively divesting, ending Q4 as significant net sellers with only 5 purchases against 58 sales.

The institutional retreat is not a new phenomenon; it has been a consistent trend throughout 2025. For the full year, they sold 241 properties while purchasing only 29, a net divestment of 212 properties.

This split indicates that while smaller mom-and-pop landlords continue to see opportunity and are expanding their holdings, the largest institutional players are strategically reducing their footprint in the Minnesota market.

Current Quarter Transactions

Q4 2025 transaction analysis by tier, price, and inter-landlord activity

Key Insight
Landlords were involved in 7.5% of all single-family property transactions in Minnesota during Q4, totaling 2,306 purchases.
Detailed Findings

Investors accounted for 7.5% of all SFR transactions in Q4 2025, with 2,306 properties purchased by landlords out of a total of 30,948 market transactions.

A significant price disparity exists between the smallest and largest investors. Institutional buyers (1000+) paid an average of $384,410 per property, a 14.7% premium over the $335,128 average paid by first-time single-property landlords.

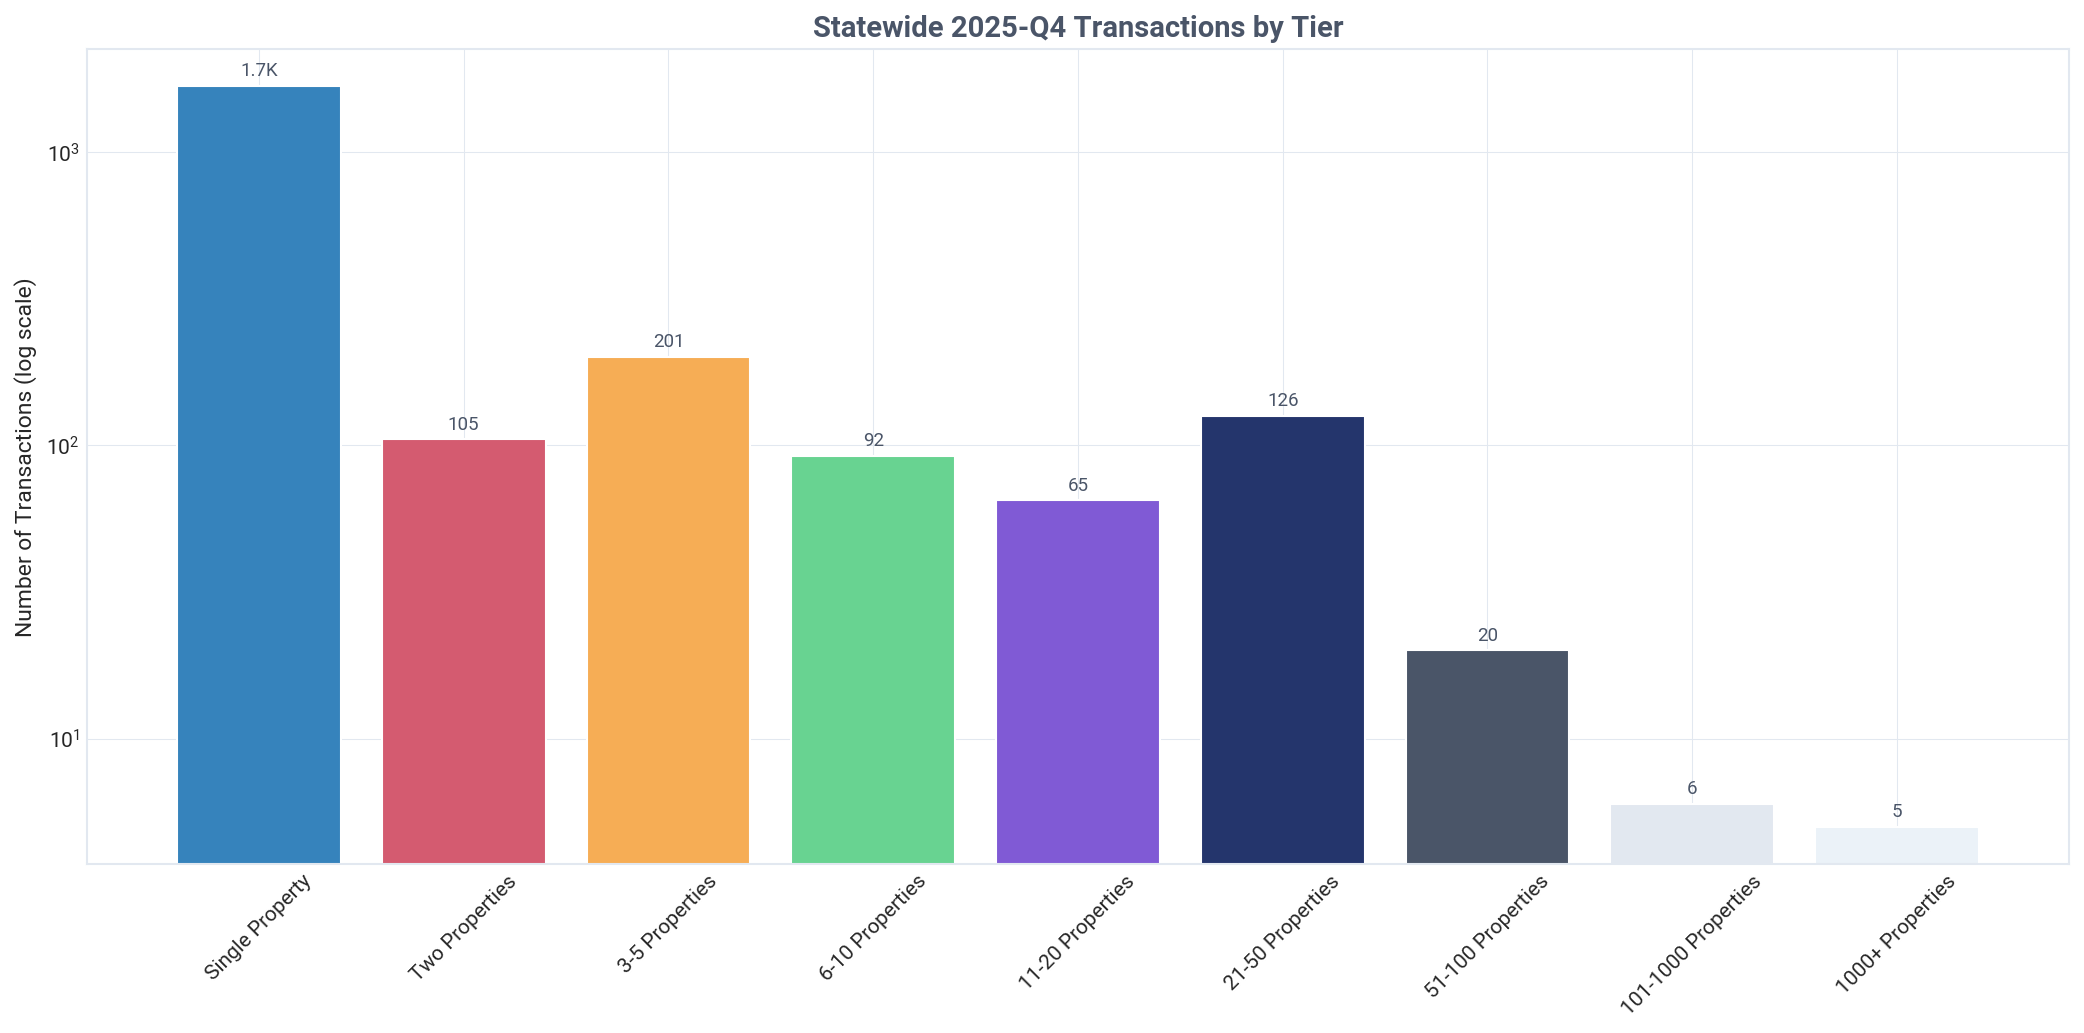
The overwhelming majority of Q4 transactions were driven by mom-and-pop investors (Tiers 01-04), who were responsible for 2,084 purchases. In contrast, institutional investors made only 5 purchases, highlighting a market dominated by small-scale activity.

Institutional buyers show a clear preference for acquiring properties from existing investors. A majority (60.0%) of their 5 purchases came from other landlords, suggesting a strategy focused on acquiring proven rental assets.

Conversely, new single-property landlords primarily buy from traditional homeowners, with only 8.1% of their 1,686 acquisitions sourced from other investors. This indicates they are the primary channel through which housing stock moves from owner-occupancy into the rental market.

Minnesota: landlord share of transactions, Q4 2025
Minnesota: transactions by tier this quarter, Q4 2025
Minnesota: average purchase price by tier, Q4 2025

Ready to leverage this data for your real estate investment decisions?

TALK TO AN EXPERT

Executive Summary

Minnesota's SFR investor market is defined by small landlord growth and institutional retreat, with mom-and-pops controlling 90.5% of assets.
Holdings
Landlords own 151,741 SFR properties in Minnesota, representing 8.9% of the state's total market. Individual investors are the primary force, holding 75.7% (114,812 properties) compared to companies at 25.7% (39,000 properties).
Pricing
Investors in Minnesota consistently purchase at a discount, paying 21.7% less than traditional homeowners in Q4 2025—an average savings of $89,169 per property ($322,632 vs. $411,801).
Activity
Investors purchased 8.5% of homes sold in Q4 (1,639 properties), an influx driven by small operators, including 1,651 new single-property landlords entering the market.
Market Share
The market is highly decentralized, with mom-and-pop landlords (1-10 properties) controlling 90.5% of investor-owned housing, while institutional investors (1000+) own a marginal 1.0% share.
Ownership Type
Individual investors dominate smaller portfolios, but a strategic shift occurs at the 6-10 property tier, where companies become the majority owners (61.7%) and expand their share in all larger tiers.
Transactions
Small investors are in accumulation mode, with landlords overall acting as net buyers in Q4 (2,306 buys vs. 897 sells). Conversely, institutional investors are net sellers, offloading 58 properties while acquiring only 5.
Market Narrative

The single-family rental market in Minnesota is fundamentally a story of local, small-scale enterprise, not corporate dominance. Investors own 151,741 properties, 8.9% of the state's total SFR stock, but this ownership is highly fragmented. Individual investors are the clear backbone, holding 75.7% of the portfolio. The 'mom-and-pop' segment (1-10 properties) controls a staggering 90.5% of all investor-held homes, while institutional firms with over 1,000 properties own just 1.0%, defying the common narrative of a Wall Street takeover.

Investor behavior in Minnesota reveals a clear strategic advantage and a bifurcated market. In Q4 2025, landlords acquired 8.5% of all homes for sale, securing them at a significant 21.7% discount compared to traditional homeowners. The market's momentum is driven entirely by smaller players, who remained strong net buyers with a 2.57-to-1 buy/sell ratio. In stark contrast, the largest institutional players are actively retreating, ending the quarter as heavy net sellers, a trend that has persisted throughout the entire year.

The key takeaway is that the health and direction of Minnesota's SFR rental market are dictated by the collective actions of thousands of individual investors. While institutional capital is flowing out, new and existing small landlords are stepping in, acquiring properties at a value and expanding their portfolios. This dynamic suggests that opportunities for local investors who can leverage market knowledge remain robust, ensuring the state's rental landscape continues to be shaped from the ground up.

About This Report

Report Methodology

This report analyzes BatchData's Investor Pulse dataset, covering single-family residential (SFR) investor activity across the United States.

Data is extracted from 15 CSV files covering ownership, transactions, and pricing trends, then analyzed using AI-powered insights.

Property Counting Methodology:

Distinct Counts: All headline totals represent distinct properties. If 2+ landlords co-own the same property, it's counted only once. This provides accurate market representation.

Category Breakdowns: When analyzing by tier (01-09), owner type (Individual/Corporate), or occupancy status, properties with co-ownership across categories are counted once per category. This causes breakdowns to sum 2-4% higher than totals, and percentages may sum to 100-104%. This is expected and reflects co-ownership patterns.

Tier Properties Category
01-041-10Mom-and-Pop
05-0711-100Mid-Size
08101-1000Large
091000+Institutional
About BatchData

BatchData provides comprehensive real estate data and analytics, offering insights into property ownership, investor activity, and market trends across the United States.

The Investor Pulse dataset tracks single-family residential (SFR) investor behavior at national, state, county, and MSA levels.

For more information, visit batchdata.io or explore our API documentation.

Data Freshness
Report Generated March 09, 2026 at 10:22 PM
Data Period Q4 2025
Geography Level State
Geography Minnesota
×
Chart Section2 Coverage
Minnesota: SFR vs other property coverage, Q4 2025
×
Chart Section3 Ownership Donut
Minnesota: SFR ownership share, company vs individual, Q4 2025
×
Chart Section3 Ownership Bar
Minnesota: SFR properties by owner type, Q4 2025
×
Chart Section4 Distribution
Minnesota: company vs individual landlords, Q4 2025
×
Chart Section5 Holdings
Minnesota: landlord SFR holdings by type, Q4 2025
×
Chart Section6 Prices
Minnesota: properties purchased by timeframe, Q4 2025
×
Chart Section6 Prices Alt
Minnesota: average acquisition price by timeframe, Q4 2025
×
Chart Section6 Yoy Comparison
Minnesota: average acquisition price year over year, Q4 2025
×
Chart Section6 Trends
Minnesota: average acquisition price by buyer type, Q4 2025
×
Chart Section7 Purchases
Minnesota: purchases by tier, Q4 2025
×
Chart Section7 Tiers
Minnesota: purchased property share by tier, Q4 2025
×
Chart Section8 Distribution
Minnesota: current ownership by purchase tier, Q4 2025
×
Chart Section8 Prices
Minnesota: properties purchased by tier, all time, Q4 2025
×
Chart Section8 Prices Q4
Minnesota: properties purchased by tier this quarter, Q4 2025
×
Chart Section8 Prices 2020
Minnesota: properties purchased by tier, historical, Q4 2025
×
Chart Section8 Yoy Comparison
Minnesota: properties purchased by tier year over year, Q4 2025
×
Chart Section9 Ownership
Minnesota: ownership by tier and owner type, Q4 2025
×
Chart Section9 Growth
Minnesota: company purchases by tier, all time, Q4 2025
×
Chart Section9 Growth Q4
Minnesota: company purchases by tier this quarter, Q4 2025
×
Chart Section9 Yoy Comparison
Minnesota: company purchases by tier year over year, Q4 2025
×
Chart Section10 Top Regions
Minnesota: top 15 areas by landlord-owned properties, Q4 2025
×
Chart Section10 Top Pct
Minnesota: top 15 areas by landlord ownership share, Q4 2025
×
Chart Section10 Map
Minnesota: landlord ownership map, Q4 2025
×
Chart Section11 Buysell
Minnesota: landlord buy and sell transactions, Q4 2025
×
Chart Section11 Buysell Price
Minnesota: landlord average buy and sell prices, Q4 2025
×
Chart Section11 Yoy All Landlords
Minnesota: landlord transactions year over year, Q4 2025
×
Chart Section11 Institutional
Minnesota: 1000+ tier company transactions, Q4 2025
×
Chart Section11 Institutional Price
Minnesota: 1000+ tier company average prices, Q4 2025
×
Chart Section11 Yoy Institutional
Minnesota: 1000+ tier transactions year over year, Q4 2025
×
Chart Section12 Transactions
Minnesota: landlord share of transactions, Q4 2025
×
Chart Section12 Prices
Minnesota: transactions by tier this quarter, Q4 2025
×
Chart Section12 Prices Detail
Minnesota: average purchase price by tier, Q4 2025

Licensing & Usage Rights

This report, data, and all visual analyses are the property of BatchData © 2025 BatchService, Inc. and are licensed under Creative Commons Attribution-NonCommercial-NoDerivatives 4.0 International (CC BY-NC-ND 4.0).

You MAY: Download, share, or excerpt this content for personal or non-commercial purposes, provided you give clear attribution to BatchData with a link back to this original page.

You MAY NOT: Use this data commercially, resell or redistribute it as your own, or publish modified versions.

For commercial licensing: batchdata.io/contact-sales

Creative Commons BY-NC-ND 4.0 - creativecommons.org/licenses/by-nc-nd/4.0/

How to cite this report

BatchData. (2025). Q4 2025 MN State Report. BatchService, Inc. Retrieved from https://reports.batchdata.io/investorpulse-reports/2025-q4-state-mn/. Licensed under CC BY-NC-ND 4.0.